М.Н.СТРИХАНОВ, Н.Н.ДЕГТЯРЕНКО, В.В.ПИЛЮГИН,
Е.Е. МАЛИКОВА, Н.А. МАТВЕЕВА, В.Д. АДЖИЕВ*, А.А.ПАСЬКО*
Национальный исследовательский ядерный университет «МИФИ», Россия
* Британский национальный центр компьютерной анимации при университете Борнмута, Великобритания
MNStrikhanov@mephi.ru, NNDegtyarenko@mephi.ru, pilyugin@sv-journal.com, malikova@sv-journal.com, matveeva@sv-journal.com, vadzhiev@bournemouth.ac.uk, apasko@bournemouth.ac.uk
Оглавление
Описаны результаты работ в области визуализации наноструктур, проводимых в настоящее время в МИФИ совместно с Британским национальным центром компьютерной анимации при университете Борнмута. Рассматриваются характеристики комплекса инструментальных программных средств научной визуализации. Приведены примеры прикладных программ научной визуализации и результаты их апробации на расчетных файлах наноструктур, полученных в процессе их компьютерного моделирования.
Ключевые слова: анализ данных, научная визуализация, наноструктура, научные исследования, прикладная программа, файл исходных данных, графическая интерпретация.
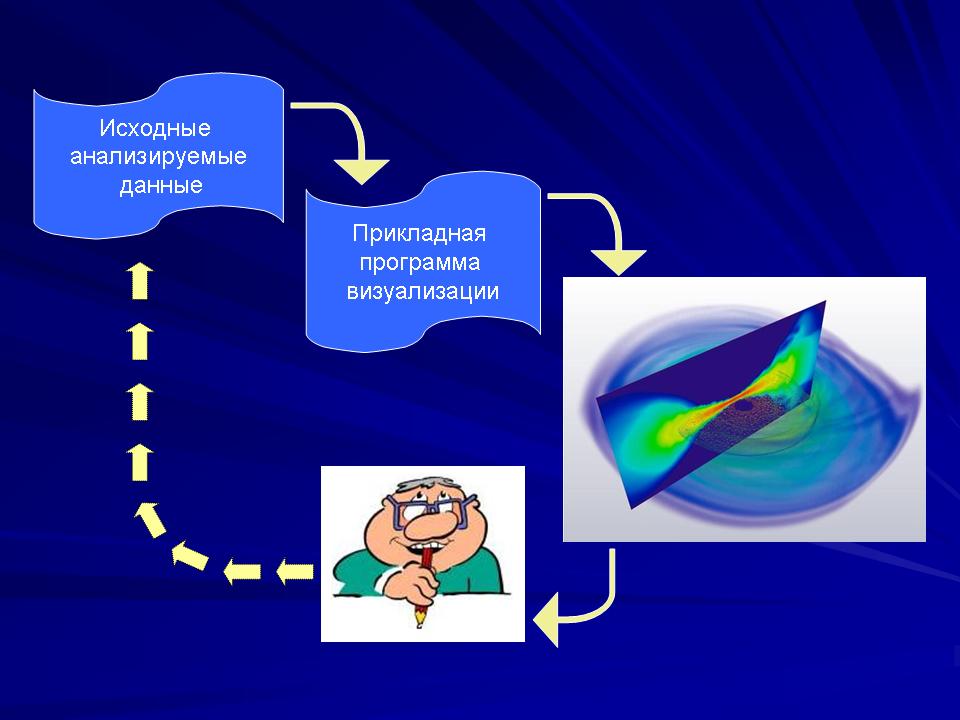
Как показывает практика, при проведении различных научных исследований часто встречаются задачи анализа тех или иных данных. Для решения таких задач в настоящее время широко используется метод научной визуализации [1,2]. Суть этого метода заключается в том, что исходным анализируемым данным при помощи компьютера ставится в соответствие их некоторая статическая или динамическая графическая интерпретация, которая визуально анализируется, а результаты анализа этой графической интерпретации затем истолковываются по отношению к исходным данным (Рис. 1).
Рис.1. Метод научной визуализации
Можно сказать, что основная задача научной визуализации – это сделать невидимое видимым [2]. Под невидимым понимаются как реальные, так и абстрактные объекты, непосредственно недоступные человеческому зрению. Реальный объект невидим, если он является "очень большим" (например галактика) или "очень маленьким" (например микро- и наноструктуры реального мира) . Абстрактый объект (например, функция многих переменных) невидим в силу своей нематериальной природы (Рис.2).
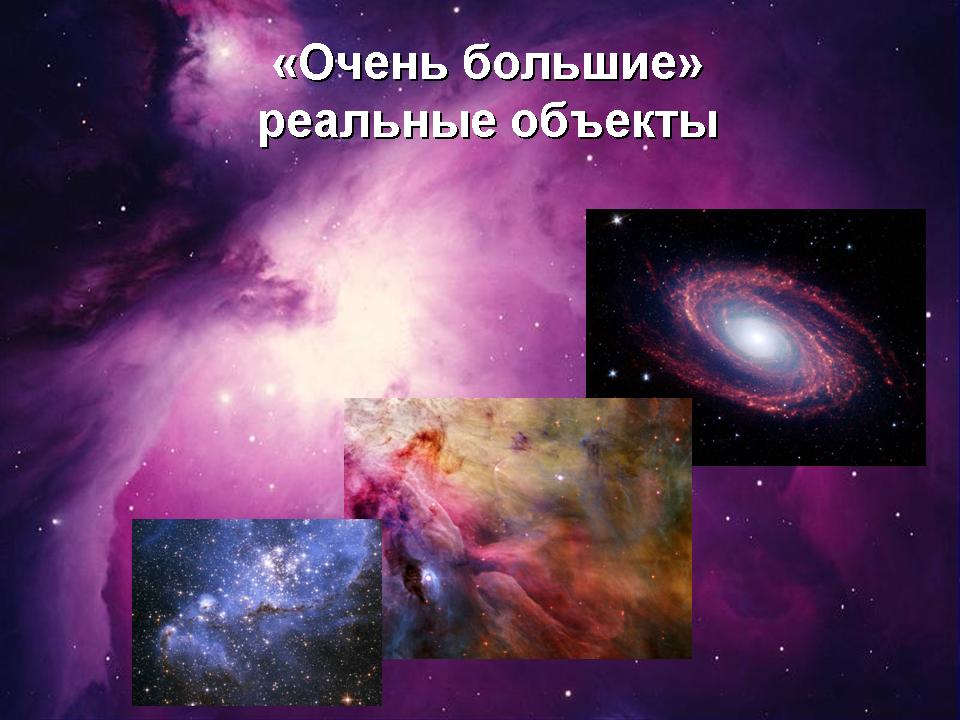
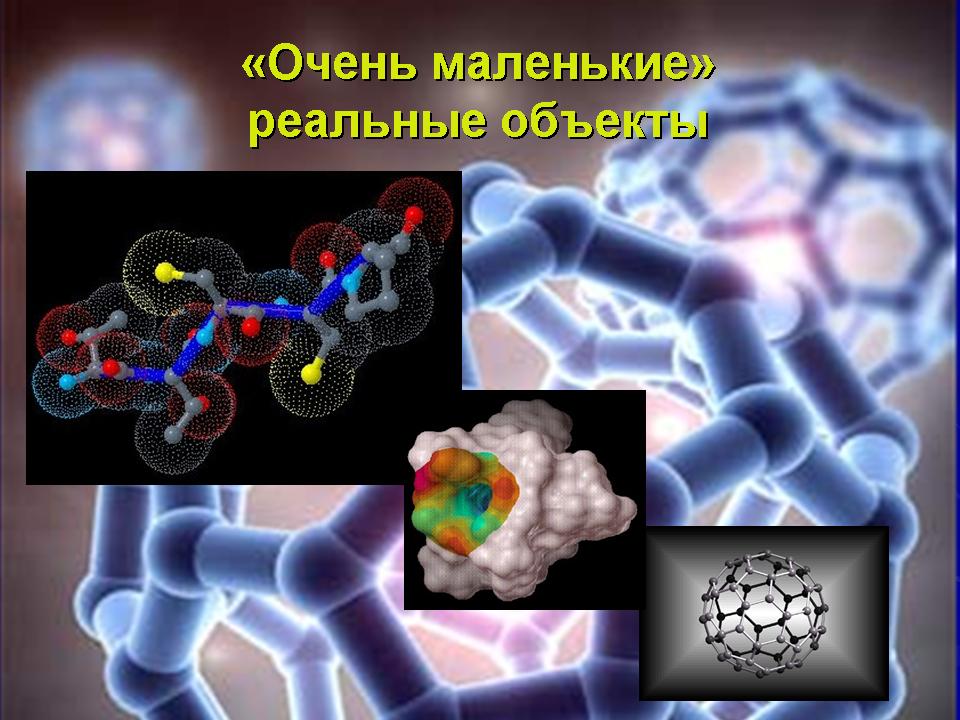
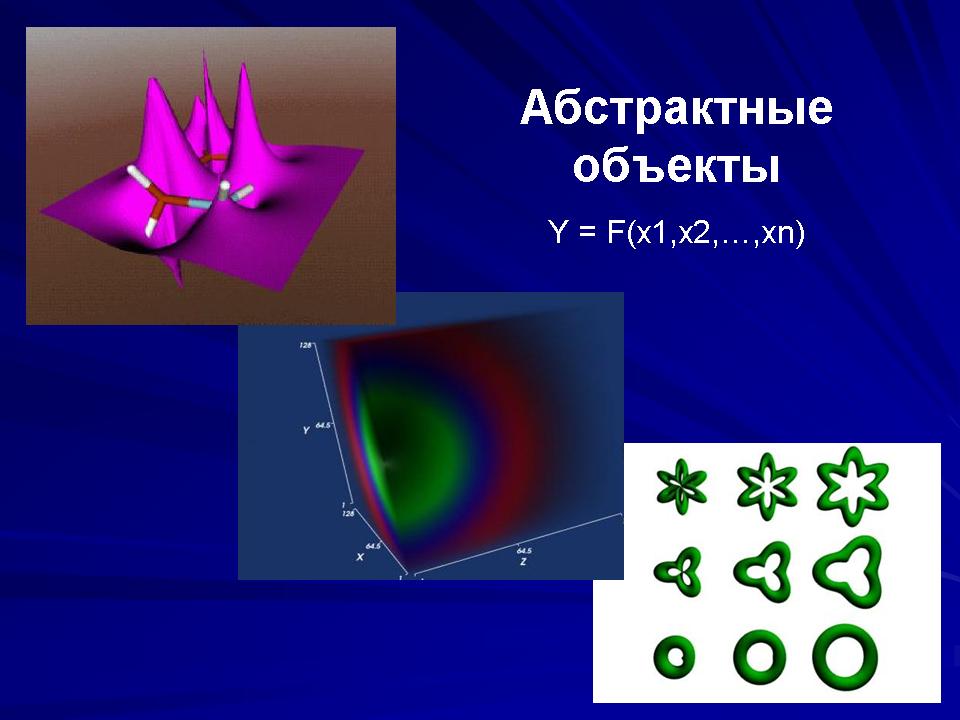
Рис.2. Визуализация невидимых объектов
В настоящее время метод научной визуализации широко применяется при проведении различных физических исследований в Национальном исследовательском ядерном университете “МИФИ”. В данной статье представлены работы в области компьютерной визуализации наноструктур. Эти работы в настоящее время проводятся совместными усилиями кафедры “Компьютерное моделирование и физика наноструктур и сверхпроводников” и учебно - научной лаборатории “Научная визуализация” НИЯУ МИФИ. В этих работах принимает также участие Британский национальный центр компьютерной анимации.
Эти работы включают в себя:
- разработку комплекса инструментальных программных средств научной визуализации;
- создание прикладных программ визуализации наноструктур с использованием этого комплекса;
- апробацию прикладных программ визуализации на расчетных файлах наноструктур, полученных в процессе их компьютерного моделирования.
Комплекс представляет собой совокупность автономно и совместно используемых программных продуктов 3ds Max [4], HyperFun [5], Jmol апплет [6], Cortona3D Viewer [7] и их функциональных расширений (FE)[3]. Взаимодействие прикладных программ и комплекса показана на Рис.3.
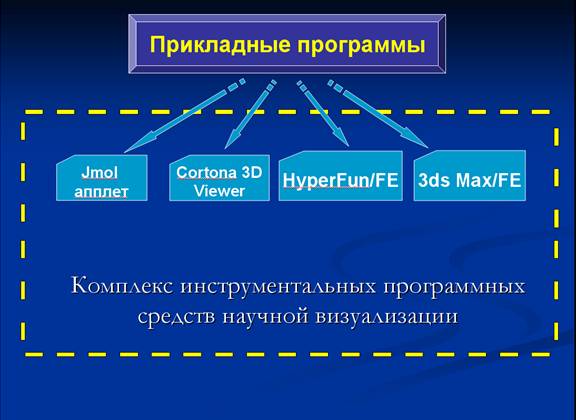
Рис. 3. Взаимодействие прикладных программ и комплекса
Следует отметить, что указанные инструментальные программные средства комплекса научной визуализации обладают широкими функциональными возможностями, которые позволяют создавать на их основе сложные прикладные программы для пассивной и интерактивной визуализации.
Охарактеризуем компоненты комплекса.
3ds Max
3ds Max — широко известный программный продукт, предназначенный для моделирования и визуализации произвольных сложных пространственных сцен [4]. Он располагает развитыми функциональными возможностями геометрического моделирования (полигональное моделирование, моделирование на основе неоднородных рациональных B-сплайнов, моделирование на основе порций поверхностей Безье, моделирование с использованием встроенных библиотек стандартных параметрических объектов (примитивов и модификаторов) и визуализации пространственных объектов (программы рендеринга Scanline render, Mental ray и др.).
Архитектура 3ds Max - открытая, что позволяет расширять его функциональные возможности путем написания плагинов - специализированных программных модулей. Для написания таких плагинов служит 3ds Max SDK (MaxSdk) — набор из средств разработки, утилит и документации, который позволяет разработчикам создавать программные средства по определённой технологии и для программной среды 3ds Max. Программный язык написания таких плагинов – С++.
Для написания прикладных программ визуализации на базе 3ds Max предусмотрен специальный скриптовый язык – Maxscript. На языке MaxScript можно также писать плагины, которые в свою очередь могут использовать ранее написанные плагины. Язык Maxscript - язык программирования, созданный специально для работы в среде 3ds Max, он имеет более простую структуру и синтаксис, нежели C++. Этот интерпретируемый язык не требует в отличие от C++ компиляции и сборки исходного кода. Это достоинство сопровождается вытекающим из него недостатком – программа выполняется более медленно, нежели аналогичная программа на C++.
HyperFun
Программный комплекс HyperFun обеспечивает возможность решения задач моделирования и визуализации сложных геометрических объектов [5]. В основе концепции геометрического моделирования HyperFun лежит функциональное представление (FRep) - задание геометрического объекта как единого целого с помощью одной вещественной непрерывной описывающей функции нескольких переменных в виде F(X). Frep позволяет объединить такие разные по природе модели, как классические неявно заданные примитивы, объекты на базе скелетонов, теоретико-множественные твердые тела, заметания, воксельные объекты, параметрические и процедурные модели.
Моделирование на основе функционального представления осуществляется с помощью языка высокого уровня HyperFun и поддерживающих его программных продуктов: HyperFun Polygonizer, POVRay with HyperFun support, Hyperfox и др.
Эти продукты обеспечивают развитые функциональные возможности:
- широкий и легко расширяемый набор геометрических примитивов и операций;
- процедурная генерация структур высокой сложности;
- моделирование физических свойств с помощью точечных атрибутов;
- визуализация сложных геометрических объектов с использованием кусочно-линейной аппроксимации (полигонизации) и трассировки лучей.
Язык HyperFun позволяет описывать как сами геометрические объекты, так и их внутренние свойства (цвет, материал и т.д.). Описываемый геометрический объект может быть задан в пространстве размерности 1D, 2D, 3D, 4D и даже kD.
Jmol апплет
Jmol апплет обеспечивает возможность моделирования и визуализации специализированных пространственных сцен [6]. В большинстве случаев геометрическая модель пространственной сцены представляет собой совокупность сфер (атомы) и цилиндров (связи между атомами). Наряду с этим Jmol апплет представляет функциональные возможности для задания физических характеристик пространственной сцены, а также ряда атрибутов ее визуализации. Jmol апплет обеспечивает выполнение функциональных процедур измерения пространственной сцены и выполнения необходимых вычислений.
Необходимо отметить, что апплет обеспечивает возможность написания как пассивных, так и интерактивных прикладных программ визуализации, предназначенных для выполнения на локальном компьютере или в сети Интернет.
Указанные выше функциональные возможности Jmol апплета доступны из прикладной программы визуализации, написанной на языке Jmol Scripting Language.
Cortona3D Viewer
Программа представляет собой плагин браузера для высококачественной визуализации статических и динамических пространственных сцен, описание которых представлено в формате VRML [7]. Предоставляются версии работающие с браузерами Internet Explorer, Netscape Browser, Mozilla Firefox. В настоящее время Cortona3D Viewer работает в среде Windows.
Прикладные программы визуализации, разработанные на базе инструментальных программных средств комплекса, предназначены для решения различных задач, которые имеют место в рамках проводимых в МИФИ исследований различных наноструктур. Среди этих задач можно выделить две типовые задачи:
- задача анализа взаимного расположения компонентов исследуемой наноструктуры;
- задача анализа поля исследуемой наноструктуры.
Обе эти задачи по своей сути являются геометрическими задачами.
Рассмотрим примеры разработанных прикладных программ визуализации анализируемых наноструктур.
Программа визуализации нанообъектов N192
В этой программе визуализации в качестве исходных данных используется описание анализируемого нанообъекта N192 в формате XYZ – файла. Описание структуры формата представлено на Рис.4.
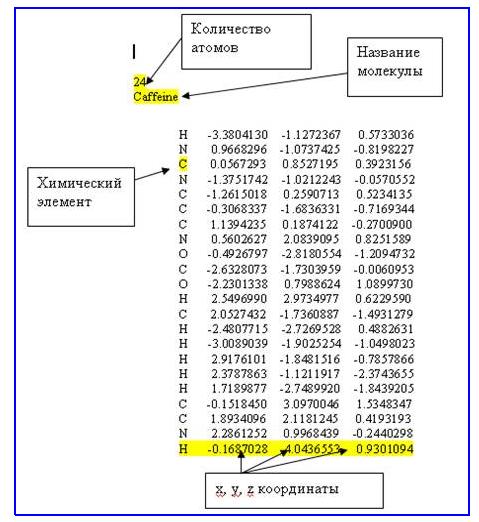
Рис.4. Структуры формата XYZ-файла
Результатом работы этой программы является проекционное графическое изображение нанообъекта. Пример такого изображения показан на Рис.5.
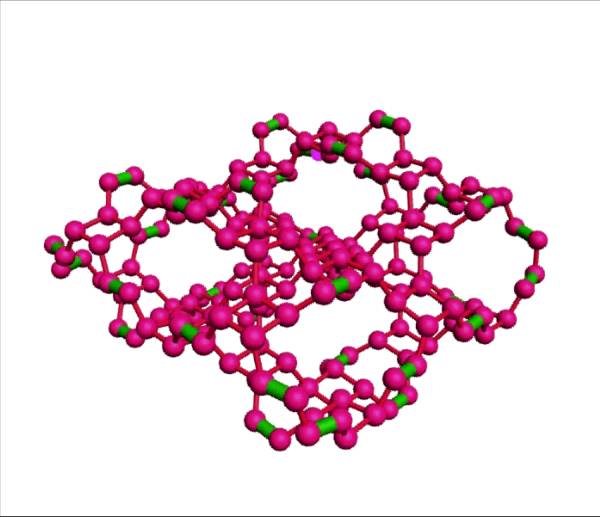
Рис.5. Интерактивное графическое изображение нанообъекта N192
Щелкнуть для просмотра
Для просмотра необходимо загрузить Cortona3D Viewer
Программа написана на языке Maxscript, при ее работе используются компоненты комплекса 3ds Max и Cortona3D Viewer. Задаваемыми параметрами программы являются длины двойных, тройных и одинарных связей, цвет атомов, цвет связей. Использование компонента Cortona3D Viewer позволяет осуществлять интерактивную визуализацию исходных данных, задавая различные значения штатных атрибутов визуализации (положение камеры, цвет фона и т.д.). При помощи этой программы решается задача анализа взаимного расположения атомов в исследуемой наноструктуре.
Анимационная программа визуализации формирования нанообъектов из 2-х фуллеренов С20
В качестве исходных данных в этой программе визуализации используется описание анализируемого динамического процесса объединения 2-х фуллеренов С20 в один кластерных димер С40 в формате TXT – файлов. Анимационная структура содержит последовательный набор TXT файлов, где каждый файл содержит описание координат атомов в определенный момент времени, который указан в названии файла. Описание структуры формата для одного TXT файла представлено на Рис.6.
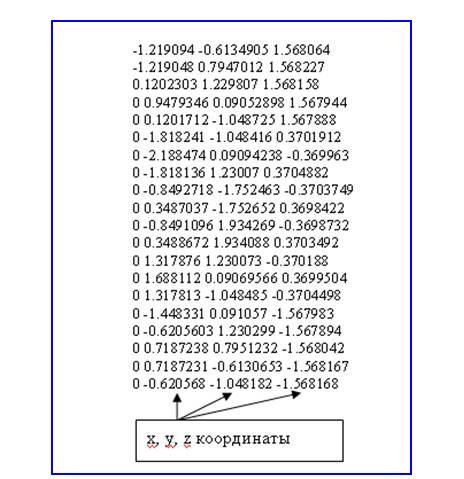
Рис.6. Структура формата TXT файла
Результатом выполнения этой программы является анимационное проекционное графическое изображение процесса объединения 2-х наноструктур. Пример такого изображения показан на Рис.7.
Рис.7. Анимационное графическое изображение процесса объединениия 2-х наноструктур С20
Программа написана на языке Maxscript, при ее работе используются компонент комплекса 3ds Max и его функциональное расширение в виде плагина NLink. Задаваемыми параметрами программы являются штатные атрибуты визуализации, пороговая длина связей (визуализируются только те связи, длина которых не превосходит значение пороговой длины), цвет атомов, цвет связей. При помощи этой программы решается задача анализа исследуемого процесса формирования кластерного димера.
Программа визуализации нанообъектов различных типов
Исходными данными в этой программе визуализации является описание исследуемого нанообъекта того или иного типа, представленного в одном из следующих форматов: XYZ, HIN, OUT, MOL. Формат XYZ был представлен на Рис. 4. Описание структуры форматов HIN, MOL - файлов представлено соответственно на Рис.8, 9. Описание формата используемого в программе фрагмента OUT - файла представлено на Рис. 10.
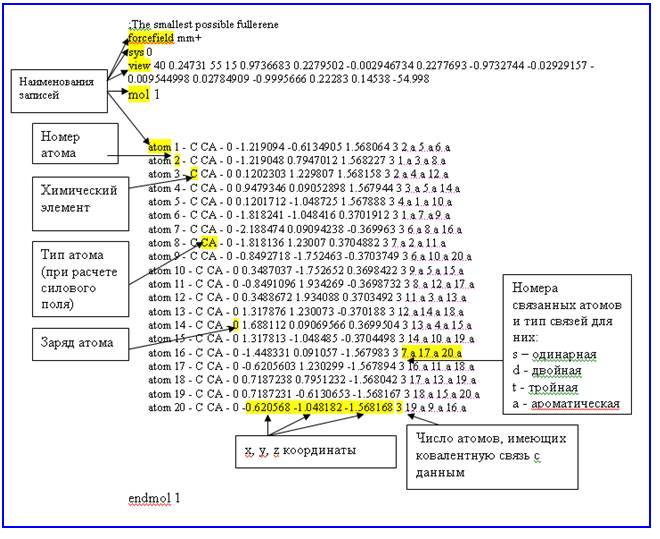
Рис.8. Структура формата HIN-файла
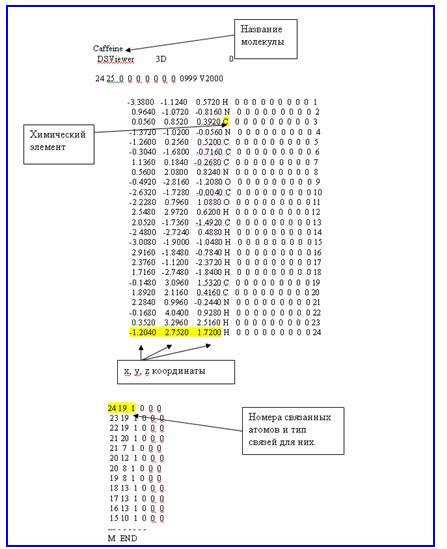
Рис.9. Структура формата MOL-файла
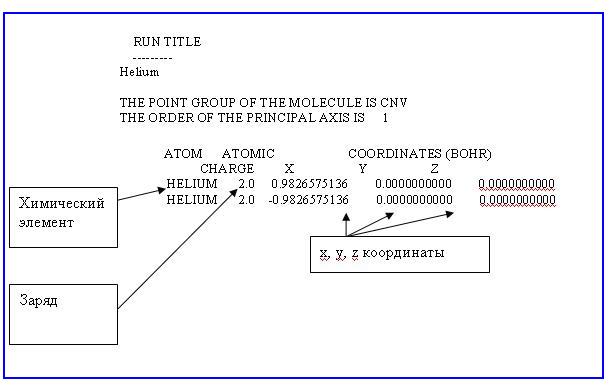
Рис.10. Структура формата используемого в программе фрагмента OUT-файла
Результатом работы этой программы является проекционное графическое изображение визуализируемого нанообъекта. Примеры таких изображений нанообъектов С180 и Витамин С показаны соответственно на Рис.11,12.
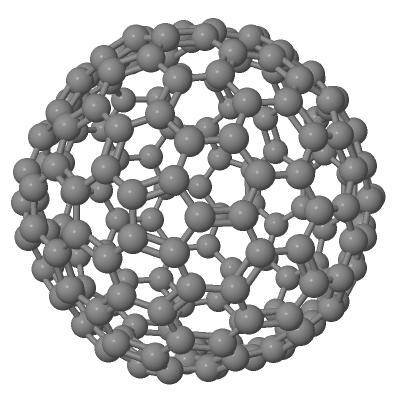
Рис.11. Графическое изображение наноструктуры фуллерен С180
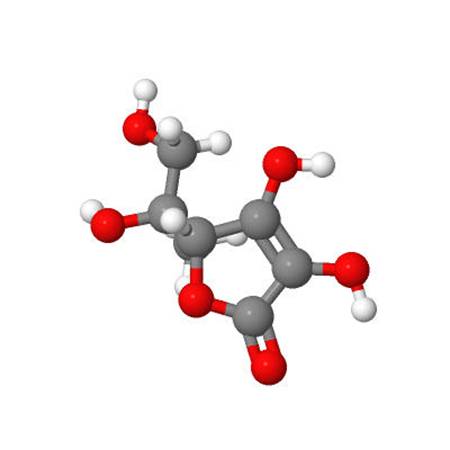
Рис.12. Графическое изображение наноструктуры Витамин С
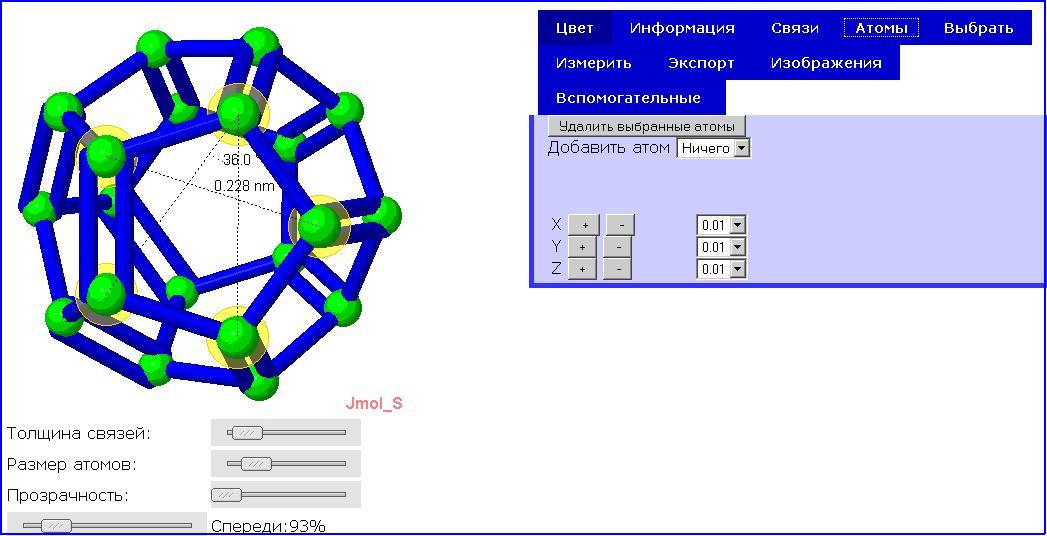
Программа написана на языке Jmol Scripting Language, при ее работе используются компонент комплекса Jmol апплет. Задаваемыми параметрами программы являются длины двойных, тройных и одинарных связей, цвет атомов, цвет связей (Рис.13). Программа может осуществлять измерение расстояний между атомами, углов между связями (Рис.14), строить гистограммы (Рис.15), производить редактирование наноструктуры (Рис.16). Использование компонента Jmol апплета позволяет осуществлять интерактивную визуализацию исходных данных, задавая различные значения штатных атрибутов визуализации – положение камеры, среду и т.д. Различные варианты использования этой программы представлены на Рис.13 – 16. При помощи этой программы решается задача качественного и количественного анализа взаимного расположения атомов в исследуемой наноструктуре.
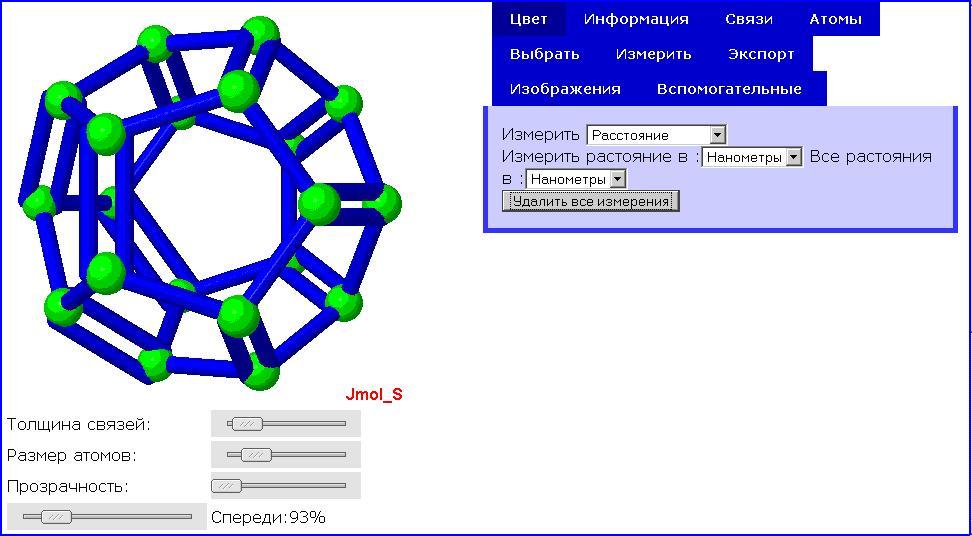
Рис.13. Задание параметров программы
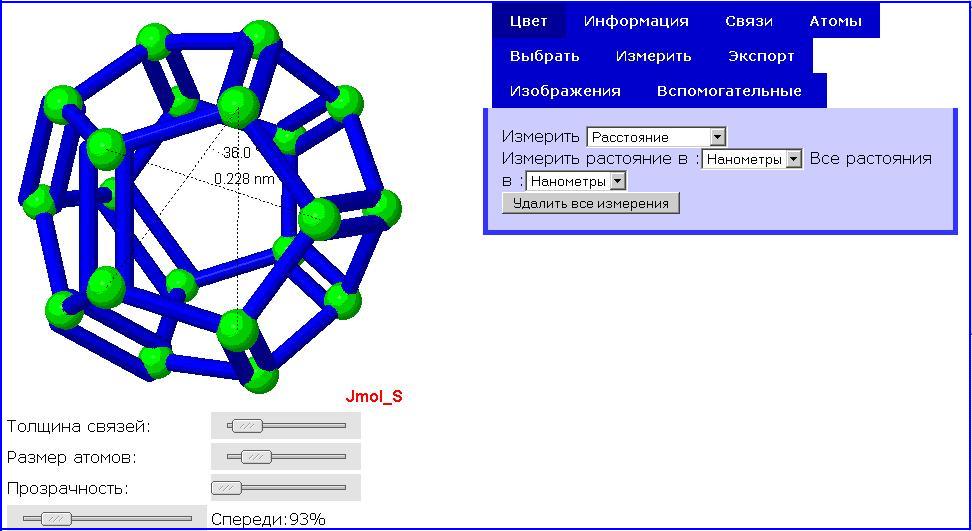
Рис.14. Измерение расcтояний и углов

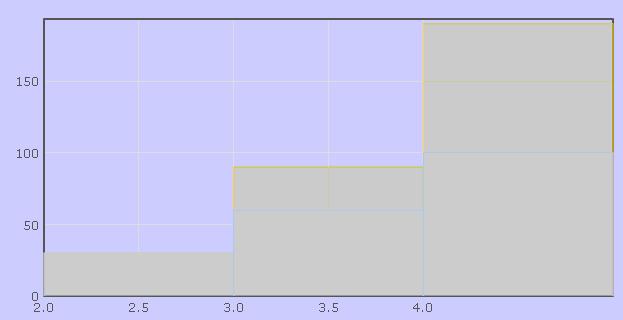
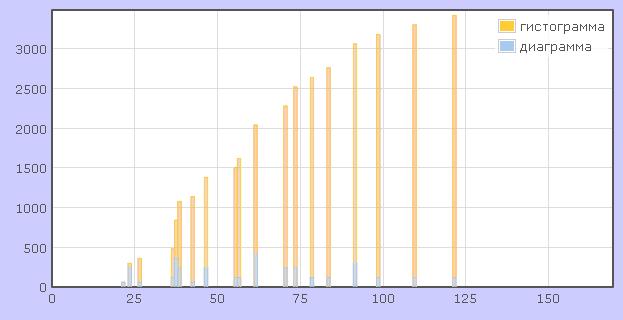
Рис.15.Построение гистограмм
 |
|
 |
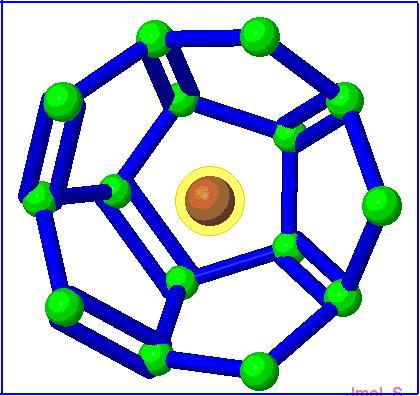 |
Рис.16. Редактирование наноструктуры
Анимационная программа визуализации изоповерхности для параметра порядка трехмерного сверхпроводника 2-го рода
В этой программе визуализации в качестве исходных данных используется описание анализируемого поля параметра порядка сверхпроводника 2-го рода в формате TXT – файла (сверхпроводник моделируется с помощью уравнений Гинзбурга - Ландау). Описание структуры формата представлено на Рис.17.
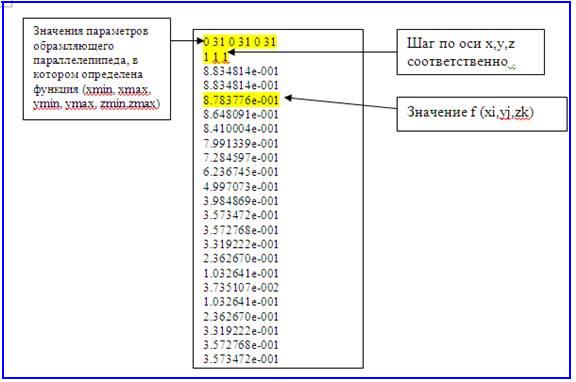
Рис.17. Структура формата TXT- файла
Результатом работы этой программы является анимационное проекционное графическое изображение изоповерхности поля ( поверхность определяет положение и конфигурацию вихрей Абрикосова). Пример такого изображения показан на Рис.18.
Рис.18. Анимационное графическое изображение изоповерхности поля параметра порядка сверхпроводника 2-го рода
Программа написана на языке Maxscript, при ее работе используются компоненты комплекса 3ds Max и его функциональные расширения плагины MDSpace, FromFile, а также компонент HyperFun и его функциональные расширения OpenFile, CloseFile, ReadSupercond. Задаваемыми параметроми программы являются значение поля, штатные атрибуты визуализации. При помощи этой программы решается задача анализа поля исследуемого сверхпроводника.
Анимационнаая программа объемной визуализации электронной плотности нанообъектов Cl2O
В этой программе визуализации в качестве исходных данных используется описание анализируемого поля электронной плотности нанообъекта Cl2O в формате TXT – файла. Описание структуры формата представлено на Рис.19.
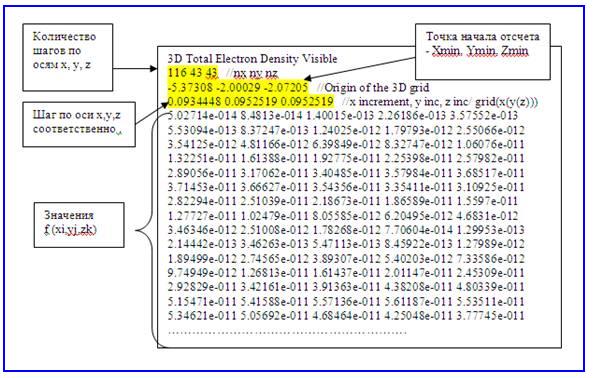
Рис.19. Структура формата TXT - файла
Отметим, что это описание предварительно может быть получено из описания поля электронной плотности данного нанобъекта, представленного в формате OUT – файла с помощью программы MacMolPlt [8].
Результатом работы рассматриваемой программы визуализации является анимационное проекционное графическое изображение совокупности полупрозрачных изоповерхностей поля (объемная визуализация). Пример такого изображения показан на Рис.20.
Рис.20. Анимационное графическое изображение поля электронной плотности нанообъекта CL2O
Программа написана на языке MaxScript, при ее работе используются компоненты комплекса 3ds Max и его функциональные расширения плагины MDSpace, ElectronDens. Задаваемыми параметрами программы являются значение поля, штатные атрибуты визуализации. При помощи этой программы решается задача анализа поля электронной плотности исследуемого нанообъекта.
Необходимо отметить, что исходные данные в рассмотренных прикладных программах визуализации в виде XYZ, HIN, OUT, MOL, TXT - файлов являются результатом работы программ компьютерного моделирования исследуемых наноструктур. Примером таких программ могут служить широко известные HyperChem, Gamess и др.[9,10], а также программы, написанные физиками НИЯУ МИФИ [11] .
Разработанные прикладные программы визуализации наноструктур в настоящее время объединены в библиотеку, доступ к которой осуществляется с помощью программного каталога, располагаемого на локальном компьютере или в сети Интернет. Интерфейс каталога представлен на Рис. 21
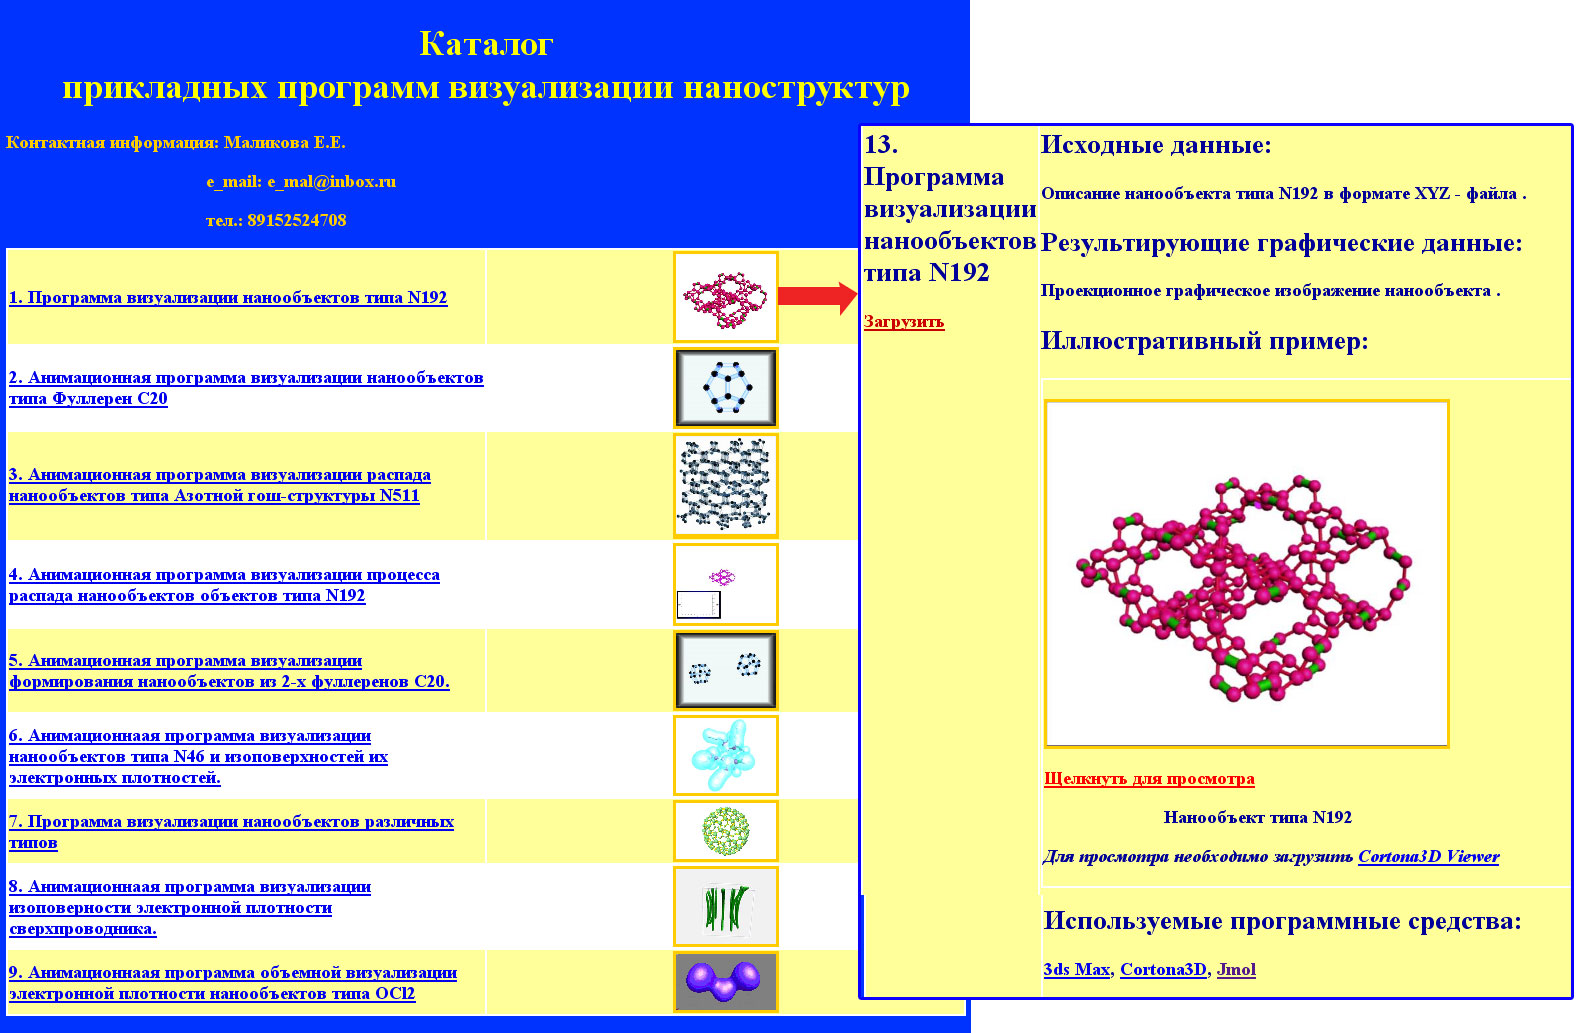
Рис.21 Интерфейс библиотеки прикладных программ визуализации наноструктур
Отметим, что рассмотренные программные средства наряду с научными исследованиями используются также и в учебном процессе НИЯУ МИФИ при обучении студентов-физиков в области научной визуализации.
В дальнейшем планируется расширение как самого комплекса инструментальных программных средств научной визуализации, так и библиотеки прикладных программ визуализации, использующих этот комплекс. В отношении комплекса предполагается функциональное расширение уже существующих его компонентов, а также создание новых.
O. SOURINA, X. HOU
Nanyang Technological University, Singapore
eosourina@ntu.edu.sg
Contents
Haptic-based interfaces are used to enhance study of molecular systems interactions. We developed a visual haptic-enabled system prototype for molecular docking that allows real-time interactive visualization of two molecular systems and molecules manipulation with force feedback. In our system, we implemented haptic interface to facilitate an exploration and analysis of molecular visualization and molecular docking. First, haptic device enables the user “to feel” van der Waals field with a probe. Second, the user could manipulate of two molecules and “feel” their interaction during the docking process in virtual experiment on the computer. In future, such techniques could help the user to understand molecular interactions and to evaluate the design of pharmaceutical drugs.
Keyworlds: haptics interface, molecular visualization, molecular docking, force feedback
Visual haptic-based biomolecular docking systems are used in research on molecular docking. The assembly of molecules in a three-dimensional space or molecular docking is used for rational drug design where a ligand docks onto a receptor. The computer-aided design systems allow a real-time interactive visualization and manipulation of molecules in virtual environment. These techniques help the user to understand molecular interactions. In recent years, besides the visualization techniques, there has been increasing interest in using haptic interfaces to facilitate an exploration and analysis of molecular docking. Haptic device enables the users to manipulate the molecules and feel their interaction during the docking process in virtual experiment on the computer. For life science related disciplines such as biology, physical chemistry, molecular medicine, biophysics, structural biology, bioinformatics, etc., the modern molecular visualization systems allow visualization and analysis of complex biological structures. Haptic-based visual biomolecular docking is a new area of research that allows developing interactive systems that could be used in rational drug design. Biomolecular docking is 3D assembling of molecular structures to predict the preferred complimentary molecular shapes when they are bound to each other to form a stable complex. In this paper, we describe a visual haptic-based biomolecular docking system that we developed for study of molecular structures and molecular systems interaction.
Given the experimental difficulties in membrane protein structure determination, there is a pressing need for prediction methods. Prediction of membrane protein structure consists of two parts: one is topology, the other is helix-helix interaction. Prediction of location of transmembrane (TM) helices and topology has been in general successful. It is often possible to develop a limited set of topological models from the sequence. The total success of membrane protein structure prediction, however, will depend largely on the second challenge, which is to correctly pack topologically arranged helices [1]. In this respect, the fact that the main contribution to transmembrane interhelical packing is van der Waals interactions converts the problem into a docking one [2].
We proposed and developed visual haptic-based molecular docking system to explore the conformational space of helix-helix interaction manually in the hope to find an optimal conformation with the minimum amount of time. Docking the transmembrane helices is a difficult task for automatic conformational search algorithms when polytopic membrane protein structure is explored because of the exponential increase in conformations as the number of a-helices is increased. Given the difficulties in exploring the whole conformational space available in polytopic membrane proteins, our strategy for docking TM helical domains is to use a manual approach in a virtual reality environment. This manual approach greatly simplifies the searching task, as changes in helix register, tilt and rotational orientation of the helices around their long axis are accomplished by hand. Feedback will be provided as attraction or repulsion forces felt by the user, which will be generated after calculating bonding and nonbonding interactions.
The paper is organized as follows. Review on molecular visualization and molecular docking is given in Section II. In Section III, the basic concepts of our approach are elaborated. In Section VI, the system prototype is described and molecular docking examples are shown. Conclusion and future work is given in Section V.
Modern molecular
visualization systems allow visualization and analysis of complex biological
structures. There are popular molecular visualization systems such as RasMol
[3], PyMol [4], JMol [5] that can be used for visualization of 3D molecular
structures, animating molecules, exporting geometry, etc. The systems could be
used both in education and research but they should be downloaded on the PC.
There are web-based molecular visualization
systems that could be accessed on the Web. Currently, the most popular web-based systems are WebMO [6], WebMol[7], FirstGlance [8], etc. The
systems provide visualization, calculating and viewing of the molecular
structures. In such systems, visualization results can be easily shared in the
collaborative environment. Most of the modern visualization systems also allow
visualization of electron density, electrostatic
potential, Connolly and/or van der Waals surfaces and can be integrated with
other visualization and analysis programs.
Currently, there are systems that allow
visualize the molecular docking process and the results as well. In work of Ray
et al. [9], a fast and efficient algorithm was developed that calculates
interaction between molecules and creates an interaction map. The algorithm has
been implemented as a plug-in of Visual Molecular Dynamics (VMD)
software [10]. VMD is a molecular visualization program for analyzing large
biomolecular systems using 3D graphics.
2.2 Haptic-based Molecular
Docking
Visualization of molecular docking process is
important for understanding molecular interaction. Haptic-based technology allows enhance
molecular visualization systems and molecular docking systems with force
feedback in such way that the user could “feel” force field of molecule and
molecular interaction. There are haptic-based systems that enable users to feel
the electrostatic force between a probe molecule and the explored
biomolecule. In [11], Nagata etc. designed a prototype of protein-lingand
docking system allowing the user to 'touch' and sense the electrostatic
potential field surrounding a protein molecule and to search for the
appropriate docking position. In [12], a grid map was used to generate the
electrostatic field data around the molecular structure of interest. The haptic
forces at any position were calculated using tri-linear interpolation of the
potential energy. Lai-Yuen
and Lee [13] developed computer-aided design system for molecular docking and
nanoscale assembly. The authors use their own lab-built 5DOF haptic device. The
paper discusses the docking of ligand to protein. During this docking process,
the force feedback is calculated according to van der Waals forces. Stocks and
Hayward developed a haptic system HaptiMol ISAS [14]. It allows users to
interact with the biomolecular solvent accessible surface through the haptic
device. A navigation cube is used to visualize the explored surface region, and
the cube can be automatically scaled to fit the workspace of haptic device. The
cube approach allows choosing the interaction areas of large molecules. In
another approach for the rigid body molecular docking, proposed by Subasi and
Basdogan [15], the user inserts a rigid ligand molecule into the cavities of a
protein molecule to search for binding cavity. Similarly to the cube approach,
an Active Haptic Workspace (AHW) was implemented for the efficient haptic-based
exploration of large protein-protein docking in high resolution. In the system,
the user could feel a tunneling effect as the ligand molecule is pulled towards
the binding cavity. In [16], an interactive global docking (IGD) approach was
presented. An immersive environment for docking interface with both visual and
haptic rendering was implemented. In the project, the commercial Falcon haptic
device from Novint Technologies Inc. was used to provide 3 degree of freedom
force feedback. In the project of Interactive Molecular Dynamics (IMD) [17], a
real-time feedback and manipulation based on the virtual reality system of SMD
[18], was provided for dynamic simulations of biomolecules.
Project CoRSAIRe [19], is an example of a multisensory virtual reality
system. It was designed for a study of protein-protein docking. To create an
immersive virtual environment, the visual, audio and haptic feedbacks were
combined to enhance the process of exploration. The 6-DoF haptic feedback was
provided by the Virtuous haptic interface of Haption Company and the forces
calculation of both van der Waals interaction and electrostatic potentials were
implemented.
Most of the approaches to molecular docking assume that the molecules are
rigid. For the flexible molecular docking, Daunay and Micaelli, etc. [20]
developed a new six degrees of freedom molecular docking system which enables the feeling of torque force as well. This system provides
haptic feedback for a flexible ligand-protein docking and achieves a stable
manipulation based on wave variables. The system has limitations on the size of
protein molecules. Persson et al. [21] have designed and
evaluated that haptic system that could benefit the biomolecular education. In
a protein-ligand docking, both force and torque feedbacks were provided for the manipulation of flexible
ligand models. The dynamics of ligand is based on a real-time energy
minimization process. In the paper, it was proved by experiments conducted with students that the haptic
feedback has dramatically
improved students understanding the ligands' interactions.
Haptic-enable web-based molecular docking is a new research direction in
molecular docking systems development. In [22], Davies et al developed a
prototype Molecular Visualiser (MV) application based on Web3D standards with
extension for support of the haptic interaction. MV provides the user with
visualizations of molecular systems, potential energy surfaces, and wavepacket
dynamics. These can be displayed in a web browser using VRML, or be delivered
to a virtual environment in which haptic properties are assigned based on the
molecular dynamics of the system. The use of MV for both research and teaching was discussed. The prototype uses PHANTOM
device. The authors mainly focused on the visualization of the molecular models
in the paper but do not study molecular docking problem. Liu and Sourin [23]
proposed a functional approach for modeling the geometry of objects. The function-based objects were
added in VRML. The users are able to define an implicitly defined function of
any shape. Later, Wei et al [24-25] extended [23] by incorporating haptic based
feature to the new FVRML nodes. A new density node was proposed for the haptic
implementation. It allows explore an electrostatic force of molecule with the
probe.
In [26], we described our work on haptic-based visual molecular docking
targeting research on helix-helix docking. In [27], we proposed e-learning scenario
with our system. In this, paper we describe the system interface and further
development of the prototype of biomolecular Docking System HMolDock (Haptic-based Molecular Docking).
3. Approach
The key requirement in simulating of the ligand binding process is to have a good model of the interaction between ligand and receptor. The rough binding region can be decided visually by the user based on complimentary shapes. The surface and sphere models are implemented in the system. During binding, the ligand is moving in the potential field created by the receptor’s atoms, and the system is searching for a stable low potential configuration. While moving one of the molecules around binding site based on complimentary shapes, the potential energy at each position is calculated and compared, the minimum value of potential energy is recorded together with the position of the ligand molecule.
The possible docking orientations between molecular systems are sampled with input from force calculations that is fed back to the user through the haptic device. The molecular systems are visualized with their van der Waals surfaces. The force feedback requires a high refresh rate (at least 1 kHz), therefore interaction energy calculations should be simplified. In future, the interactive forces could be calculated in advance and stored in a volumetric grid.
When only forces in rigid docking are required, we use the Lennard-Jones (L-J) potential as the main scoring function, as it has been found to be the most important in transmemebrane a-helix interaction [2].
The essential features are approximated quite well by a Lennard-Jones potential (also referred to as the L-J potential, 6-12 potential or, less commonly, 12-6 potential), which can be expressed as:
![]() (1)
(1)
where ε is the depth of the potential
well, σ is the (finite) distance at which the inter-particle potential is zero
and r is the distance between two particles. The
![]() term describes
repulsion, and the
term describes
repulsion, and the
![]() term describes
attraction. The LJ potential changes relatively to the distance between
molecules.
term describes
attraction. The LJ potential changes relatively to the distance between
molecules.
The force function is the negative of the gradient of the above potential:
 (2)
(2)
where ε is the depth of the potential well between hetero-atomic particle pairs, σ is the (finite) distance at which the inter-particle potential is zero and r is the distance between one particle in receptor and the other in ligand.
The interactions between two large molecules (assume M atoms in receptor and N atoms in ligand) are represented by the potential energy created between them. The LJ potential and force formulas are shown below:
![]() (4)
(4)
where
![]() and
and
![]() are LJ
parameters for particle i in receptor and j in ligand;
are LJ
parameters for particle i in receptor and j in ligand;
![]() is the distance
between the particle pair;
is the distance
between the particle pair;
![]() is the distance unit vector.
is the distance unit vector.
There are many different force field models that can be used to simulate proteins and other molecules implemented in AMBER [28], CHARMM [29], MM3 [30], MM4 [31] and MMFF94 [32]. If each force field is normally developed for a particular type of molecule, they rather well adapt to different structures in atomic types. The one we use and which is described below is called OPLS-aa [33] [34] [35]. It was parameterized for use in protein simulations, and also for small organic molecules, and has functional groups for all 20 common amino acids.
For the homo-atomic pairs, there are published LJ parameters available (i.e. [36] for OPLS-aa). For the homo-atomic pairs, the interaction of hetero-atomic pairs, the effective values of σ and ε are calculated from those for the homo-atomic pairs. The way of calculation is called a mixing rule. OPLS-aa uses the same non-bonded functional forms as AMBER, and the Lennard-Jones terms between unlike atoms are computed using the mixing rule [37].
![]() (5)
(5)
![]() (6)
(6)
In future, for educational purposes, we would give the user a choice of forces simulating the behavior of molecular systems depending on the case of study.
Molecular visualization is very important for the finding of complementary shapes. The presentation of molecular with smooth surface allows make docking process more intuitive. In molecular docking systems, three types of molecular surfaces are used: van der Waals, Solvent Accessible Surface (SAS), and Connolly surface. In works [26-27], we described our approach and implementation of Solvent Accessible Surface (SAS) and Connolly surface. Here, we illustrate our system with van der Waals surface.
We developed a prototype of biomolecular docking system HMolDock (Haptic-based Molecular Docking), using the haptic device PHANTOM 1.5/6DOF (6 degrees of freedom) [26-27]. The format of molecular structure file from the Protein Data Bank .pdb [38] is chosen as an input, although there are wide varieties of file formats based on standard Cartesian (x, y, z) atom coordinates (e.g., .mpl, .car, .pdb) for which conversion programs could be used. Atom coordinates are got from the input PDB files. Atom radius and the correspondent color are determined based on the atom type and its belonging residue which are extracted from PDB data. Two molecules or one molecule and the probe are visualized on the screen. The user can assign a haptic “mouse” to the probe or to one of the molecules and move the probe/molecule towards/around to another molecule. An interaction force is calculated at each position, and the resulting attraction/repulsion force is felt by the user through the haptic device. The force direction and its magnitude are visualized as a vector. Thus, a probe/molecule can be selected by the haptic mouse and moved around to let the user ‘feel’ change of the force.
Let us describe the system interface. First, the user needs to select the molecules for molecular docking in pdb format. Then, two molecules and the haptic interface point are visualized on the screen. The coordinate grid is shown on the background of screen, and it could be used to improve the accuracy of the docking manipulation in 3D environment. After the molecules are loaded into the environment, the user can assign the haptic interface point to the probe or one of the molecules and move the probe/molecule towards/around to another molecule. Since the van der Waals force between molecules are calculated in real-time, the resulting attraction/repulsion force can be felt by the user through the haptic device simultaneously. The current magnitude value of force is showed on the right side of the screen. The force direction and its magnitude are visualized on the screen as the force vector represented by a red cylinder and a yellow arrow. The force vector is calculated and visualized in real-time. Thus, a molecule can be selected by the haptic “mouse”, and the changing of van der Waals force can be felt by the user when the molecule moves around another one.
Fig. 1. Visualization of Van der Waals force as a vector between the probe and molecule
In Figure 1, it is shown an
application when the molecule force field is studied with the atom probe. Here, the atom is affected by the repulsion
force. By moving the probe around the molecule, the user can study the force
field of the molecule.
After a simple application of our method, we will demonstrate an application in molecular medicine with a more complex example. The example of interaction of aIIb integrin transmembrane helix and a designed antibody-like complementary peptide anti-aIIb is shown in Figures 2-4. It is especially pertinent to molecular medicine, where an important strategy is to achieve function regulation by modulation of protein-protein interactions [39]. In membrane proteins, a recent approach targets the transmembrane region with certain peptides. The rationale is that transmembrane mutations, for example in receptor tyrosine kinases, have been associated to many types of cancer and developmental deficiencies, which are explained by unregulated activation. Inactivation of the receptor is thus crucial for targeted treatment, and this can be achieved with synthetic a-helices that target the native a-helices of the receptor. When the two molecules are far apart, the van der Waals force is very weak. As shown on the right side of Figure 2, the calculated force is small and the user cannot feel the force feedback at this stage. When the two molecules approach each other, first, the van der Waals force is an attraction force that the user can feel through the haptic device. As shown in Figure 3, the direction and the magnitude of the force are visualized as well. Compared with previous stage, the force has apparently increased and the change of force feedback can be felt by the user.
As two molecules get closer, the
repulsion force between molecules can increase if the docking position does not
correspond to minimum energy of the system. In Figure 4, the direction of the
force changes to the opposite. The user
by “feeling” the force could understand that another docking position should be
tried. Here, the length of the arrow increased as the repulsion force
increased. The user could feel a strong repulsion force through haptic device
at this stage.
Fig. 2. Molecules are separated; the force is weak
Fig. 3. An attraction force of interaction is visualized.
Fig. 4. Contact of two molecules is visualized. The repulsion force is shown.
In this paper, we introduced and
described visual haptic-based biomolecular docking system HMolDock to study
molecule interaction with the probe or/and with another molecule. In future,
the system could be used for molecular docking in drug design. We are going to
make further improvements on the visualization techniques and are planning to
develop the docking navigation algorithms to make the docking more efficient
and intuitive to the user. Our system is implemented as a standalone
application that can be used individually on PC. The pdb files of molecules
could be downloaded from Protein Bank website. We have two main directions in
our study. First, we do research and development of molecular docking for drug
design. We proposed a novel approach in helix-helix interaction
research and rational design of peptides. We work on novel approach to search
for helix-helix complementary pairs that will facilitate the search for
membrane helical inhibitor in future. Novel models and algorithms specific to
helix-helix docking will be proposed and developed. For now, drug-receptor or protein-protein interactions
are the preferred subject of study, and specific features of helix-helix
docking are less studied by researchers. Drug
design with our system will be tested. Based on the preliminary study with our
system, we believe that understanding of the reason certain mutations alter transmembrane
interactions and cause disease can be improved with the proposed methods. We are going to do in silico experiments on
biomolecular docking to study helix-helix interactions in rational drug design.
Our second direction is development of visual haptic-based molecular docking system in collaborative virtual environments. As recently, haptics devices became more affordable, it would allow enhance the user experience with force feedback in e-learning systems for biomolecular educations. For now, the implementation of molecular docking in immersive virtual environment has limitations in number of atoms participating in force calculations and visual rendering. Therefore, research on the methods for fast visual and haptic rendering in immersive virtual environments should be carried out as well.
This project is supported by MOE NTU grant RG10/06 “Visual and Force Feedback Simulation in Nanoengineering and Application to Docking of Transmembrane a- Helices”.
[1] J. L. Popot and D. M. Engelman, Membrane protein folding and
oligomerization: The two-stage model, Biochemistry, vol. 29, pp. 4031-4037, 1990.
[2] J. U. Bowie, Helix packing in membrane proteins, Journal of Molecular Biology, vol. 272,
pp. 780-789, 1997.
[3] R. A. Sayle and E. J. Milner-White, RASMOL: Biomolecular graphics
for all, Trends in Biochemical Sciences, vol.
20, pp. 374-376, 1995.
[4] W. L. DeLano, The pymol molecular graphics system, http://www.pymol.org.
[5] JMol: an open-source Java viewer for chemical structures in
3D, http://jmol.sourceforge.net.
[6] WebMO: free World Wide Web-based interface to computational
chemistry packages with features for chemicals, crystals, materials and
biomolecules, http://www.webmo.net.
[7] WebMol: Java PDB Viewer, http://www.cmpharm.ucsf.edu/~walther/webmol.html.
[8] FirstGlance in Jmol; A simple tool for macromolecular
visualization, http://molvis.sdsc.edu/fgij/index.htm.
[9] N. Ray, X. Cavin, J. C. Paul and B. Maigret, Intersurf: Dynamic
interface between proteins, Journal of Molecular
Graphics and Modelling, vol. 23, pp. 347-354, 2005.
[10] W. Humphrey, A. Dalke
and K. Schulten, VMD: Visual molecular dynamics, Journal of Molecular Graphics, vol. 14, pp. 33-38, 1996.
[11] H. Nagata, H.
Mizushima and H. Tanaka, Concept and prototype of protein-ligand docking
simulator with force feedback technology, Bioinformatics, vol. 18, pp. 140-146, 2002.
[12] G. Sankaranarayanan,
S. Weghorst, M. Sanner, A. Gillet and A. Olson, Role of haptics in teaching
structural molecular biology, in Proceedings
of Haptic Interfaces for Virtual Environment and Teleoperator Systems, HAPTICS
2003. 11th Symposium, pp. 363-366, 2003.
[13] S. K. Lai-Yuen and Y.
S. Lee, Interactive computer-aided design for molecular docking and assembly, Computer-Aided Design and Applications, vol.
3, pp. 701-709, 2006.
[14] M. B. Stocks, S.
Hayward and S. D. Laycock, Interacting with the biomolecular solvent accessible
surface via a haptic feedback device, BMC
Structural Biology, vol. 9, art. no. 69, 2009.
[15] E. Subasi and C.
Basdogan, A new haptic interaction and visualization approach for rigid
molecular docking in virtual environments, Teleoperators
and Virtual Environments, vol. 17, pp. 73-90, 2008.
[16] J. Heyd and S.
Birmanns, Immersive structural biology: A new approach to hybrid modeling of
macromolecular assemblies, Virtual
Reality, vol. 13, pp. 245-255, 2009.
[17] J. E. Stone, J.
Gullingsrud and K. Schulten, A system for interactive molecular dynamics
simulation, In Proceedings of the 2001
symposium on Interactive 3D graphics, pp. 191-194, 2001.
[18] J. F. Prins, J.
Hermans and G. Mann, A virtual environment for steered molecular dynamics, Future Generation Computer Systems, vol.
15, pp. 485-495, 1999.
[19] N. Férey, J.
Nelson, C. Martin, L. Picinali, G. Bouyer, A. Tek, P. Bourdot, J. M. Burkhardt,
B. F. G. Katz, M. Ammi, C. Etchebest and L. Autin, Multisensory VR interaction
for protein-docking in the CoRSAIRe project, Virtual Reality, vol. 13, pp. 273-293, 2009.
[20] B. Daunay, A. Micaelli
and S. Régnier, Energy-field reconstruction for haptic-based molecular
docking Using Energy minimization processes, in IEEE International Conference on Intelligent Robots and Systems,
pp. 2704-2709, 2007.
[21] P. B. Persson, M. D.
Cooper, L. A. E. Tibell, S. Ainsworth, A. Ynnerman and B. H. Jonsson, Designing
and evaluating a haptic system for biomolecular education, in Proceedings of IEEE Virtual Reality, pp. 171-178, 2007.
[22] R. A. Davies, N. W.
John, J. N. MacDonald and K. H. Hughes, Visualization of molecular quantum
dynamics - A molecular visualization tool with integrated Web3D and haptics, in Web3D Symposium Proceedings, pp.
143-150, 2005.
[23] Q. Liu and A. Sourin,
"Function-defined shape metamorphoses in visual cyberworlds," Visual Computer, vol. 22, pp. 977-990,
2006.
[24] L. Wei, A. Sourin and
O. Sourina, Function-based haptic interaction in cyberworlds, in Proceedings
of the International Conference on Cyberworlds, CW2007, pp. 225-232, 2007.
[25] L. Wei, A. Sourin and
O. Sourina, Function-based visualization and haptic rendering in shared virtual
spaces, Visual Computer, vol. 24, pp.
871-880, 2008.
[26] O. Sourina, J. Torres
and J. Wang, Visual haptic-based biomolecular docking, in Proceedings of the 2008
International Conference on Cyberworlds, CW 2008, pp. 240-247, 2008.
[27] O. Sourina, J. Torres
and J. Wang, Visual Haptic-based Biomolecular Docking and its Applications in
E-learning, Lecture Notes in Computer
Science, vol. 5660 LNCS, pp. 105-118, 2009.
[28] S. J. Weiner, P. A.
Kollman, D. A. Case, U. C. Singh, C. Ghio, G. Alagona, S. Profeta Jr and P.
Weiner, A new force field for molecular
mechanical simulation of nucleic acids and proteins, Journal
of the American Chemical Society, vol. 106, pp. 765-784, 1984.
[29] B. R. Brooks, R. E.
Bruccoleri, B. D. Olafson, D. J. States, S. Swaminathan and Karplus, CHARMM: A
program for macromolecular energy, minimization, and dynamics calculations, Journal of the American Chemical Society, vol.
4, pp. 187-217, 1983.
[30] J.-H. Lii and N. L.
Allinger, The MM3 force field for amides, polypeptides and proteins, Journal of the American Chemical Society, vol.
12, pp. 186-199, 1991.
[31] N. L. Allinger, Chen,
K., Lii, J-H, An improved force field (MM4) for saturated hydrocarbons, Journal of the American Chemical Society, vol.
17, pp. 642-668, 1996.
[32] T. A. Halgren and R.
B. Nachbar, Merck molecular force field. IV. Conformational energies and
geometries for MMFF94, Journal of
Computational Chemistry, vol. 17, pp. 587-615, 1996.
[33] W. L. Jorgensen, D. S.
Maxwell and J. Tirado-Rives, Development and testing of the OPLS all-atom force
field on conformational energetics and properties of organic liquids, Journal of the American Chemical Society, vol.
118, pp. 11225-11236, 1996.
[34] W. Damm, A. Frontera,
J. Tirado-Rives and W. L. Jorgensen, OPLS all-atom force field for
carbohydrates, Journal of Computational
Chemistry, vol. 18, pp. 1955-1970, 1997.
[35] R. C. Rizzo and W. L.
Jorgensen, OPLS all-atom model for amines: Resolution of the amine hydration
problem, Journal of the American Chemical
Society, vol. 121, pp. 4827-4836, 1999.
[36] OPLS-aa force field
parameter, http://egad.berkeley.edu/EGAD_manual/EGAD/examples/energy_function/ligands/oplsaa.txt, 2007.
[37] M. G. Martin,
Comparison of the AMBER, CHARMM, COMPASS, GROMOS, OPLS, TraPPE and UFF force
fields for prediction of vapor-liquid coexistence curves and liquid densities, Fluid Phase Equilibria, vol. 248, pp.
50-55, 2006.
[38] PDB - Protein Data
Bank, Brookhaven National Laboratory, http://www.rcsb.org/pdb.
[39] H. Yin, J. S. Slusky,
B. W. Berger, R. S. Walters, G. Vilaire, R. I. Litvinov, J. D. Lear, G. A.
Caputo, J. S. Bennett and W. F. DeGrado, Computational design of peptides that
target transmembrane helices, Science, vol.
315, pp. 1817-1822, 2007.