The article discusses the issues of the interactive use of
graph forms of ontological representations of texts in the tasks of information
support by means of documentary information retrieval systems (IRS) of one of
the most complex types of human activity –
scientific research
– the
process of developing new scientific knowledge, as a result of which new facts
are established and the subsequent their generalization.
Traditionally, the problem of information retrieval is formulated
as the problem of forming a sample of documents from a certain collection in
accordance with the information needs, and the main indicators of the
effectiveness of the search process are accuracy, completeness, and efficiency.
However, in reality, a person, as a consumer of information,
does not need a
sample
of relevant documents
and not even their full texts, but a solution to the problem of his main
activity, the
description
of which can be fully or partially contained
in the documents found.
Often not a single document contains a complete description of
the solution in an explicit form, and a person is faced with the task of
forming an image of a solution from fragments of solutions to similar problems
available to him.
In other words, solving
the problem of the main activity requires preliminary formation of the image of
the solution. This situation is especially characteristic of scientific or
engineering problems,
design
tasks, etc.
Considering the use of automated documentary IRS
as an activity that replaces the main human activity,
the task
of synthesizing new knowledge can be presented as the task of forming a
solution image as a result (and by) constructing
a single text from text fragments of the relevant documents. Such a text (in
the form of abstracts, explanatory notes, scientific articles, etc.) represents
an image of solving the problem of the main activity.
Knowledge, as an object of human activity, is quite adequately
represented by ontological means, since such means, according to [1, 2],
reflect not only the immanent and situational connections of the subject area (SbA),
but also the relationship between the concepts and categories of the tool of
knowledge and, in including the language.
In this sense, ontologies can be a “polygon with contour
maps”, where the user implements the trajectory of both informational and
subject search: understanding the expediency of using key concepts is provided
by the visualized contexts of these concepts and the construction of paths
between them – possible meanings.
At the same time, interactive visualization of the semantic
graph of the document ontology allows using the graph as a tool for navigating
through the document material, since makes it possible to operate with
context-specific subgraphs and
transition
from
graph vertices to text fragments.
In the
limit, an ontology graph formed from texts in natural language, can serve as a
tool for constructing a set of images (alternatives and additions), which
together make it possible to solve the user's pragmatic problem.
And the study (analysis and synthesis) of an ontology graph as
a semiotic object (more precisely, a system) containing many interrelated facts
reflecting the meaning of the original text within the framework of the
language and conceptual SbA schemes, allows checking the set of
facts for consistency, as well as finding implicit (not directly reflected in
the source text) facts and connections.
This approach is consistent with the following explication Ch.
S. Peirce of the
cognitive process [3]:
“Effective reasoning is a living process, learning which
breaks down disciplinary barriers. Logic deals not with the forms of thought or
word, but with general scientific principles that turn reasoning into a
self-controlled process, effective for achieving the goal of scientific
research.
Reasoning cannot be reduced to
purely symbolic transformations, but involves observing diagrammatic iconic
representations. This observation leads us to
setting
up an experiment on a graph. Namely, that first we duplicate some parts of the
graph, then we erase some of its parts, i.e. hide some part of the statement from
observation. We observe the result of this experiment – this is our deductive
conclusion.
And this approach – interactive visualization and
transformation of semantic graphs as ontological images of documentary
information – makes it possible to practically implement the long-formulated
requirement: “... the documentary IRS should be organized in such a way that a
person could, as it were, explore the search array, changing the wording of the
search prescription depending on intermediate search results” [4].
As can be seen, the ideas were formulated a long time ago
(especially regarding the pace of development of the IT sector), but their
implementation required not only an increase in capacity, IT capacity and the
use of effective visualization tools, but also the identification of
fundamental provisions connecting the concepts of such methodologically not so
close areas as informatics, linguistics, activity, psychology.
In the article in the context of the main provisions of the information
retrieval will be
discussed:
—
models, tools and technologies for constructing
semantic search images based on full texts of documents, providing the
possibility of formal analysis and synthesis of graph structures that
correspond to cognitive situations;
—
models and tools of variant visualization, providing
the possibility of reducing the
graph’s
size to an operable level and presentation in accordance with the chosen
cognitive metaphor;
—
cognitive-like search tools on full texts, which
provide controlled manipulation of graph components and corresponding text fragments
due to the operations of semantic scaling and construction of aspect
projections.
The models and tools
for variant visualization of the ontology graph presented in the article are based
on the basic principles of constructing visual models [5-7]:
—
the principle of correspondence to the task solved
by the user, which, in particular, corresponds to the provisions of the
correspondence of the graphic image of the semantics of the visualized data to
the individual characteristics of perception;
—
the principle of ensuring the dynamism of the
display;
—
the principle of minimizing the time spent on data
analysis, including through the choice of optimal algorithms;
—
the principle of integrity (consistency) of
presentation;
—
the principle of independence of levels – physical,
logical and presentation.
1. The
concept of information retrieval is always, in one way or another, associated
with a process that has an uncertainty of the outcome, and, if it is a
controlled search process, with a choice, which, in turn, is built on the basis
of comparing data obtained from outside with available knowledge. Uncertainty
(incompleteness and inaccuracy) of the choice is due to successive
transformations (understanding – expression – formalization) in the
chains
“knowledge – information – document – search image of a document”
and
“problem situation – task – question – search image of a query”
linked by means of the IRS, each of which brings its own uncertainty.
2. Due to the principles of organizing the computing
environment, the search at the physical level is reduced to an operation (or
their sequence for a composite query) of full or partial comparison of a given
term (more precisely, a substring) with terms (indexes) of a database.
That is, it is necessary to understand (and take for granted)
that the retrieval mechanism of the IRS do not have the means of thinking out,
guessing or interpreting the specified term.
Note that such tools, and in particular, query
expansion technologies (using thesauri, linguistic processors, statistical
links, etc.) belong to the level of logic, since they are defined and depend on
the characteristics of the conceptual-sign SbA system.
But
the main thing is that their use in automatic mode in practice rather worsens
the integral indicators of search efficiency. Somewhat higher efficiency can be
achieved in the interactive mode of using lexicographic reference for subject-oriented
vocabulary selection. But again, this will be a choice from a stable and
predetermined set, and probably not containing new or alternative vocabulary.
3. The general
basis of information documentary retrieval is coordinate indexing - a way of expressing
the main semantic content of a document or query in the form of a set of
keywords (terms), and it is initially assumed that the keywords are not related
to each other, but a separate term and document corresponds point in the
n-dimensional
semantic space, which, in fact, fully corresponds to the binary form of
information representation in the computing environment.
4. In the aggregate human-machine information system
“source
of information – IRS – consumer of information”
IRS essentially (as a result
– physically) plays the role of a switch.
The
source (document) will be transferred to the consumer if his search image meets
the criterion of formal relevance used by this system. But both the search
image of the document and the search image of the query are descriptive
expressions – images of knowledge (implemented
and
sought), built using a language that allows the conclusion of a comparison
result by calculating the value of a certain measure of proximity and
correlating it with a threshold value. The most common and appropriate language
is the information retrieval language (IRL) of a
descriptor-type,
whose vocabulary is represented by a set of terms, and the
grammar reflects the method of constructing a search image by coordination
(interconnection) of terms [4].
At this case, in general case, terms can be both the entity
names and the relationship names, and coordination can be implemented in a
positional (word combinations, phrases) or key (using relators – linking
operators or relationships) method.
Accordingly, coordination can have a different depth of
meaning expression:
—
terms combinatorially
set the characteristic properties of the described object (obligatory/optional,
interchangeability, associativity, etc.), which corresponds well to Boolean
algebra, when the meaning is determined by a predicate in the form of a logical
formula on a set of terms;
—
the terms of
the search image are presented “in the context”, which allows concretizing the
meaning;
—
the terms of the search image are presented “in
sequence”, allowing to present (form an image) the meaning and the course of
solving a practical problem.
5. In general, the search process is built according to a
simple “request-response” scheme and includes three main technological operations:
the formation of a request by the user, the formation of the issue by the
system, and the assessment of the relevance of the issue by the user.
However,
the following features need to be taken into account.
First,
the search process will be iterative and not one-act. Second, when adapting a
query expression, the objects of three spaces must be semantically linked:
mental, operational/interface, machine. In this case, it will be the formation
of a query expression that will be decisive, which essentially boils down to
the choice of terms and possibly their connection. Such a choice is made by the
user, referring either to his own consciousness
(knowledge
of the vocabulary SbA),
or, if the system is interactive, choosing from
technological objects generated by the system.
Such
technological objects can be linear ordered structures (database dictionaries,
vocabularies, etc.) or more complex semantic structures (thesauri, semantic
networks, cognitive maps, etc.).
It is
obvious that navigation through such complex and voluminous structures will be
no less difficult than the content of the documents themselves.
Therefore, for the effective use of such structures, it is
necessary to have a means of ordering them, subject-specific articulation, as
well as navigation and display control.
6. Search interaction of a person with a machine has its
own features. The user identifies and recognizes objects of the practical
problem being solved in a certain context.
Identifies consists in identifying found objects
with available knowledge “in general”, and recognition in identifying
individual “useful” properties.
In the
case when a certain practical problem is being solved, the displayed semantic
network should be directed (from the initial positions to the “answer”) and
represent ideally an algorithm for this solution.
In
the case of the information and analytical tasks (preliminary research, search
for hypotheses or possible solutions), the composition of the elements,
structure (blockiness, interconnection), content (nature of entities and
relationships), form (ordering and type of presentation)
is usually analyzed.
In addition, physically (spatially) the process of sequential
perception/understanding (selection of an element, its identification and binding)
is realized using some (familiar or special) scheme.
For
example, “left-to-right” in the case of continuation, expansion of the area: “
top - down” or “deep” in case of
clarification
or detail.
According to [8], a fact in the philosophy of science is a
special kind of sentence, fixing empirical knowledge, statement or condition
that can be verified, and the meaning of a fact is beyond of the fact itself
and determines its place in some integrity.
On the basis of this definition, the following types of
information components can be distinguished:
—
elementary fact
is an image
that records a certain state of a separate interaction of a pair of entities,
where
the
essence is a concept, object, subject, etc., serve as an entity and the communication
is represented by relationship (attitude);
—
situational fact
is an
elementary fact in which both entities (or one of them) are additionally
determined by the circumstances of the entity's participation in the interaction
– a specific situation; thus, a new named entity is formed, including a set of
elementary facts;
—
completed fact
(statement, assertion, description) is a network of elementary and/or
situational facts, forming an integrity, correlated with the information
request, and thus forming a meaning.
A fact can be fixed and exist in different forms, including in
the form of text, as a set of signs of a certain language, in particular,
natural.
Just like a meaningful text, an ontology graph built for this
text can be considered as a set of facts, together expressing some meaning.
In this case, an elementary fact in the ontology graph
corresponds to a triplet “entity – relationship – entity”, and a situational fact corresponds to a triplet, in which one or
both entities are represented by a set of elementary triplets that make up the
semantic neighborhood of an atomic entity.
Such
a meta-entity reflects a certain situation; it can be named and supplied with
characteristic attributes.
The
relationship within the framework of a situational fact will have the character
of a meta-attitude, since connects not atomic entities, but entire situations.
The completed fact is represented in the ontology graph by a certain integral
construction of triplets, on the one hand, reconstructing the intentions of the
creator of the source text, and on the other hand, corresponding to the context
of the main activity problem
being
solved by the user.
The ontological approach allows the semantics of a
separate solution described in the document to be represented by a system of
concepts and relations, i.e. when searching, it will be possible to use
completed semantic constructions.
In this case, the ontology graph will represent the technological
space of “entry points” into the information array, providing the possibility
of a direct transition from the graph vertices to the document text fragments.
In [1] ontology, as a semiotically integral
formation, is defined from the standpoint of general systems theory as a set of
three interconnected systems
O =<Sf, Sc, St
≡>,
where
Sf
is the functional system
(objects and relationships of reality), which is defined as
Sf
=<Mf,
Af, Rf, Zf>,
where
Mf
is a set of objects (entities), Af
is a set
of characteristic properties, and
Rf
is a set of functional relationships represented
by typed situational connections of an SbA,
Zf
is the composition law, i.e. the rules and schemes for
ordering objects (for example, the SbA
meronomy).
Sc
is the
conceptual system defined as
Sc
=<Mc,
Ac, Rc, Zc>,
where
Mc
is a set of SbA concepts,
Ac
is a set of signs of systematization of the concepts (the SbA
taxonomy),
Rc
is a set of relationships (primarily paradigmatic),
Zc
is the composition law (representation scheme);
St
is the
terminological system defined as
St
=<Mt,
At, Rt, Zt>,
where
Mt
is a set of terms,
At
is a set of properties,
Rt
is a set of equivalence and inclusion relationships, as well
as linguistic relationships,
Zt
is
the composition law (grammar);
≡
is the
operation for comparing the elements of different systems at the level of
signs, ensuring their identity in the functional, conceptual and terminological
systems.
The
representation
of an ontology at the structural level in the form of graphs allows formalizing
operations on ontologies based on graph-theoretic axioms. The main operations
in this case are: binary – unions, intersections, projections
and unary – scaling of ontologies [1, 9].
As a data model of the ontology functional system , a labeled
(for whose vertices and arcs the properties
Af
are defined) oriented
graph
G
(V, E) = <V, E>
is used, where
V
is the set of vertices, and
E
is
the set of arcs. The set of vertices and the set of arcs together correspond to
a set of elementary facts. Because the same pair of atomic entities can
participate in several elementary facts, in the graph
G(V, E)
for two
vertices there can be more than one arc, that is,
G
(V,
E)
has the multigraph property.
According to [10], on the sets
V
and
E
are defined (can be
dynamically constructed):
1. A metagraph formally defined as
MG = <V, MV, E, ME>, where
V
is a set of vertices,
MV
is a set of meta-vertices,
E
is a set of arcs,
ME
is a set of meta-arcs.
Each meta-vertex corresponds to the meta-entity of the
situational fact and is a graph
mvi
= <Vi, Ei>,
where
 ,
and the meta-arc corresponds to the meta-relationship. The metagraph also has
the multigraph property, since situational facts may,
for
example, differ only in meta-relationships.
,
and the meta-arc corresponds to the meta-relationship. The metagraph also has
the multigraph property, since situational facts may,
for
example, differ only in meta-relationships.
For graph forms reflecting the semantics of texts (and
cognition), the presence of meta-vertices is quite constructive and natural.
The meta-vertex corresponds (by its name) to an entity (concept, node,
composition, etc.) and acts as an atomic semantic equivalent of the meaning
determined by a non-atomic construction (expression).
2. A hypergraph, when a set of hyperedges
W
is
formed on the set of vertices
 ,
while the rules for specifying a hyperedge
are
based on the sets
Af
and
Zf:
,
while the rules for specifying a hyperedge
are
based on the sets
Af
and
Zf:

The presence in the functional system of an ontology, in
addition to the sets of entities and functional relationships, a set of
characteristic
properties and the law of composition, makes it possible to group entities not
only in dynamics, for example, according to the principle of correspondence of
the synthesized chain of facts, but also in statics – for example, according to
the principle of possessing a common property, according to lexicographic
inclusion, etc.
Aspect representation, as one of the forms of a completed
fact, representing a certain semantic slice of an SbA,
within the framework of a functional ontology
system is implemented in the form of a subgraph. The construction of the aspect
representation is based on the projection operation, which in [1] is reduced to
the operation of intersection of the original
 and aspect
 ontologies:
 .
Thus, for each aspect representation, its own aspect ontology must be specified
(at the level of the functional system).
.
Thus, for each aspect representation, its own aspect ontology must be specified
(at the level of the functional system).
In general, the taxonomy of aspects is used, which (being an
object open to extension and modification) specifies a set of possible aspects
associated with the relationship classes specific to this point of view.
A set of aspects
is determined in accordance with the activity model and is set on the taxonomy
of functional relationships, whose
relationship
classes
are associated with linguistic constructions in the text [10],
supplemented by a variety of structural and linguistic
relationships.
The latter make it possible to take into account the connections of language
(synonymy, paradigmatics), as well as the “constructional” connections
characteristic of the setting of properties (name, dimension, parameter value).
Thus, specifying an aspect within a taxonomy is reduced to the
formation of a functional system
 with
a non-empty set
with
a non-empty set
 and,
possibly, non-empty sets
and,
possibly, non-empty sets
 and/or

In more detail, an aspect can be specified by its
characteristic set of basic concepts
(entity
names), i.e.
 .
In this case, only the names of the specified entities will participate in the
projection formation.
.
In this case, only the names of the specified entities will participate in the
projection formation.
Indexing technologies are the basis for
information retrieval. Traditionally (and quite justifiably), the names of concepts
(or objects, properties, etc.) extracted from the text are used as search
indexes. Such indexes are focused on the use of descriptor-type IRLs, which
consider linear
search images of documents as operational
objects. The semantic power of such languages is limited by the presence of
synonymy, polysemy and homonymy in natural language and the lack of means of
expressing situational and immanent relationships between real objects,
processes, etc., presented at the verbal level in the text.
A semantic classification of the IRL was proposed,
as early as [11], on the basis of two classification levels:
paradigmatic and syntagmatic. At the paradigmatic level, the classification presents
classes of languages without means to express the immanent relationships;
languages in which there are means of expressing part of the immanent relationships,
and languages with all the immanent relationships of the considered SbA. At the syntagmatic level,
language
classes lacking means of expressing situational relationships; languages that have
the means to express
situational
relationships, but no means to distinguish them,
and languages in which situational relationships are expressed
and different.
The formation of an ontology as a search image of a network
organization requires:
1.
Define a conceptual system of ontology with a set
of paradigmatic relationships.
2.
Present the text of the document as a set of
elementary facts. At this stage, in addition to entity names, situational
relationships are formed, which can be typed according to the taxonomy proposed
in [10]. The analysis of entity names allows to form additional
structural-linguistic relationships based on the recognition of abbreviations,
units of measure, division of long sequences according to the rules of natural
language, etc., and also define the entity (concepts) names that are entry
points into the conceptual system of ontology.
Expression of entity names and relationships names at the sign
level allows to index an elementary fact as a triplet – a sequence of signs in
which not only names, but also entity types and relationships
are presented. Thus, both traditional indexes (by keywords)
and indexes representing semantic
relationships can be built. The presence of such indexes allows, within the
traditional Set Theory model of information retrieval (and by means of the
traditional descriptor IRL), to implement the selection of documents taking
into account the immanent and situational relationships between entities. In
this case, the IRL falls into the semantic classification in the class of
languages that have means of expression (and distinction) of both immanent and
situational relationships.
The construction of the semantic image of the document as a
set of elementary facts that
form
nodes and arcs of the ontology graph is based on a classical semantic text
analysis scheme,
which includes the stages
of graphematic, morphological, semantic-syntactic and
conceptual
analysis [12].
At the stage of graphematic analysis, the
structural elements of the text (sections, chapters, paragraphs, headings) are
traditionally distinguished, the text is split into tokens,
which
are identified and (if necessary) combined using dictionaries and linguistic
rules. Named groups, dates, floating point numbers, abbreviations, units of
measurement are identified. The boundaries of sentences are determined by
punctuation marks, taking into account the identified specific character
sequences.
The task of the morphological analysis stage is to determine
the main morphological characteristics (part of speech, gender, number, case)
of tokens identified as words.
The stage of semantic-syntactic analysis begins with the
removal of morphological
ambiguity generated at the
stage of morphological analysis. The choice of a single word paradigm
is
based on the analysis of the contextual environment and the application of the
rules of the Russian language.
At the stage of semantic-syntactic analysis, the formation of
elementary facts is carried out on the basis of lexical-syntactic templates.
The algorithm for forming of elementary facts is based on the presentation of a
separate sentence in the form of a linear sequence of segments, each of which
is identified as “the name of the subject / object” or “connection (part of the
connection)”.
For
example, the sentence
“The lower spacer brackets rest are
supported by roller bearings installed on the slab”
would be
divided as follows:
(The lower spacer brackets) <subject / object name>|
(rest) <connection (part of the connection)>|
(on) <connection (part of the connection)>|
(roller bearings) <subject/object name>|
(installed) <connection (part of the connection)>|
(on) <connection (part of the connection)>|
(the slab) <subject/object name>
The template description language allows for the triplet
<subject (S)> <relationship (L)> <object (O)> to specify
sequences of sentence fragments that must define (or are part of) each of the
parts of the triplet. Many templates can be formed depending on the type of
processed texts. For the given example, triplets will be built:
<Bracket lower spacer (S)><
roller support
(O)>
<install(L1)>
<overlap (O)>
Thus, the linear text is transformed into a set of
triplets that form the nodes and arcs of the graph of the functional system of
the ontology.
At the stage of conceptual analysis, the following tasks are solved:
1.
Classification of formed links (relationships) in
accordance with the taxonomy of relationships [13] and identification of modal
properties of relationships using morphological characteristics and signal
words. The modalities can
have the
following meanings:
Accurate (Relevant)/Prospective (possible)/Impossible
and
Fulfilled/Completed/Expected.
2.
Identification of the names of subjects/objects
(or parts of names) that are part of the conceptual system of ontology. For
such concepts, independent nodes and arcs are formed. The nodes further serve
as inputs to the graph of the conceptual system, and the arcs represent the
corresponding structural and linguistic relationships.
3.
Identification of parts of the names of
subjects/objects that are abbreviations, noun phrases, and the formation of
additional nodes and arcs corresponding to structural-linguistic relationships.
4.
Identification of the names of subjects/objects
(parts of names), which are units of measurement. Additional nodes are created for
units of measure and for property names, which are defined according to the
taxonomy of properties and units [14]. The property name and corresponding unit
of measure are connected by an arc.
5.
Formation of arcs of structural and linguistic
relationships according to the principle of lexicographic inclusion between the
names of subjects/objects.
6.
Identification of the subjects/objects names
containing the name of more than one entity. Such names are divided into two or
more in accordance with the rules for the formation of phrases, additional
nodes are created (for example, for the name
“The
lower spacer
bracket”,
two additional nodes will be formed –
“bracket”
and
“lower spacer”),
which
are connected to the original nodes by arcs corresponding to structural-linguistic
relationships.
7.
Calculation of the frequency characteristics of
the names of subjects/objects. Calculation of the weight of nodes based on the
frequency of occurrence, role and belonging to significant text fragments.
As a result of the sequential execution of the stages, a
complete graph of the functional ontology system is formed, which serves as the
basis for the semantic image of the document.
The problem of visualizing the ontology graph is due to the
fact that: on the one hand, an elementary fact must have a visual image that
makes it possible to distinguish separate entities and relationships, and on
the other hand, the visual image of a situational or completed fact must be
available for perception in its entirety and fit into the screen space. The
ontology of a document full text is usually characterized by large
cardinalities of elements sets (it can be thousands of entities and
relationships even for a small text), which predetermines the need to create
and use tools for selecting and visualizing fragments of the ontology graph.
Moreover, such tools should be adequate to the type of problem being solved.
A visualization process any data is aimed at presenting them
in a perceived and convenient for visual observation and analysis form. The
effectiveness of visualization methods is largely ensured by the meaningful use
of the principles of information perception, an adequate choice of the metaphor
and the visualization model and compliance with the visualization criteria.
In this article, the visualization metaphor is understood as
the mapping of a set of objects in the data space of the original problem to a
set of objects in the representation space by transferring the attributes of
objects of the first set to objects of the second in an intuitive way [7, 15].
Some examples of visualization metaphors are discussed
in detail in [7, 15, 16 and 17], in particular, such as the metaphor of the desktop,
rooms, buildings, molecules.
For objects represented by a
graph, the color and sizes of graph elements are often used to create visual
markers that allow the user's attention to be focused.
For
example, for cognitive maps [16] an arc color corresponds to the relationship
type, the thickness corresponds to its intensity and the vertex color and size
depends on the vertex type or it’s belonging to a semantic group.
In the context of the tasks of documentary information
retrieval from the point of view of mapping the ontology graph to the situation
diagram of the user's cognitive state, two metaphors have been identified: a
path search metaphor and a neighborhood analysis metaphor.
The criteria for graph visualization are [18, 19]:
—
distinguishability of individual elements of the graph (vertices,
arcs, marks);
—
convenient laying of vertices on a plane in terms of visual
perception;
—
acceptable waiting time and, as a consequence, an acceptable
(close to linear) computational complexity of
vertex layout algorithms;
—
the
preservation of the mental map of
the graph, which sets the requirement for the similarity of styling in the event
of a slight change in the graph.
The criteria are influenced by visualization rules, often referred
to as aesthetic criteria [16, 18 and 20]:
—
minimizing the size of the area occupied;
—
uniformity of the vertex distribution on the
plane;
—
minimization of arc crossings (approximation to
planar map);
—
minimization of the total length of all arcs;
—
minimizing the number of arcs bends
—
directionality of arcs (“top-down” and
“left-right”);
—
compliance with symmetry.
However,
it is usually impossible to satisfy all the rules. First, because of
conflicting rules (for example, minimizing the number of arcs bends can violate
the uniformity of the vertices distribution on the plane and lead to an increase
in the size of the occupied area) [20]. Second,
because of the increasing computational complexity of the
algorithms.
In this article, elements of the ontology (elements of the
sets of each of the three systems) are associated with the elements of the
graph – marked vertices and arcs of different types that characterize the
origin of the element.
The vertex
of the graph is represented by a rectangle and marked with the name of the
entity – concept, object name, unit of measure, etc.
The
vertex size (label font size) is calculated based on the weight of the
corresponding name in the text.
The
vertex color is set depending on the vertex type or the role of the name.
The graph
arc is represented
by a curved line,
which allows the arc label and the incident vertices labels to be placed on
different horizontals, which in the case of long label names allows reducing
the number of their intersections and avoiding a high concentration of
intersections.
Drawing a curved line requires
more computational resources (and therefore more time-consuming) than drawing
a straight line, but the resulting graph image makes it easier to distinguish
between its separate elements. The graph arcs are labeled in different ways,
including the relationship name or the relationship class name, depending on
the arc type and visualization parameters.
The visualization technology of an ontology graph built for a
natural language text includes the following stages:
—
graph elements selection in accordance with the
user's task;
—
formation of presentation in accordance with the
visualization metaphor;
—
image formation in accordance with the visualization
model.
At the stage of selecting graph elements, filters are used that
are set automatically (in the case, for example, of forming an aspect
projection) or manually.
All
filters are divided into three groups:
filters of the vertices set, filters of the arcs set, and filters related to the graph as a whole.
Filters of the vertices set assume the selection of vertices by entity name,
vertex type,
location in the source text, term role,
weight.
After
applying the vertex filters, the graph will contain the vertices that satisfy
the filter conditions and the arcs incident to such vertices. Filters of the arcs set
assume the selection of arcs by relationship name, class, modality, location in the
source text.
After applying the arcs filters,
the graph will contain arcs that satisfy the filter conditions and the vertices
incident to them.
Filters related to the
graph as a whole allow specifying additional conditions for selecting vertices
and arcs. For example, leave in the graph the vertices that do not satisfy the
vertex filter, but are included with those
vertices
in one connected component.
The visualization metaphor provides the mapping of the ontology
graph to cognitive state situation diagram and the user's goal (finding a
solution to a practical problem or analyzing a problem situation).
The visualization model (data presentation) is specified by a
set of rules for the formation of visual objects and their graphic attributes,
such as color, shape, size, and must provide a variant geometry of the
generated set of arcs and vertices. In accordance with the visualization model,
the graph of the vertices are laid on a plane
i.e.
calculation of their coordinates in space.
Thus, the visualization technology provides the construction
of a dynamic graphical form that provides the user with the following
interactive interaction possibilities:
—
viewing the properties of vertices and arcs;
—
moving vertices on a plane;
—
changing, deleting and creating new vertices and
arcs;
—
approximation and scrolling of the graph, allowing
to interact with separate fragments of the graph with varying degrees of
detail;
—
search for vertices and move focus to the found
vertices;
—
transition from the vertices to the corresponding
text fragments;
—
building a path between two vertices, if such a
path exists;
—
building a neighborhood of the vertex;
—
building of aspect projections of the graph;
—
selection of graph elements in accordance with
filters;
—
union and intersection of graphs.
The stages of the technology correspond to the traditional
approach to data visualization, which involves
performing
the following stages: setting the source data, filtering, mapping and rendering
– which are collectively called the visualization pipeline [22]. The
correspondence is shown in Fig. 1.
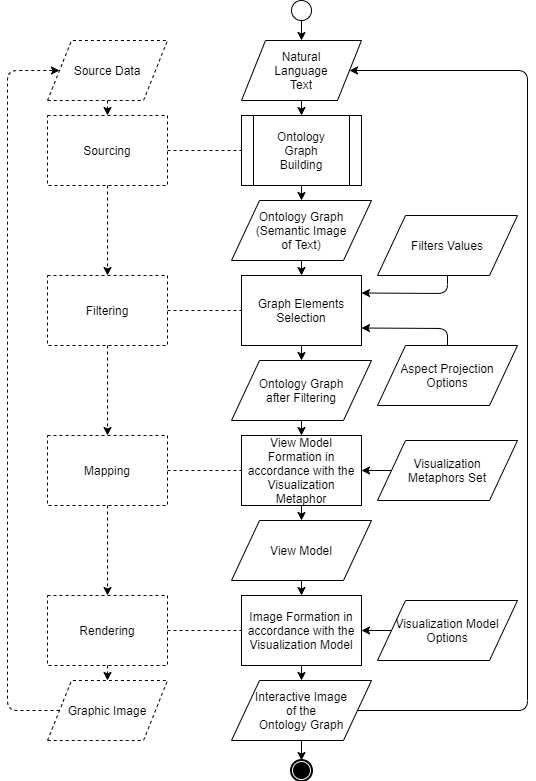
Figure 1 – Ontology graph
visualization technology in accordance with the stages of the visualization
pipeline [22]
In this article, the visualization model of the ontology graph
corresponds to the method of drawing a separate element of the ontology and algorithm
for layout a set of elements on a plane.
The typology of algorithms for layout the vertices of a
graph on a plane is given in [23] and includes the following:
—
algorithms using graph theory and graph
algorithms;
—
algorithms using force models (for example, spring),
thermodynamics models (simulated annealing), bioinformatics model (genetic
algorithm) and other simulations;
—
heuristic algorithms;
—
combinations of the above algorithms.
In general, the use of different display options
when solving a user problem allows looking at its possible solutions from
different angles, in different aspects, which provides complementarity of
approaches and allows increasing the perception and depth of understanding of
the problem.
For an ontology graph, it is proposed to use the following
algorithms for layout vertices on a plane:
—
layout vertices using the Barnes-Hut force method;
—
layout vertices in the order of use (appearance)
of entity names in the text;
—
layout vertices in accordance with the
significance of the paths (long path or the total weight of the vertices);
—
layout vertices in accordance with some scheme
(for example, functional model IDEF0).
Force algorithms are based on physical analogies, however, in
practice, force algorithms are unacceptable in terms of the construction time
for layout large graphs [24], and therefore, their different modifications
are often used.
For example, the Barnes-Hut method known in astrophysics,
formulated in terms of solving the gravitational n-body problem, allows
accelerating graph layout by approximating repulsive forces.
The following models of ontology visualization are considered in
this article:
—
visualization model of the shortest path between
two entities, providing a representation of a chain of elementary facts;
—
path visualization model based on layout with
ordering by significance, where the path length or the total weight of vertices
is used as the significance;
—
entity neighborhood visualization model based on
the Barnes-Hut force-based vertex layout.
Let us consider in more detail the model of path
visualization with order
in importance. The following algorithm has been developed for layout
vertices:
1.
Search for a set of paths between all the vertices
of the graph (for example, using the Floyd‑Warshall algorithm), the
length or total weight of the vertices of which exceeds the specified threshold
value (by default, these parameters are equal to 1). The search is carried out
taking into account (or not) the orientation of the arcs.
2.
Sorting the set of paths in descending
order of path length or total weight of vertices.
3.
Sequential arrangement on a plane (assignment of
coordinates to the vertices) of paths in such a way that the most significant
paths are located higher, and the following features are taken into account:
—
each path fits from left to right, based on the
order of the vertices that make it up;
—
vertices that are part of multiple paths are not
duplicated, and their incident arcs are attached to the first known instance of
a vertex (such arcs reflect connections between paths).
4.
Analysis of the density of subgraphs and the connectivity
of graph paths. The connectivity between the two paths is calculated from the
number of common vertices and by the number of arcs between the vertices of the
first and second path.
The paths
that are more connected are adjacent. The densest subgraphs and connectivity
components are separated from each other on the plane.
The
hanging vertices of the most significant paths are approaching them in the
plane.
The fourth step of the algorithm is aimed at reducing the size
of the occupied area, reducing the number of intersections of arcs and reducing
their length. However,
due to
the high computational complexity that results in longer waiting times for
visualization, this step is not mandatory.
A model for visualizing an entity’s surroundings provides a
representation of all elementary facts extracted from the text in which the
respective entity’s apex is involved. Sequential application of the model
allows choosing the next vertex for analysis and thus choose a direction and
form a semantic neighborhood.
In this
way,
the researcher forms an idea of the
object
sought, whose depth and completeness are determined by the content of the text.
So, consider the algorithm for working with the Neighborhood
Visualization Model:
1.
Selecting of vertices of an ontology graph from a
given entity name (may correspond to an expression of a search query), resulting
in some subgraph containing the vertices {
v1
… vn
}.
2.
Construction of a neighborhood of a vertex
vi
∈
{
v1
… vn
},
resulting in a subgraph consisting of the vertices {
v1
… vn
}
and related to vi in some neighborhood (the “radius” of the neighborhood defines
the user) to a vertex
vi
vertices {
vn+1
… vm
}.
3.
Executing p. 2 of the algorithm for any other
vertex in the set {
v1
… vn, vn+1
… vm
}.
The semantic search task can be reduced to an iterative
sequential solution of two tasks: a
classic
information retrieval task and in-depth analysis of the found documents, using the
ontology graph of the document as an interactive text and conceptual navigation
tool. The generic search scheme is shown in Fig. 2. The traditional scheme is supplemented
by the construction stages and analysis of the ontology graph of the full text
of document,
combining text fragments (information blocks) and
evaluating the results of the combination.
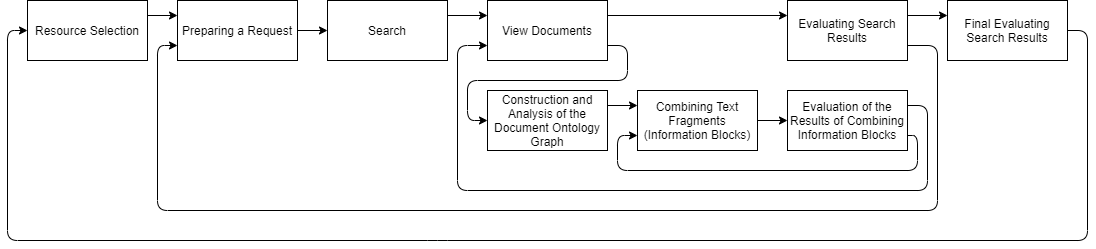
Figure 2 – Generalized search scheme
Visual analysis of the document’s ontology graph allows detecting
paths or connectivity components relevant to the user's search needs.
The transition from graph vertices to source text
fragments and the combination of such fragments allows new
knowledge
to be
discovered,
as well as checking for consistency of existing ones.
The presentation of the search results should be adequate to
the nature of
the task to be performed by the
user’s task, so that providing the person with a better perception, depending
on the type of task to be solved, is an important aspect of information
visualization.
The information retrieval tasks can be divided into two types – the
tasks of finding a solution to the problem of the main activity and the tasks
of an information-analytical nature, such as preliminary research, the search
for hypotheses or possible solutions.
The first type tasks involve finding a solution that can
always be represented by a process, that is, a directed sequence of events and
actions on objects.
This makes it necessary to
present the search results in the form reflecting the focus (from the starting
point to the “response”) of the decision and, in the ideal case, represent ideally
the algorithm of this decision.
The “pathfinding”
metaphor is suitable
for this kind of tasks, which involves sequencing points, corresponding
to objects, events, actions, expressed concepts (chains of elementary facts),
from basic concepts to concepts in the context of a potential solution to the
main activity problem.
The form of presentation of the visualization results in the
ontology graph corresponding to this metaphor is the path from the vertices of
the initial data (reference concepts, query terms) to the vertices containing
the solution concepts.
For information-analytical tasks, the metaphor of the search
for a neighborhood can be used, which involves visualizing the context of the
reference concepts. Grouping around reference concepts allows
the user to view the neighborhood, deepening into the exploration topic.
Thus, information retrieval on ontology graphs is reduced to the
following schemes:
—
search for a chain of facts corresponding to the fragments
of the source text, in the aggregate containing the solution to the problem of
the main activity;
—
search for the neighborhood of an elementary
(situational) fact, where the
reference
concept (the vertex of the graph) is used as a starting point;
—
a combination of the first two schemes.
The “finding a chain of facts” scheme involves the selection
of vertices, lined up in a directed or undirected chain (analogy –
finding a path between vertices) from the
original elementary fact to the target one (analogy –
finding causal relationships).
The “neighborhood search” scheme implies the selection of
vertices in the neighborhood of the original elementary fact (analogy – breadth
search in the graph), and the construction from selected vertices of the
complete construction – a completed fact (analogy – a snowflake scheme).
The combination of “finding a chain of facts” and
“neighborhood search” schemes involves their sequential or combined
application.
To solve these problems, the program “Service for visual
ontological analysis of scientific and technical texts” [25] has been
developed, implementing the models and visualization technology considered in
the article. The program includes a language parsing component of the text
using the methods of the «xIRBIS» [26] documentation and analysis system and
the lexicographic database [27].
For the drawing of the ontology graph, the open source
visualization library “vis network.js” [21] is used. The interface fragment of
the developed program is shown in Fig. 3.
The program can function independently (in the web server
mode) and can be used for semantic text analysis, as well as a part of the
“xIRBIS” system [26] which allows to apply the developed models and technology
directly in the process of information retrieval.
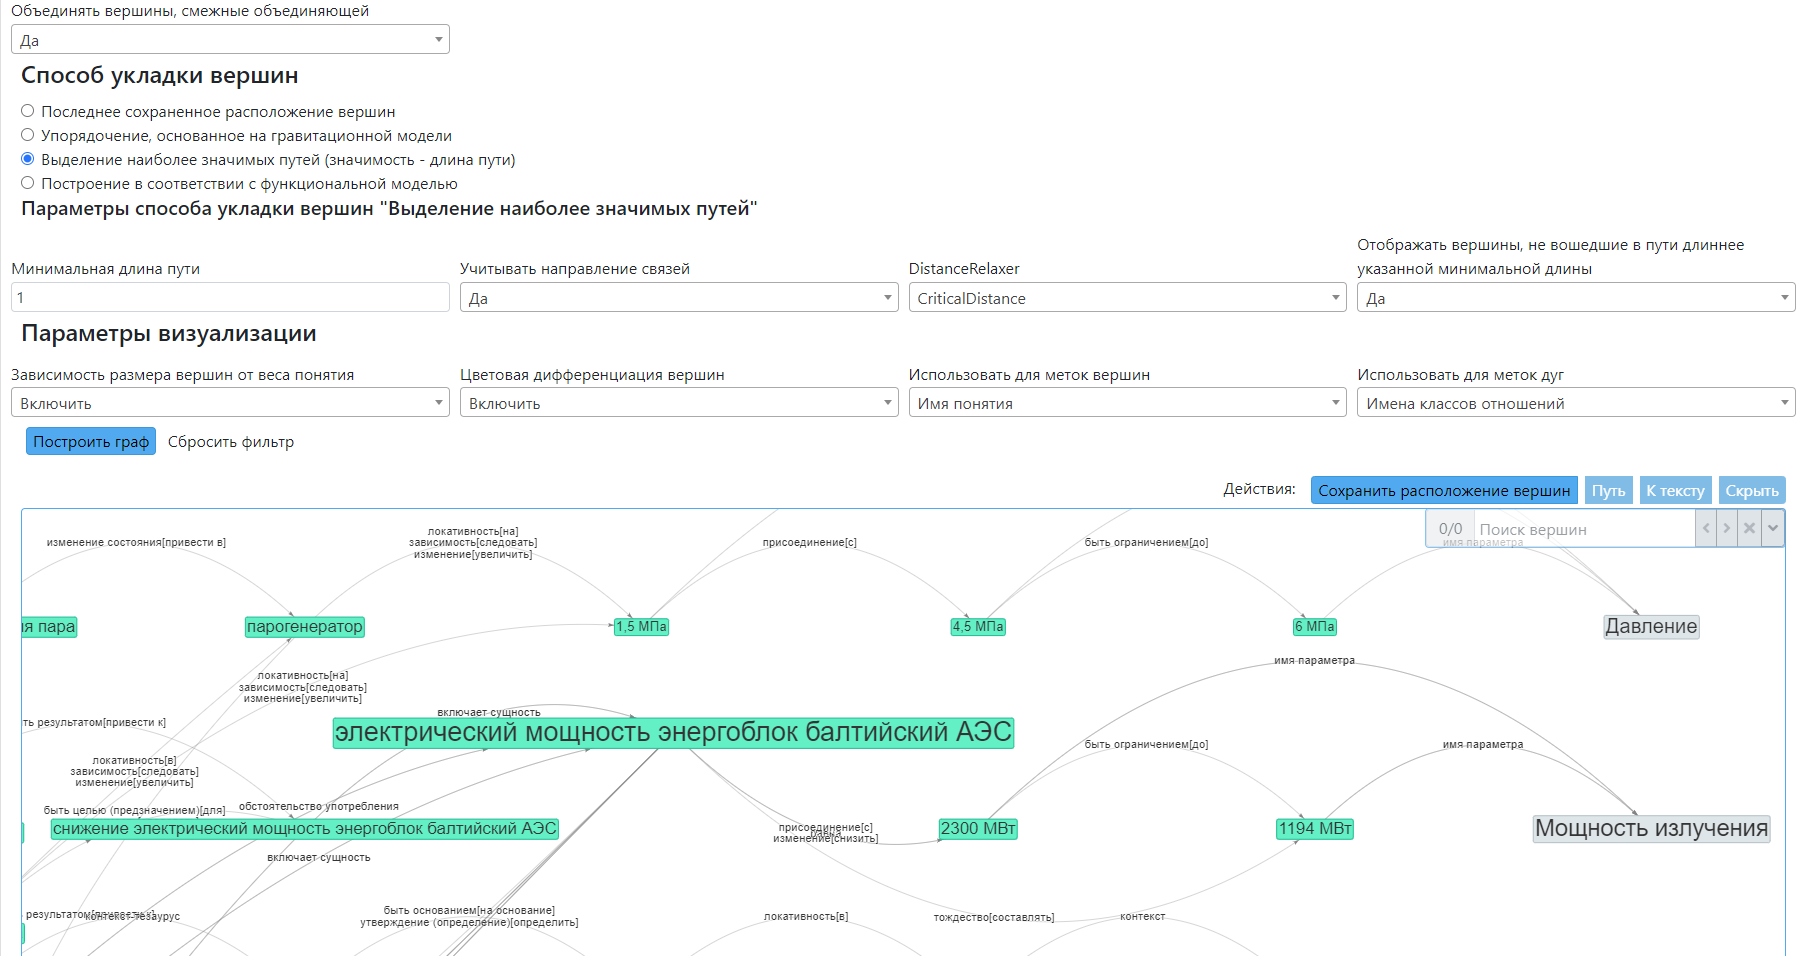
Figure 3 – Interface
fragment of the Scientific and Technical Visual Ontological Text Analysis
Service
Let us illustrate the application of the developed tools with
the example of the problem of incomplete
capacity
demand of the
Baltic nuclear power plant under
construction. As a result of information retrieval in the information resource on
the problem, documents [28, 29. 30] were found, the relevant fragments of which
are combined into a new text.
The
ontology graph is built on this text,
which, due to its large volume, is not fully
given here. A fragment of the ontology graph containing the vertex “Power” is shown
in Fig. 4.
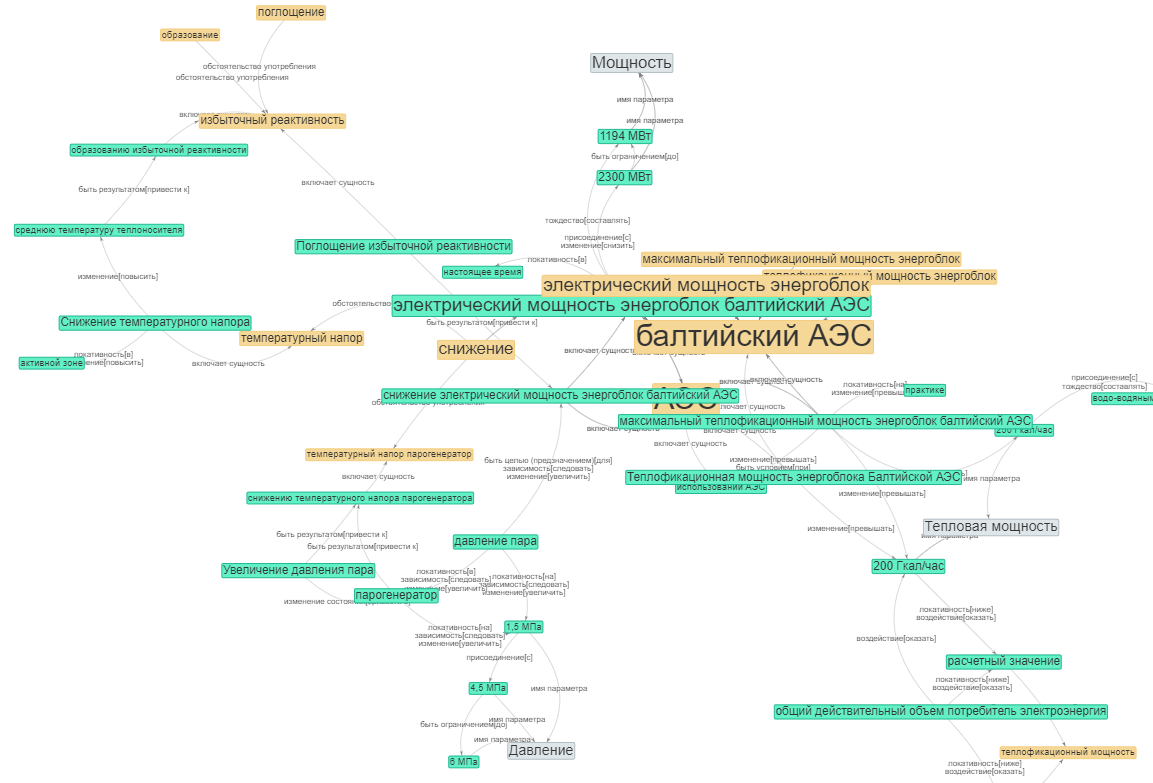
Figure 4 – Fragment of the
ontology graph of the text “The problem of incomplete capacity demand of the Baltic
NPP under construction” with layout vertices using the Barnes-Hut method
As a result of finding vertices in the graph by the query
”Power”, 12 vertices were found, one of which (the gray vertex in the upper
part of Fig. 4) is extracted in accordance with the taxonomy of properties
and units
of measure [14] due to the
presence of the vertices “1194 MW” and “2300 MW”, containing the unit of
measurement megawatts. Other properties extracted similarly are the
vertex “Pressure” (gray vertex at the bottom of Fig. 4) and
“Heat rate” (gray vertex at the right side of Fig. 4). Let’s build the shortest
path between the vertices “Pressure” and “Thermal power” (see Fig. 5, the path
is highlighted in red) in order to trace the relationship between the
corresponding parameters.
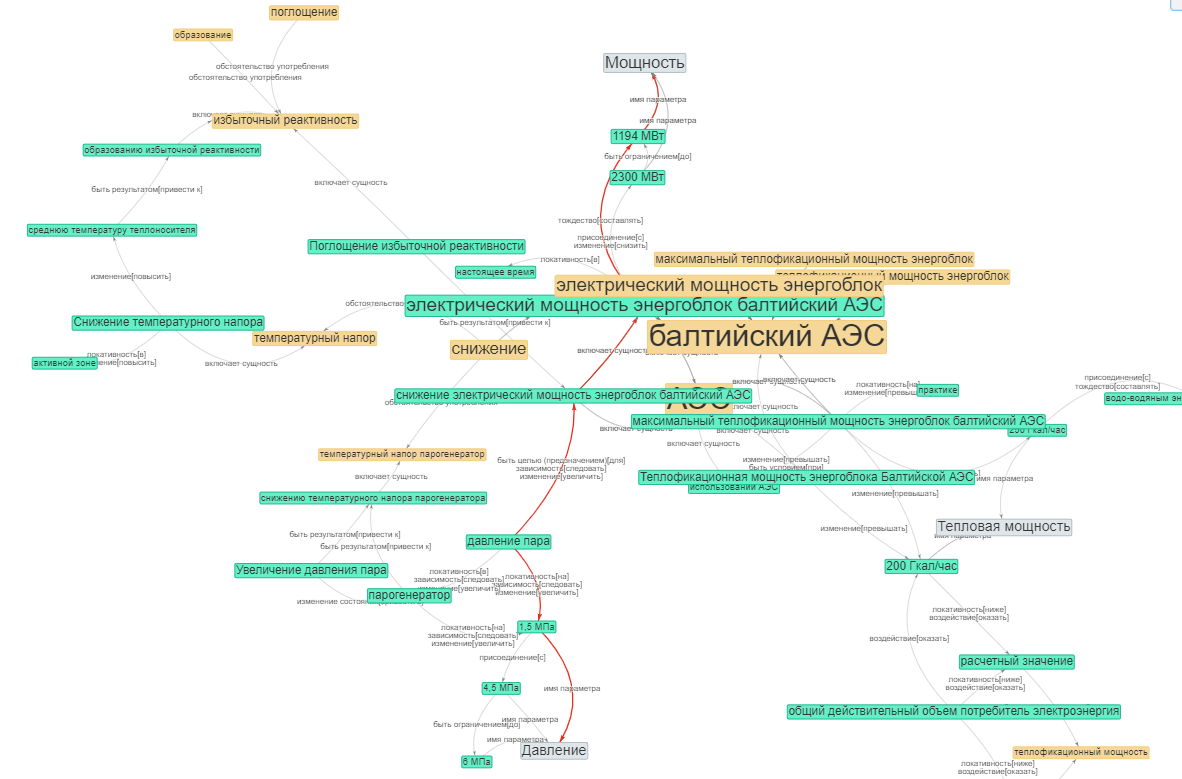
Figure 5 –
Fragment of the ontology graph of the text “The problem of incomplete demand
for the power of the Baltic NPP” with the graph layout using the Barnes-Hut
method and the shortest path (highlighted in red) between the vertices “Pressure”
and “Power”
The path (see Fig. 5) contains the elementary fact “vapor
pressure” – “to be the goal (destination) [for] dependence [follow] change
[increase]” – “reduce the electrical power of the power unit of the Baltic NPP”.
Let us consider further the elementary fact “vapor pressure” – “locality [in]” –
“steam generator”. It follows from these two elementary facts that the
parameters of the steam
generator vapor pressure
and
the electric power of the power unit are related. Now it is necessary to
establish the nature of the connection.
Next to the red path notice the “decrease” vertex (yellow
vertex in the center of Fig. 5, to the left of the red path). This vertex is visually
differs in color and font size, which is a visual marker and indicates the
possible significance of the vertex.
Let's build the shortest path between the “Pressure” and
“Power” vertices through the intermediate “decrease” vertex (see Fig. 6, the
path is highlighted in red).
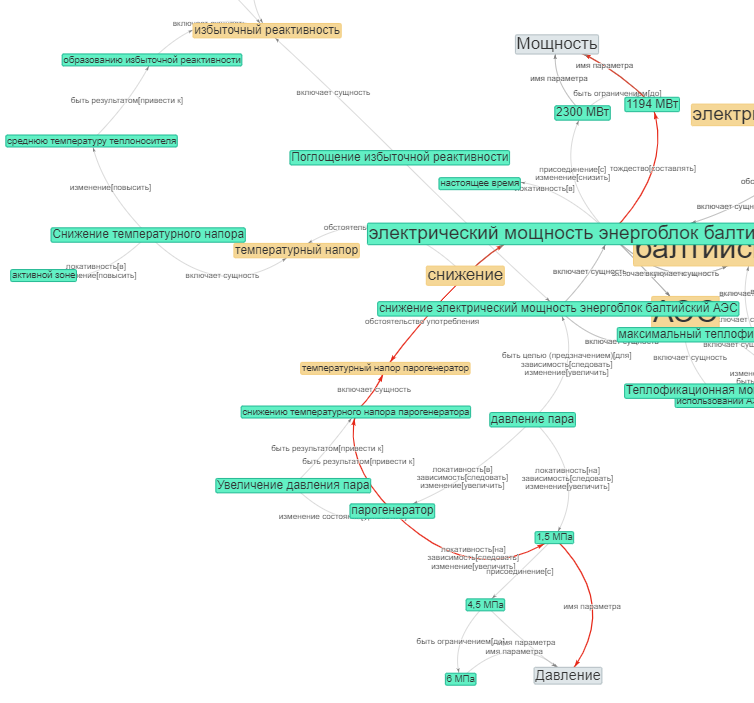
Figure 6 – Fragment of the
ontology graph of the text “The problem of incomplete capacity demand of the Baltic
NPP
under
construction” with the laying of peaks using the Barnes-Hut method and the
shortest path (highlighted in red) between the vertices “Pressure” and “Power” through
the intermediate
vertex “decrease”
Let us consider the vertices on the constructed path (Fig. 6)
in the context of adjacent vertices and see the following chain of elementary
facts: “increase in steam pressure” – “change of state [bring to]” – “steam
generator” – “be the result [lead to]” – “decrease of steam generator
temperature pressure”. That is, an increase in the pressure of the steam
generator leads to a decrease in the temperature pressure.
Further on the way “temperature pressure of the
steam generator” – “circumstance of consumption ” – “decrease” – “circumstance
of consumption” – “electric power of the power unit of the Baltic NPP”.
Let us consider in more detail the
circumstances of the use of electric power of the power unit of the Baltic NPP
in the context of the reduction.
The vertex of the “descent” has another
arc “use circumstance”, an incident
vertex of
the “temperature pressure”, which through a chain of elementary facts
is related to the vertex of the «redundant reactivity».
Let's build the shortest path between the vertices “Power”
and “Pressure” through the intermediate vertices “temperature head” and “excess
reactivity” (see Fig. 7, the path is highlighted in red).
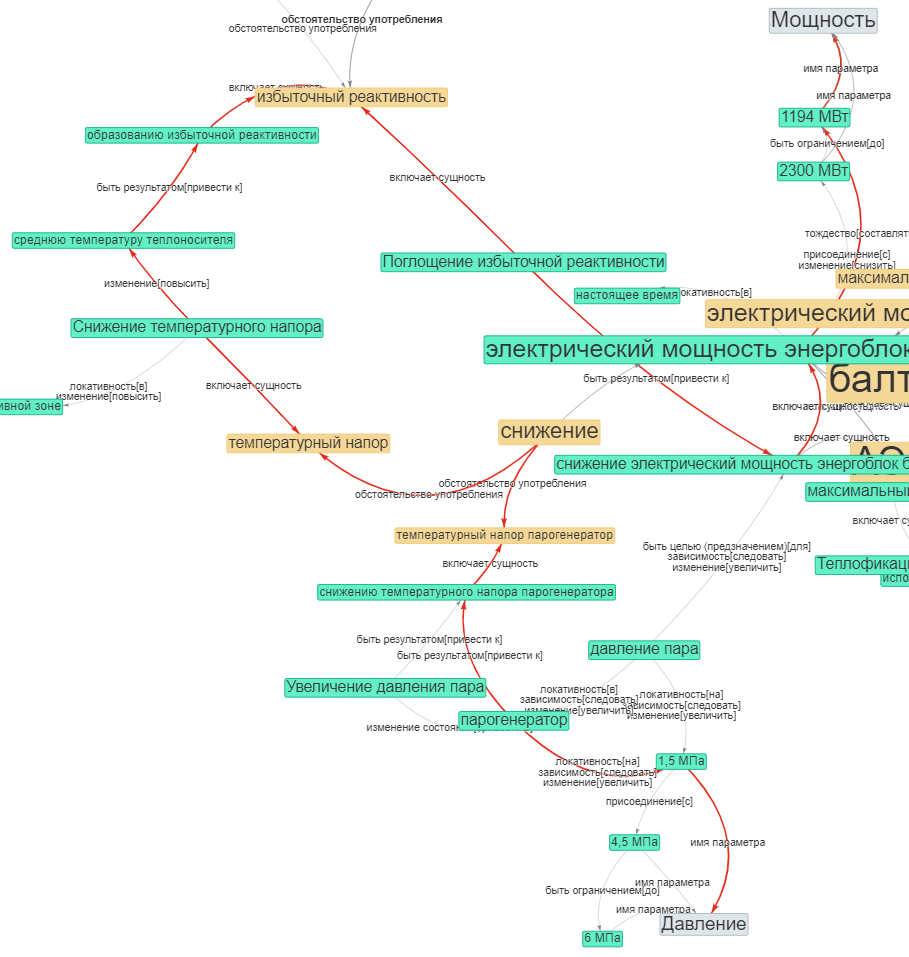
Figure 7 – Fragment of the
ontology graph of the text “ problem of incomplete demand capacity of the
Baltic NPP
under
construction” with the laying of vertices by the Barnes-Hut method and the
shortest path (highlighted in red) between the vertices “Pressure” and “Power” through
the intermediate
vertices “temperature pressure” and “over reactivity”
The path contains the following chain of elementary facts: “decrease
in temperature pressure” – “change [increase]” – “mean temperature of
heat carrier” – “result from [lead to]” – “formation of
excess reactivity” – “includes the entity” – “excess reactivity” – “includes an
entity” – “formation of excess reactivity” – “be the result of [lead to]” – “reduction
of electric
power of Baltic NPP
unit”.
“Reading” of the graph allows to conclude that an increase in
steam pressure in the steam generator will lead to decrease in steam generator
temperature pressure, which will lead to an increase in the average temperature
of the heat carrier,
which will lead to an
excess reactivity. The absorption of excess reactivity will lead
to a decrease in the electrical capacity of the power unit of the Baltic NPP.
Thus, a connection has been established between the parameters
of the vapor pressure in the steam generator and the electric power of the
power unit, and the nature of the connection has been established – an increase
in pressure will lead to a decrease in power.
Next,
it is
possible to interactively change the layout
of
the vertices (see Fig. 8), remove the extra vertices and arcs and save the
result, thus forming a completed fact on the problem
under
consideration. In the future, it could be consulted and used for textual navigation.
In particular, the use of a reference to a completed fact in the cognitive
rubricator [31]
makes it possible to implement
the
principle of preserving and accumulating knowledge.
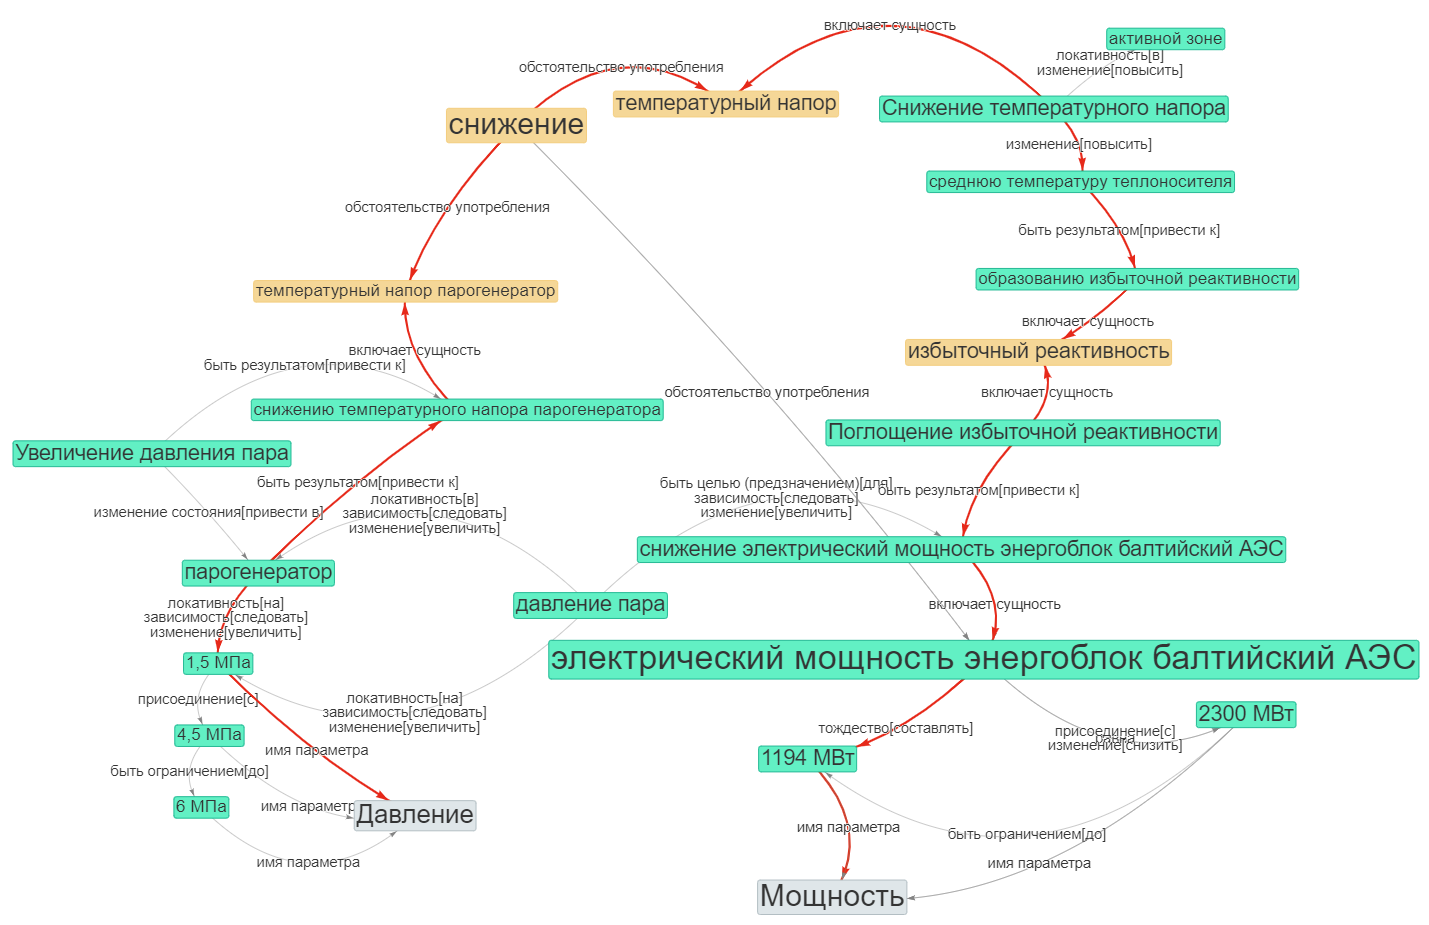
Figure 8 – Fragment of the
ontology graph of the text “The problem of incomplete capacity utilization of
the
Baltic
NPP” with interactive vertex layout
Let us illustrate the search by the scheme “neighborhood
analysis”. Let's build a graph based on a text fragment of the design
documentation document “Main circulation pumping unit” (MCPU), containing a
description of the pump design. Let' s carry out the selection of vertices by
the name of the entity “MCPU” and build a neighborhood of the vertex “MCPU” radius
1. We get the subgraph shown in Fig. 9.
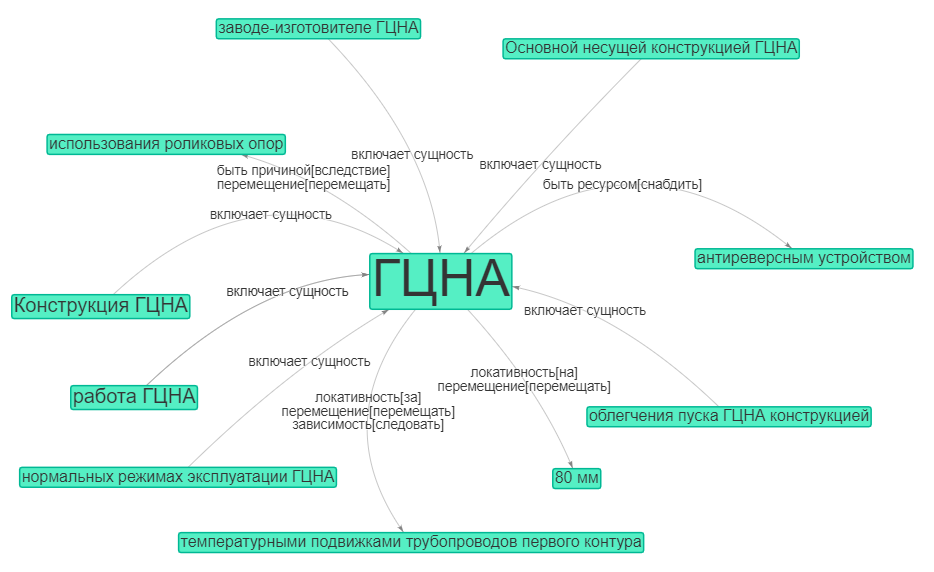
Figure 9 –
Neighborhood of the vertex "MCPU"
All vertices of the formed subgraph (Fig. 9) have the origin of
“from the text”, as indicated by the vertices’ color. The adjacent vertices for
the vertex “MCPU” have the same font size (the size depends on the weight),
which indicates the
equivalence of entity
names in the text.
For the elementary fact “anti-reverse device” – “to be a
resource [provide ]” – “MCPU”, build a neighborhood of the vertex “anti-reverse
device” (Fig. 10).
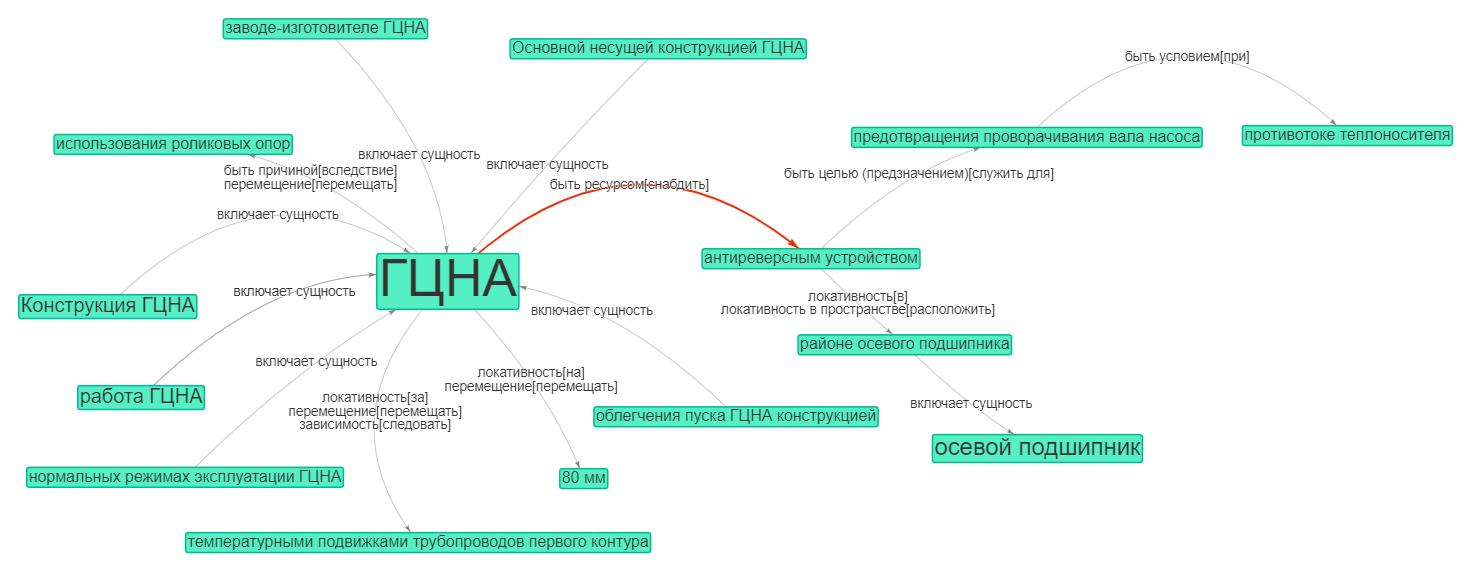
Figure 10 – Expansion of
the neighborhood of the term “MCPU” in the direction of “anti-reverse device”
The built neighborhood includes two chains of elementary facts
representing the location and purpose of the anti-reverse device:
—
“anti-reverse device” – “to be the goal (purpose)
[serve for]” – “prevent the pump shaft from
being
rolled up” – “to be a condition [at]” – “counter flow of the
heat carrier”;
—
“anti-reverse device” – “locality [in]” – “area of
the axial bearing” – “includes the entity” – “axial bearing”.
The vertex of the “the axial bearing area” is linked by the
structural-linguistic relationship “includes the entity” with the vertex
of the “axial bearing”. Moreover, the “axial bearing” vertex
is distinguished by its large size in relation to adjacent ones, which signals
its greater weight and, accordingly, its significance in the text.
Let us build a situational fact for the elementary fact “area
of the axial bearing” – “includes an entity” – “axial bearing” by applying the
function of constructing a neighborhood to the “axial bearing” vertex. We get the
subgraph shown in Fig. 11.
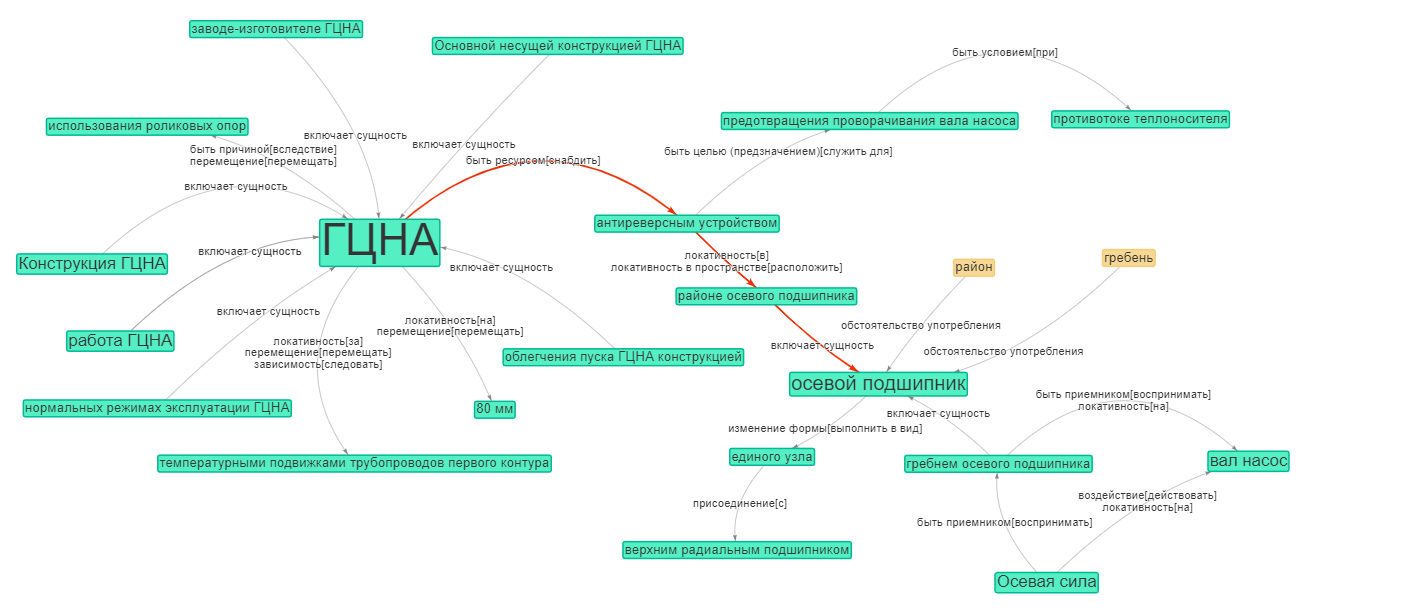
Figure 11 – Example of an expansion
of the neighborhood of the term “MCPU” through the neighborhood of the term
“anti-reverse device” in the direction of the term “axial bearing”
The neighborhood of other terms can be studied in a similar
way.
Thus, by the constructed graph it is possible to “restore” text:
“The MCPU has such a resource as an anti-reverse device, which is designed to
prevent the pump
shaft from turning under the
condition of the carrier
counter flow
and is located in the area of the
axial bearing, which looks like a single unit with an upper radial bearing. In
this case, the crest of the axial bearing
perceives
the axial force which influences on the pump shaft”.
Using the function of transition from vertices to the source text,
fragments of the text were obtained that were used to build the graph: “… The
axial force acting on the pump shaft is perceived by the crest of the axial bearing.
The axial bearing is structurally designed in the form of a single unit with an
upper radial bearing. … The MCPU is equipped with an anti-reverse device,
which is used for preventing the pump shaft from turning
during counter flow of the heat carrier located in the area of the axial
bearing”.
A comparison with the original text showed that the meaning
was largely not distorted.
In this article the technology of constructing and visualizing
a semantic image of the full text of the document, represented by ontology, is proposed.
The typology of ontology information components by contextual
certainty and completeness of the semantic structure ensures the correspondence
of the data logical and semantic levels: an elementary fact corresponds to a
separate action (event), a situational fact – to a separate statement, and a completed
fact – to a decision.
A general scheme for solving information retrieval tasks has been
developed, which, in addition to the steps corresponding to the classical information
search, involves constructing, visualizing and analyzing the ontology graph of
a document. The ontology information retrieval on graphs is reduced to schemes that
include finding a chain of facts and searching for the neighborhood of an elementary
(situational) fact. The variant graph imaging technology consists of the
following steps:
—
selection of the elements of a graph in accordance
with the user’s objective;
—
forming a representation according to
visualization metaphor;
—
forming an image according to the
visualization model.
Based on the typology of documentary information retrieval
tasks, two visualization metaphors have been defined. The “pathfinding”
metaphor corresponds to the construction of a directed chain of facts from the
starting points to the target positions. The metaphor “neighborhood analysis”
corresponds to the exploration of the environment (context) of the original
fact. In general, this makes the perception more effective by means of
purposeful and manageable reduction of the dimensions of the operating space
and profiling.
The visualization model defines the logic of
laying graph elements in the plane. The Barnes-Hut method of
laying vertices; placing vertices in the order of use (appearance) of entity
names in the text; placing vertices according to the significance of paths
(long path or total weight of vertices); laying vertices according to some
scheme (for example, the IDEF0 functional model) have been implemented.
The developed software allows constructing the ontology graphs
on text in natural language,
as well
as providing opportunities to select, configure and manipulate fragments of
ontology according to metaphors of path search and neighborhood analysis. The
ontology graph here acts as a technological space of “entry points” into the
information array, providing the possibility of a direct transition from the
graph vertices to the corresponding fragments of the document text.
The developed interactive tools with ontology graph implement
the principle of display dynamism (which provides the possibility of a
consistent perception of the object or process), and the tools to reduce the
dimensionality of ontology to a level acceptable by human perception – the
principle of minimizing the time spent on data analysis.
At the same time, trial operation and application
examples have shown that the quality of visualization largely depends
on the quality of
constructing a
semantic
image, in particular on the accuracy of the selection and identification of the
entities and relationships in the text.
This work was supported by the Ministry of Science and Higher
Education of the Russian Federation (state assignment project No.
0723-2020-0036)
1.
Golitsyna, O. L., Maksimov, N. V., Okropishina, O.
V., & Strogonov, V. I. (2012). The ontological approach to the
identification of information in tasks of document retrieval. Automatic
Documentation and Mathematical Linguistics, 46(3), 125-132.
2.
Maksimov, N. V. (2018). The methodological basis
of ontological documentary information modeling. Automatic Documentation and
Mathematical Linguistics, 52(2), 57-72.
3.
Peirce Ch.S., Sowa J. Existential Graphs: MS 514
by Ch. S. Peirce with comment by J.F. Sowa. Retrieved May 20, 2020, from http://www.jfsowa.com/peirce/ms514.htm
4.
Mikhailov, A. M., Chernyj, A. I., &
Giljarevskij, R. S. (1968) Fundamentals of Informatics. [in Russian]
5.
Zakharova, A., & Shklyar, A. (2014). Basic
principles of data visual models construction, by the example of interactive
systems for 3D visualization.
Scientific Visualization, 6(2), 62-73. [in
Russian]
6.
Gordeev, D. S. (2018) A survey of visualization
techniques of algorithms on graphs. Scientific Visualization, 10(1), 18-48. [in
Russian]
7.
Averbukh, V. (2013). Semiotic approach to forming
the theory of computer visualization. Scientific Visualization, 5(1), 1-25.
8.
Stepin, V. S., Guseynov, A. A., & Semigin, G.
Y. (2010). Novaya filosofskaya entsiklopediya. V chetyrekh tomakh [Sociology
history and modernity]./In-t filosofii RAN.
Nauchno-red. M., Mysl, 4,
275-276.
[in Russian]
9.
Golitsina, O. L., Maksimov, N. V., Okropishina, O.
V., & Strogonov, V. I. (2013). An ontological approach to information
identification in tasks of document retrieval: A practical application.
Automatic
Documentation and Mathematical Linguistics, 47(2), 45‑51.
10.
Maksimov, N. V., Golitsina, O. L., Monankov, K.
V., Lebedev, A. A., Bal, N. A., & Kyurcheva, S. G. (2019). Semantic Search
Tools Based on Ontological Representations of Documentary Information.
Automatic
Documentation and Mathematical Linguistics, 53(4), 167-178.
11.
Skorokhod'ko, E. F. (1974). Linguistic problems of
text processing in automated information retrieval systems.
Vopr.
Inf. Teor. Prakt, (25), 5-120.
[in Russian]
12.
Belonogov, G. G., Bystrov, I. I., Novoselov, A.
P., Kozachuk, M. V., Khoroshilov, A. A., & Khoroshilov, A. A. (2002).
Automatic conceptual text analysis.
Automatic Documentation and
Mathematical Linguistics
, 36(5), 57-65.
13.
Maksimov, N. V., Gavrilkina, A. S., Andronova, V.
V., & Tazieva, I. A. (2018). Systematization and identification of semantic
relations in ontologies for scientific and technical subject areas.
Automatic
Documentation and Mathematical Linguistics, 52(6), 306-317.
14.
Maksimov,
N., Gavrilkina, A., Kuzmina, V., & Borodina, E. (2020). Ontology of
Properties and its Methods of Use: Properties and Unit extraction from texts.
Procedia Computer Science, 169, 70-75.
15.
Zakharova, A., & Shklyar, A. (2013).
Visualization metaphors.
Scientific Visualization, 5(2), 16-24.
[in Russian]
16.
Podvesovskii, A. G., &
Isaev, R. A. (2018). Visualization metaphors for fuzzy cognitive maps.
Scientific
Visualization, 10(4), 13-29.
17.
Averbukh, V. L., Bakhterev, M. O., & Manakov,
D. V. (2017). Evaluations of visualization metaphors and views in the context
of execution traces and call graphs.
Scientific Visualization, 9(5),
1-18.
18.
Kasyanov, V., Kasyanova, E. (2014). Information visualization
on the base of graph models. Scientific
Visualization
, 6(1),
31-50.
[in Russian]
19.
Pupyrev, S. N., &
Tikhonov, A. V. (2010). The analysis of complex networks with dynamic graph
visualization. Modelirovanie i Analiz Informatsionnykh Sistem, 17(1), 117-135.
[in Russian]
20.
Kasyanov, V. N., Zolotukhin, T. A., & Gordeev,
D. S. (2019). Visualization Methods and Algorithms for Graph Representation of
Functional Programs.
Programming and Computer Software, 45(4), 156-162.
21.
Open Source Visualization Library to Display Networks
“vis-network.js”. Retrieved August 12, 2020, from
https://github.com/visjs/vis-network
22.
Pilyugin, V. V., & Milman, I. (2019). Visual
analytics and its use in the NRNU MEPhI “Scientific Visualization” laboratory
activities. Scientific Visualization, 11(5), 46 – 55.
23.
Sugiyama, K. (2002). Graph Drawing and
Applications for Software and Knowledge Engineers. Series on Software Engineering
and Knowledge Engineering.
24.
Apanovich, Z. V. (2012). Modern Force-directed Algorithms
for Visualization of Large Volumes of Information. In Problems of Management
and Design in Complex Systems (pp. 164-171). [in Russian]
25.
Maksimov, N. V., Golitsyna, O. L., Monankov, K.
V., & Gavrilkina, A. S. (2021). A Prototype of a Service for Visual Ontological
Analysis of Scientific and Technical Texts. State Registration Certificate, (2021610648).
[in Russian]
26.
Maksimov, N. V., Golitsyna, O. L., Monankov, K.
V., & Gavrilkina, A. S. (2020). Document Information-Analytical System
xIRBIS. State Registration Certificate, (2020661683). [in Russian]
27.
Maksimov, N.V., Golitsyna, O. L., Tameev, A.A., Monankov,
K. V., Gavrilkina, A. S. et al. (2019). Lexicographic Database for Linguistic
Support of Documentary Information Retrieval Tasks. State Registration
Certificate, (2019622150). [in Russian]
28.
Project AES-2006, JSC “SPbAEP”. Retrieved May 20,
2020, from http://atomenergoprom.ru/u/file/npp_2006_rus.pdf [in Russian]
29.
Baltic nuclear power plant. Retrieved May 23,
2020, from https://energybase.ru/power-plant/Baltic_NPP [in Russian]
30.
Problems of increasing the maneuverability of
nuclear power plants. Retrieved May 20, 2020, from https://tesiaes.ru/?p=9250 [in
Russian]
31.
Maksimov, N. V., Golitsyna, O. L., & Usenko,
A. L. (2014). The structure and components of the operational visual space for
scientific interactive information retrieval.
Journal on Scietific
Visualization, 6(4), 96-106.
Such a construction is carried
out in accordance with some goal, methodological scheme and criteria for evaluating
the result.
At the same time, the person
formulates the decision itself in his mind.
It should be noted
that the ultimate goal of the search is not only to solve the problem using the
information found, but also the confirmation of the completeness of the final
output (confidence that there are no other, alternative ways and solutions). And
this is a separate branch of technology.
Note that the
orientation of the ontology graph (first of all, this applies to the functional
system) is determined not only by the orientation of the arcs, but also by the
semantic “directionality” reflecting the evolution of the semantic image of the
object/result. This means that the name of an individual entity or relationship
in the graph will be presented in several “instances”.
In this case,
it can be argued that both concepts and relationships act as linguistic
variables, the specific meaning of which is further determined by the situation
– a well-defined context (this is also a controlled context: through the
setting of an aspect and/or a parameter of conceptual depth and/or breadth),
specified by the types of relationships and the nature of related entities. And,
since the graph represents a
goal-oriented process, the order of the
vertices must be determined, including the
initial and final
(target) vertices.
Aspect
representations are one of the methodological foundations of the synthesis of
knowledge. The synthesis of knowledge as a self-organizing process is based on
the structural feature of the system - a complex system can be described using a
set of relatively independent aspect representations. Moreover, the decomposition
process not only separates and binds components, but also the decomposition
scheme is formed - a system of characteristic signs of division.
In this
article, the open source visualization library “vis network.js” [21] is used to
draw the graph. The library implements various methods of drawing arcs with
curves. The authors chose the method of depicting arcs with quadratic Bezier
curves for aesthetic reasons.
Vertex type
characterizes the origin of the corresponding name:
from text, from
thesaurus, from taxonomy of properties and units, part of a longer term
and
uniting vertices.
The role of
the entity name is defined according to a functional model similar to
IDEF0-model.
The weight
of the vertex is calculated based on the frequency of occurrence, role,
belonging to significant text fragments.
The
relationship class is determined in accordance with the taxonomy of functional
relationship classes [13].
The program is designed to work with texts in Russian. The interface is also designed in Russian.
The following
image agreement is then used. Green vertices have type «from the text», blue –
“from the thesaurus”, grey – “names of properties”, yellow – “parts of longer
terms”. The names of the classes of relations are used as labels of the arcs
of functional relations, next to each class name in square brackets is the
normalized linguistic construction by which the class was defined. The label
«parameter name» marks an arc that links a value from the text to the
corresponding property name from the taxonomy of properties and measurement
units.
A graph can also be constructed by combining relevant graph
fragments of ontology of document text.
