One of the important tasks in the oil and gas
industry is to assess the permeability and mechanical properties of rocks. These
parameters are often evaluated using mathematical simulations, for example,
numerical modelling of the multiphase fluid flow in pore space. The result of
calculations directly depends on the accuracy of the three-dimensional model of
oil-bearing rock, the so-called digital rock [1, 2]. This model is usually built from computed
X-ray [3] and FIB-SEM [4] tomography images. These two technologies
are based on various physical principles and are used to study
the internal material structure at different scales.
X-ray computed microtomography (MicroCT) belongs
to non-destructive techniques of visualization of the internal structure of
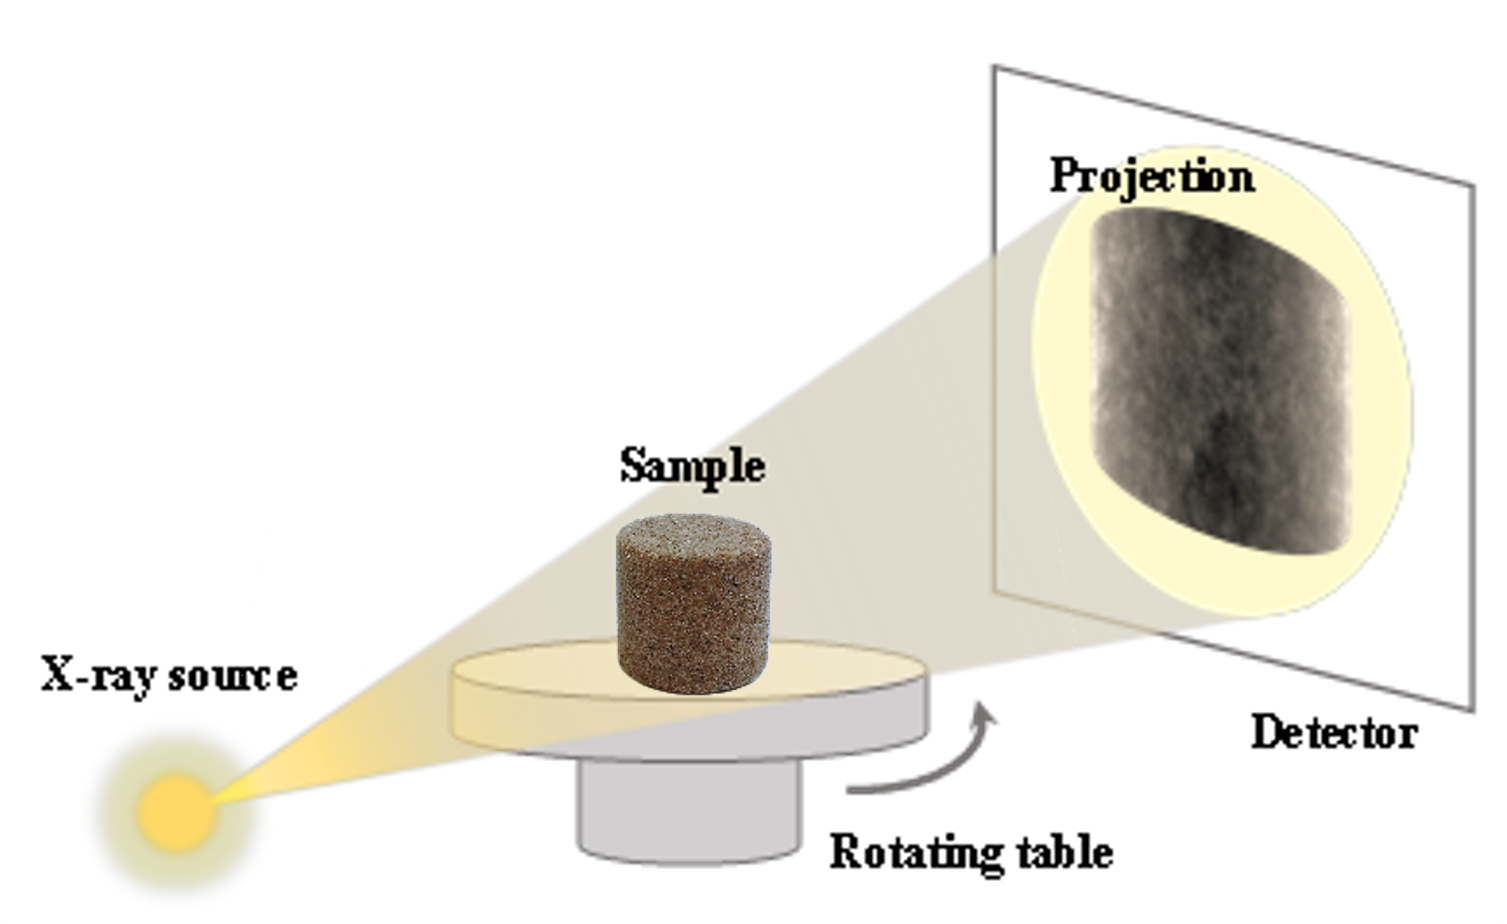
objects. The sample is irradiated by an X-ray beam from various sides. In
practice, this is implemented with rotating the object. After passing through
the substance, the beam intensity decreases in accordance with the spatial
distribution of the absorption capacity in the sample and is registered by the
detector (figureFigure
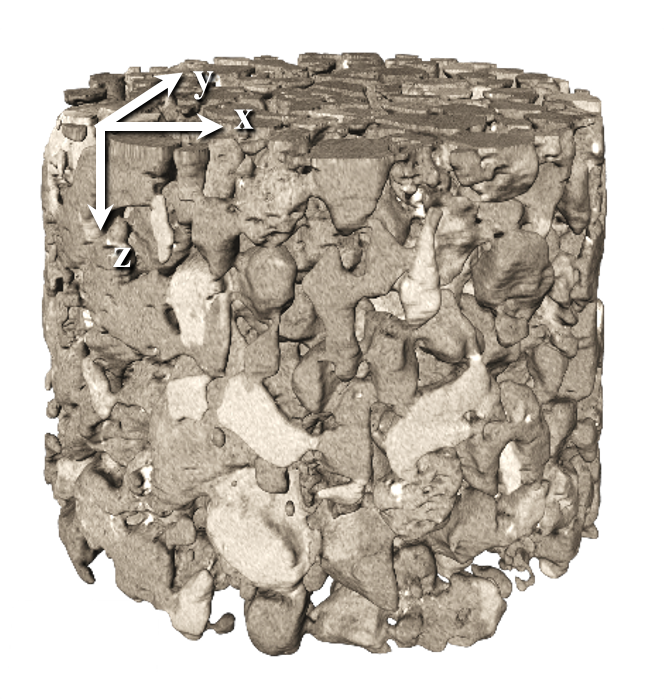
1a). A 3D image of the object is restored from a set of
obtained shadow projections (figure Figure 1b).
The spatial resolution of modern laboratory X-ray MicroCT systems can be about 1
μm.
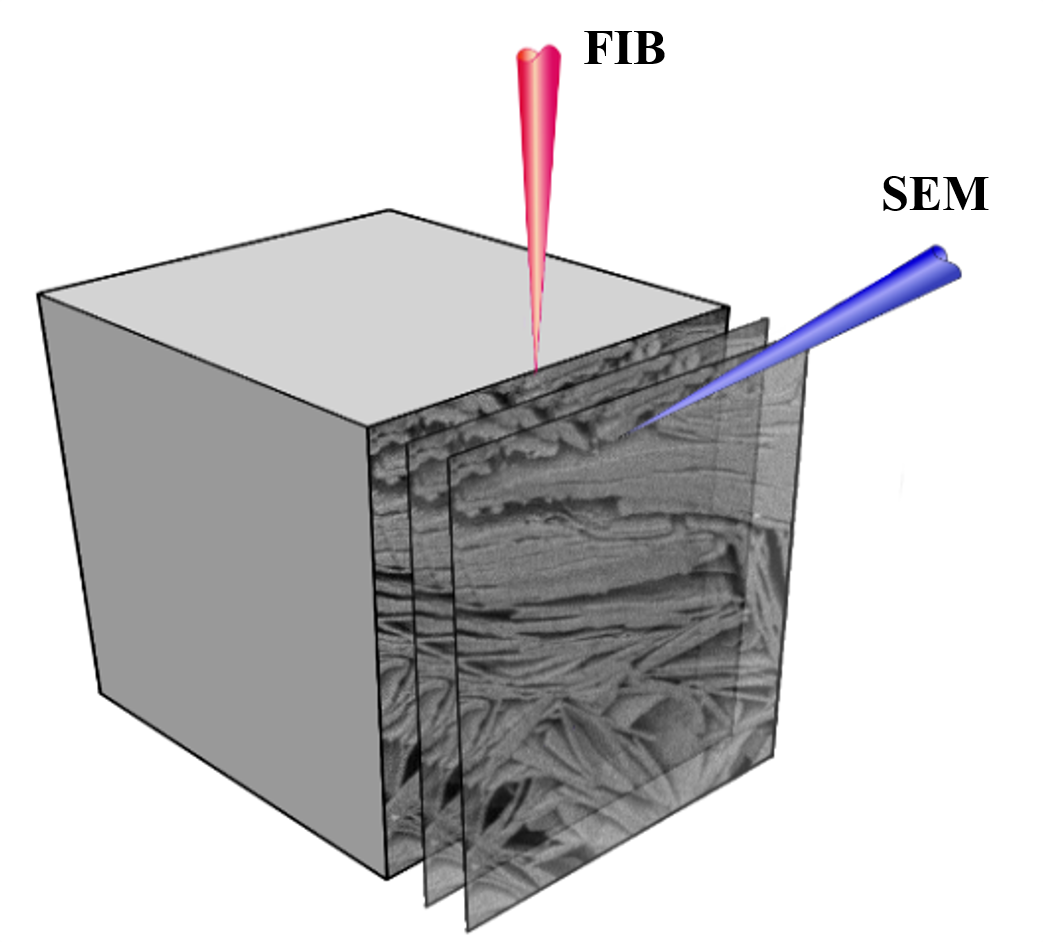
The FIB-SEM setup uses a combination of focused
ion beam (FIB) and scanning electron microscope (SEM) (figure Figure 2). The
ion beam removes a thin layer of substance from the sample, and then the
electron microscope takes an image of the surface. Multiple repetition of these
two operations produces a set of sequential images of the sample layers. This
technology can resolve details with size up to 5-10 nanometers and is widely
used to study the nanostructure of not only rocks, but also other objects, such
as fuel cell electrodes, semiconductors, nanomaterials, alloys, and biological
tissues [4].
|
|
|
|
а)
|
b)
|
|
Figure 1. a) X-ray microtomography scheme; b) restored three-dimensional image.
|
|
|
|
Figure 2. FIB-SEM tomography scheme.
|
Both X-ray and FIB-SEM images have distortions and
artefacts. Defects can be typical for any raster image (for example, high
noise, blur and low contrast) or specific to the particular image acquisition technology.
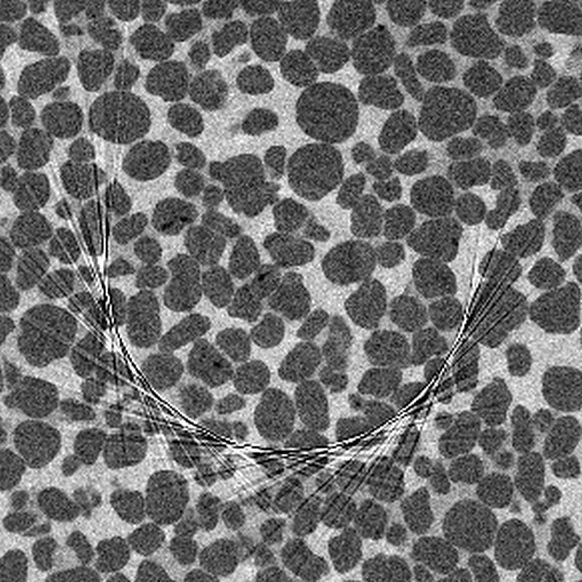
For example, ring-shaped artefacts may occur in
microCT images (figureFigure 3).
In addition, the sample can have high-density regions that appear as bright,
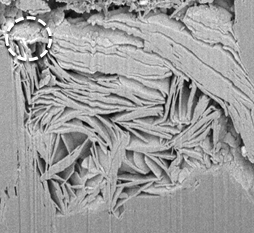
overexposed areas with local intensity distortions around them [3]. The artefacts in the form of high-intensity
regions are also found in FIB-SEM images due to local accumulation of electric
charge on the sample surface. Outwardly similar effect sometimes occurs at the
pore boundaries, where the probability to emit secondary electrons is higher
than inside the mineral matrix (indicated by the dashed line in figureРисунок 4).
Another common artefact of FIB-SEM images is vertical stripes (the so-called
“curtaining”) arising due to deflection of the ion beam during etching the
sample (figure Рисунок 4).
|
|
|
|
Figure 3. An example of ring-shaped artefacts in a microCT image.
|
Figure 4. An example of bright pore edges and curtaining in a FIB-SEM image.
|
Typical X-ray microtomography images are 20003
voxels or larger. FIB-SEM images can have similar size. However, the sample or
region of interest can occupy only a part of such image. Further mathematical
simulations usually require a cubic fragment with a side from 400 to 1000
voxels. Therefore, it is necessary to extract a small fragment of the best
quality (in particular, with the least number of artefacts) from the original
3D image, which will be used for subsequent analysis and calculations.
Currently, the operator usually subjectively evaluates the quality and does not
have visualization tools to select the most suitable area. Thus, there is the
problem to evaluate the quality of local fragments of three-dimensional
tomographic images and visualize such estimations.
In the field of image processing and analysis,
several non-reference (blind) quality criteria have been proposed at the
moment. Such measures make it possible to evaluate quality based on only the
image itself without marked reference data. They are usually developed for
two-dimensional photographs of nature, architecture, and everyday scenes, their
applicability for assessing the quality of microCT or FIB-SEM images is unevaluated.
Nevertheless, we assume that it makes sense to analyse the quality of the
slices of microCT and FIB-SEM images using existing non-reference criteria to
select 3D fragment of the highest quality.
Sometimes, the local quality of two-dimensional
images is characterized with heat maps, where the brightness or colour level of
each pixel in the image indicates the quality of the local fragment. For
example, in [5] a heat map
visualizes the quality of fingerprint images, and in [6] it is used for images of sample slides.
However, this method is ineffective for three-dimensional images, as it
requires significant time to look through the inner parts of the image. In
addition, we need to evaluate the quality of the local fragments with various
sizes, because the quality, among other factors, can influence the choice of
the fragment size for further modelling. In general, we can state that at the
moment the problem of visualization of local quality of 3D images has not been solved.
In this paper, we propose an approach to the
quantitative evaluation of the quality of slices and fragments of a three-dimensional
tomographic image and, also, a method for its visualization to facilitate selection
of a fragment for subsequent quantitative analysis of the sample structure and
mathematical simulations.
The paper [7] gives the taxonomy of existing
non-reference methods for assessing the quality of photographs. They can be
divided into two main categories: specific, which are intended for a particular
defect, and general. Specific quality metrics are used, for example, to
estimate noise level [8],
sharpness [9], blur [10], as well as artefacts of lossy
compression. Such quality assessments often precede the correction of the
corresponding defect: sharpness is evaluated to find parameters for blur
correction, and the level of JPEG artefacts is assessed to improve the quality
of compressed images [11].
However, most specific metrics are designed for ideal distortions, for example,
only Additive White Gaussian Noise (AWGN) is analysed. Also, these quality
criteria imply that the corresponding defects prevail over others, while real
images contain several types of distortion at the same time. Therefore, the use
of such particular metrics should come only after a thorough analysis of
possible defects for a given type of image and the mutual influence of these
distortions.
Universal quality metrics are usually based on
machine learning: the first step is extracting numerical features from the
images, and then the regression model is trained to match the features with the
assessments of observers [12, 13]. The training was held on photographs
from the LIVE data set [14],
which contains 29 undistorted images and their 779 copies affected by one of
five distortions: additive white Gaussian noise, Gaussian blur, JPEG
compression artefacts, JPEG2000 compression artefacts, brightness and contrast
changes. In some cases, models were adjusted with additional sets of images
with similar characteristics, for example, TID2008 [15].
We considered the following algorithms as
candidates for assessing the quality of microCT image slices: BIQI (Blind Image
Quality Index) [12], BRISQUE
(Blind Referenceless Image Spatial Quality Evaluator) [13], OG-IQA (Oriented Gradients Image Quality
Assessment) [16], NIQE (Natural
Image Quality Evaluator) [17]
and IL-NIQE (Integrated Local Natural Image Quality Evaluator) [18]. The BIQI algorithm [12] implements a two-stage approach for
assessing image quality, which is based on the natural scene statistic (NSS) in
the wavelet domain [19]. It is
assumed that natural images have certain statistical properties, and various
distortions change these statistical characteristics in such a way that the
type and degree of the distortion can be predicted. At the first stage BIQI finds
the most probable type of distortion and then quantifies the degree. Models for
classification at the first stage and regression at the second are trained
using the support vector machine (SVM) on data from the LIVE set. The BRISQUE
method [13] uses features from
NSS calculated in spatial domain [20]. One regression model for all types of
distortion is also trained by SVM on the LIVE image set. The OG-IQA algorithm [16] analyses the structure of the orientation
of image gradients. Distortion of natural images are assumed to change the
orientations of local gradients in a predictable way. The AdaBoost algorithm
for decision trees was applied to train the regression model used for all types
of distortions from the LIVE dataset. The disadvantages of the above models
include a small number of photographs and a limited number of deformations in
the training set, which leads to a low generalization capability of the
algorithms.
The NIQE quality assessment criterion [17] does not use distorted images for
training but constructs the multivariate Gaussian distribution (MVG) of NSS features
calculated in the spatial domain [20]. The image quality is defined as the
distance between its MVG and the reference MVG obtained from training on the
attributes of undistorted images from the LIVE set. IL-NIQE [18] uses a similar idea but operates with RGB
colour photo channels and with fragments that have significant intensity changes.
We suppose that the IL-NIQE method can be effective for a comparative
assessment of quality of microCT and FIB-SEM image slices. Firstly, it is
sensitive to defects that are common to all types of images, such as noise and
blur. On the other hand, a number of specific artefacts, for example, ring artefacts
in microCT and curtaining in FIB-SEM images also affect this criterion, since
they modify the MVG model of the undistorted image.
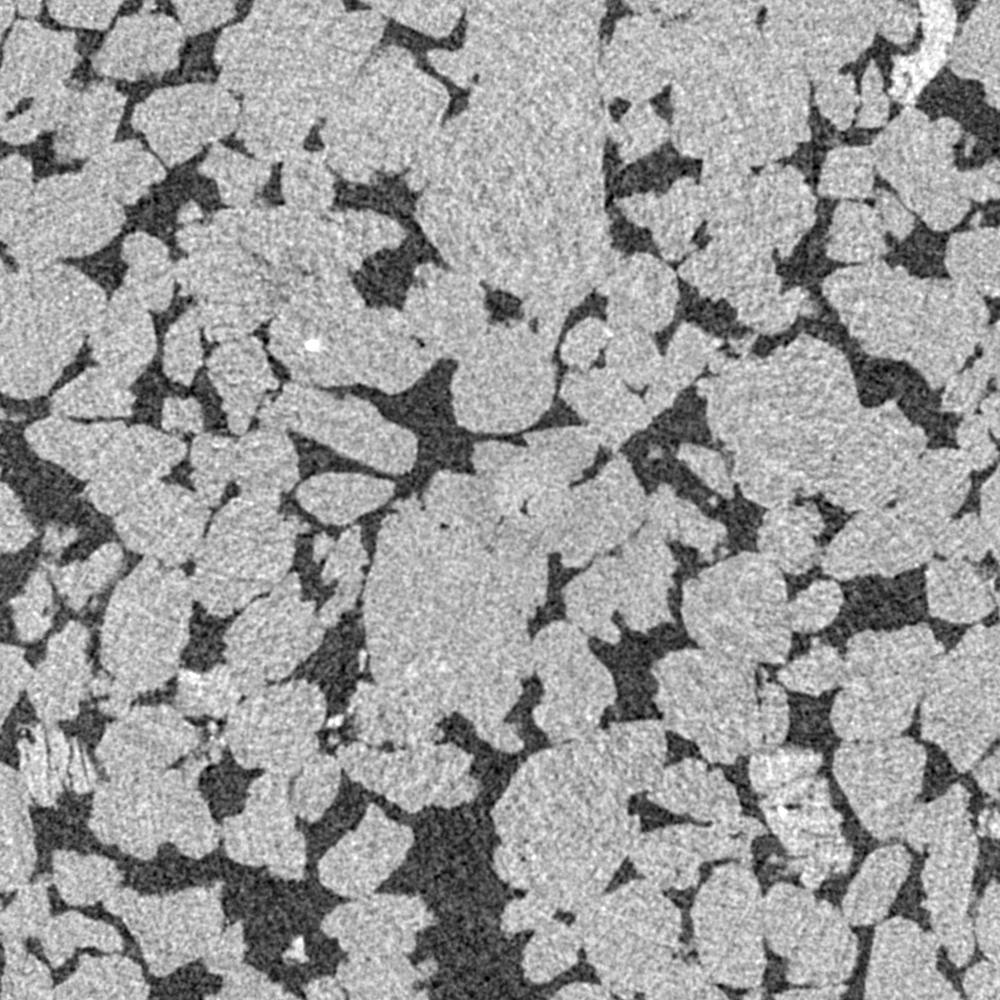
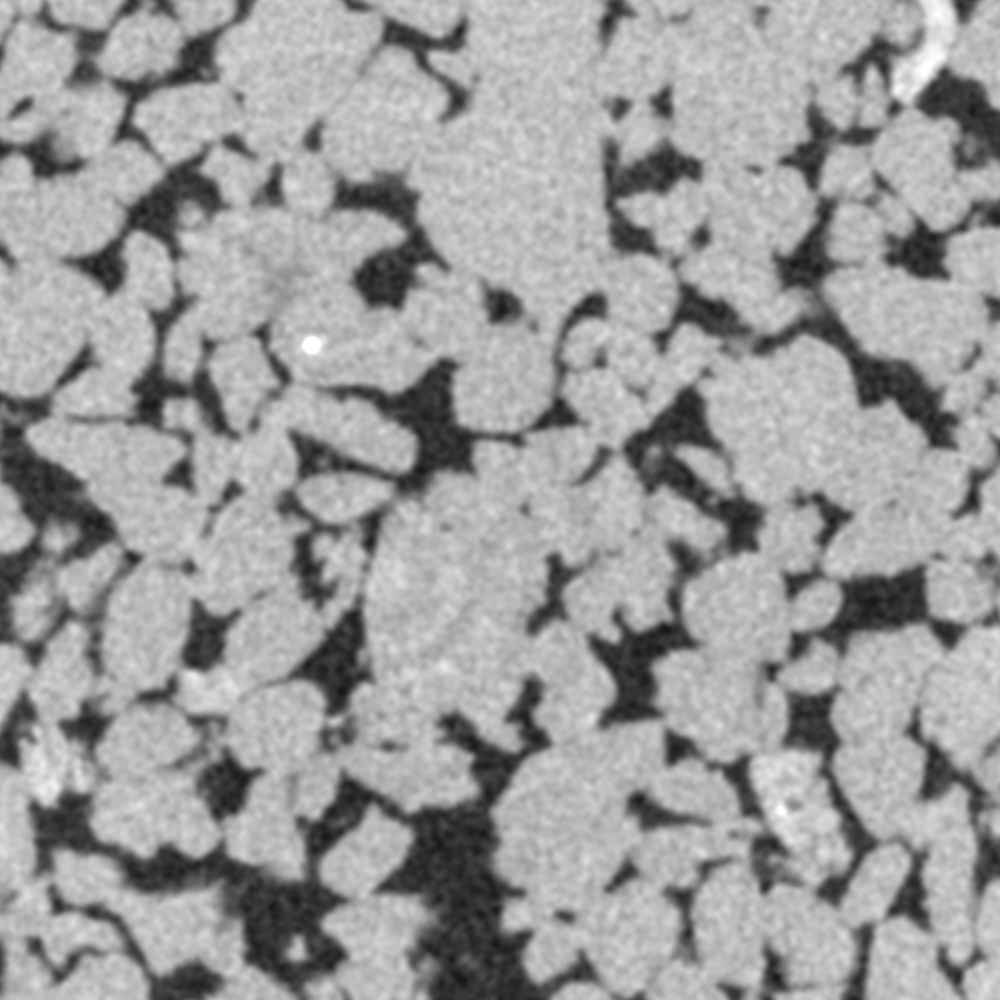
We considered the tomographic images of sandstone to
select the most suitable algorithm for the non-reference quality assessment. We
chose 10 images of the same sample scanned by several microCT systems in
different modes. Three experts independently performed pair-wise comparison of their
quality. Then the experts’ assessments were transformed into a continuous scale
[21] and compared to the
estimates of the above algorithms based on the correlation coefficient. Figure Figure 5 shows
the central fragments of two images from this set.
|
|
|
Figure 5. Examples of images with different
quality from the test set.
|
Table 1 presents the values of the Pearson
correlation coefficient between expert estimates and quality calculated with the
considered algorithms for the test image set. We evaluated quality for the
image of the entire slice and for its central part (25% of the image were
excluded from each side). This is because edges of the image often contain areas
not related to the sample.
The IL-NIQE algorithm applied for the central part
of the image showed the best result. Possible reason is that this measure less than
others relates to a fixed set of data distortions used for training, and also
uses a simpler model, less prone to overfitting.
Table 1. Pearson correlation coefficient between expert estimates and considered
quality criteria of microCT images.
|
Algorithm
|
Correlation coefficient
(for the whole slice)
|
Correlation coefficient
(for the central part)
|
|
BIQI
|
0.03
|
0.86
|
|
BRISQUE
|
0.69
|
0.43
|
|
NIQE
|
0.63
|
0.16
|
|
IL-NIQE
|
0.53
|
0.94
|
|
OG-IQA
|
0.48
|
0.39
|
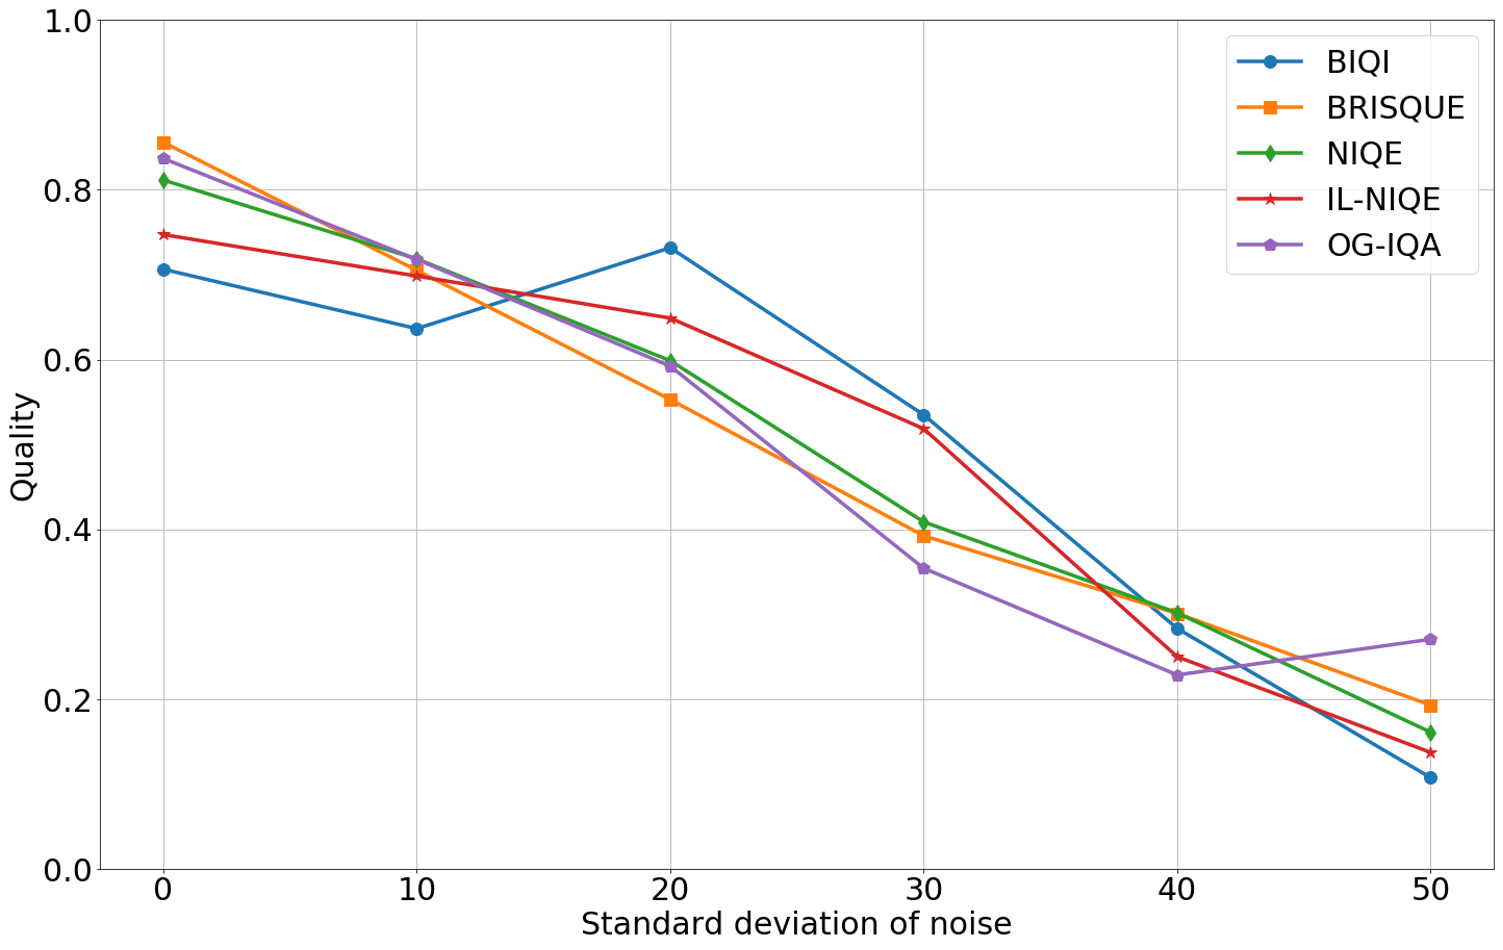
We put AWGN with various standard deviations on the FIB-SEM image (figure Рисунок 4),
and then calculated normalized quality measures (figureFigure 6).
The BIQI and OG-IQA criteria do not stay monotonic with increasing noise
variance, therefore, cannot represent the quality of FIB-SEM images.
|
|
|
Figure 6. Quality value depending on standard deviation of additive white
Gaussian noise applied to the FIB-SEM image.
|
Hereafter, we will use the IL-NIQE quality
criterion to assess the quality of each slice, since it correlates better with the
expert opinion on the quality of microCT images, and decreases monotonically
with increasing noise in FIB-SEM images
Three-dimensional microCT and FIB-SEM images are
usually stored as slices in the (xy) plane and most often viewed in the same
plane. Specialized software packages, such as Avizo® (Thermo Fisher
Scientific) [22], allow to
visualize any projection and cross-section of 3D images in interactive mode. It
is useful to analyse the central section of the image in the (xz) or (yz) plane
in order to quickly evaluate the quality of tomographic images and select a
fragment for further studies. In the case of X-ray tomography, such a central
section allows to see which part of the image belongs to the sample. For
FIB-SEM images, a side view immediately demonstrates how well the slices are
aligned relative to each other. Relative displacements in the (xy) plane
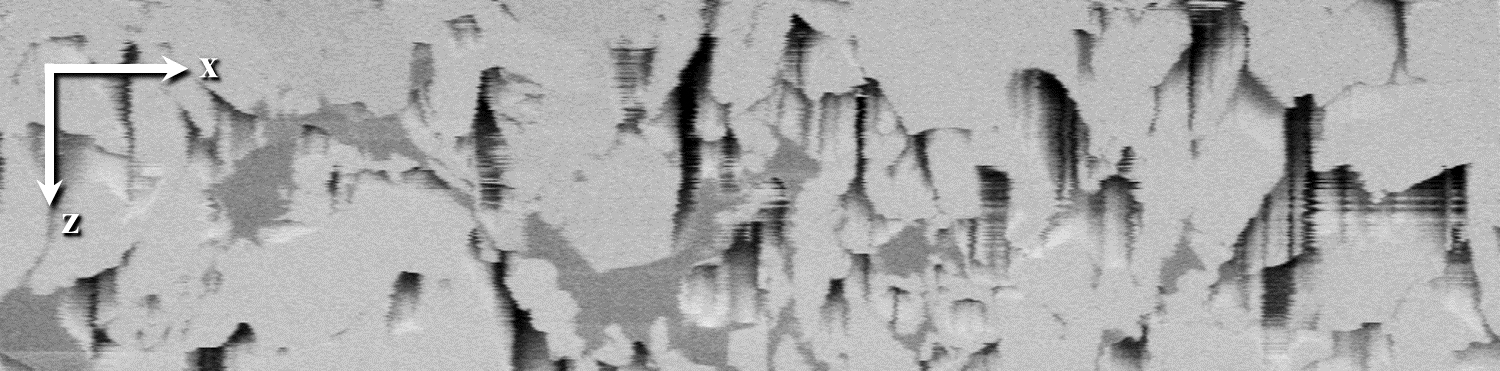
between adjacent slices lead to uneven pore edges on the side view (figureFigure 7).
|
|
|
Figure 7. Cross-section of a FIB-SEM image in (xz) plane.
|
Another important parameter for choosing the best
fragment is its homogeneity and representativeness (a measure of similarity
between the fragment and the whole sample volume). To characterize the homogeneity
of a three-dimensional image and the subsequent selection of a representative
fragment, it is useful to introduce a measure of “similarity” of the slices.
Let  be the histogram of a set of several
central slices. Let also
be the histogram of a set of several
central slices. Let also  be a histogram of an arbitrary slice inside the region of interest.
After normalization, both histograms и can be considered as
probability distributions. For two discrete probability distributions, and , similarity is
defined as the unit minus Hellinger distance [23]:
be a histogram of an arbitrary slice inside the region of interest.
After normalization, both histograms и can be considered as
probability distributions. For two discrete probability distributions, and , similarity is
defined as the unit minus Hellinger distance [23]:
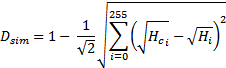 (1)
(1)
It makes sense to show quality and similarity calculated
for each slice over the image of the cross-section in the (xz) or (yz) plane (figure Figure 8). This visualization method allows the
operator to select the range of slices that is most suitable for further simulations
within the digital rock workflow.
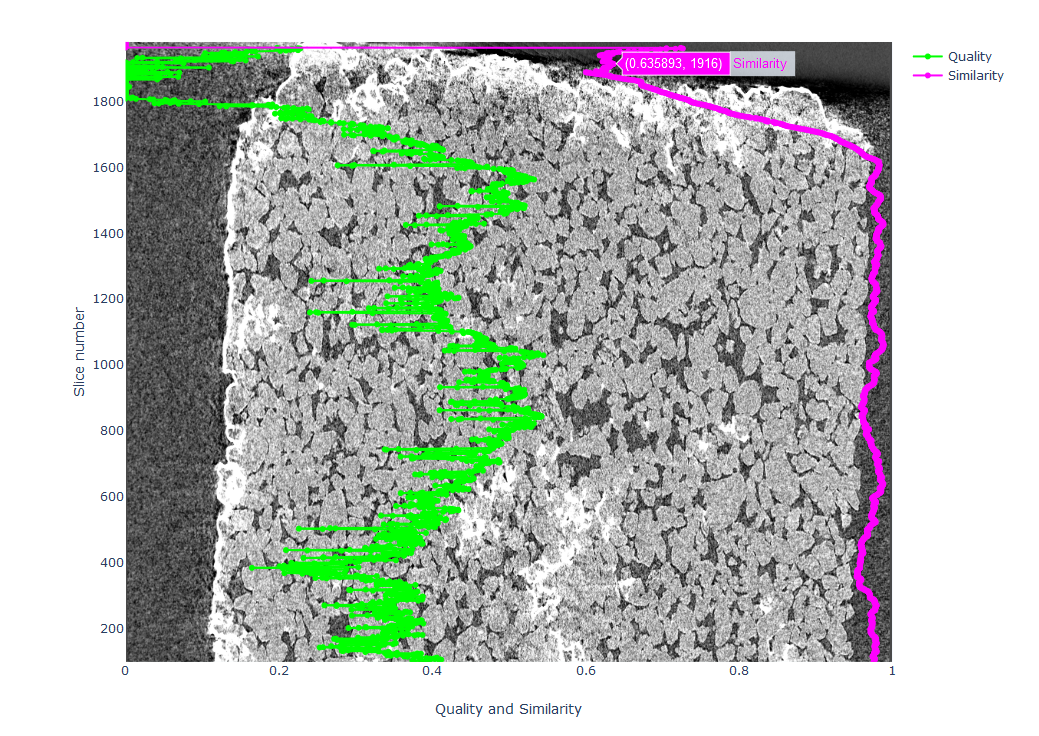
Figure 8. Quality measures and
similarity depending on the slice number displayed over central section of the
image in (xz) plane.
Another parameter while choosing the optimal
fragment is its size. Depending on the objectives of the study and the
structural features of the sample, fragments of various volumes are required
(usually from 0.1 mm3 to 10 mm3). Thus, information on
the integral quality of the selected image fragment depending on its size is of
interest. For this purpose, we propose to evaluate and visualize the quality of
a cubic image fragment with a centre in a given slice for fragments of various
sizes. Quality for such a fragment is calculated as the average value from the
quality measures of the slices crossing a given cube perpendicular to the z
axis. Figure Figure 9 shows the results. The z-coordinate of the centre of the inscribed
cube is along the ordinate, and its size is along the abscissa. Colour represents
the quality of a given cube. In fact, we plot a heat map along the z-axis for
each fragment size. The combination of such heat maps in a single drawing enables
the operator to find the optimal position of the fragment in the original 3D
image and at the same time to select its size. For the purpose of simplicity, the
demonstrated approach implies that fragments are selected strictly from the
centre of the slices. It is not difficult to find the optimal location of the
cube in the (xy) plane. In this case, the heat map should display the maximum possible
quality value for the given size and number of the central slice of the cube.
The Plotly library [24] allows to add an interactive view of the
values on the graph (figureFigure 7) and the combined heat map (figureFigure 8).
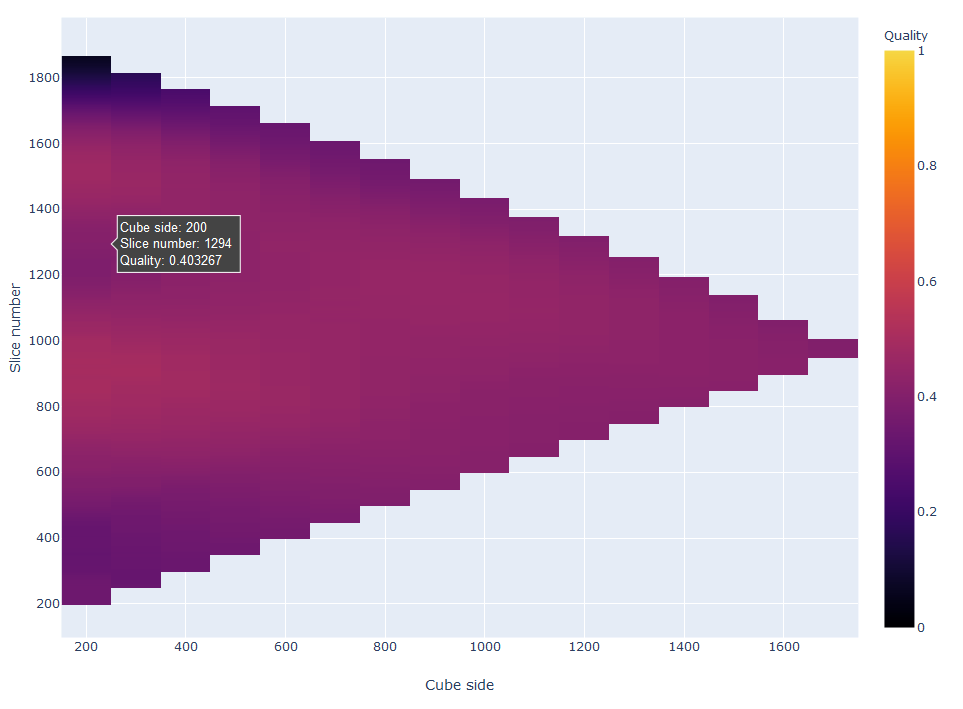
Figure 9. Combined heat map of quality of cubic fragment.
The disadvantage of colour graphs and heatmaps is
that people with various forms of colour vision deficiency may have difficulty analysing
colour information depending on the selected palette. When making colour
graphs, one should avoid not only combinations of red and green, but also green
and brown, yellow and light green, green and blue, blue and grey, blue and
purple, etc. [25, 26] Figure Figure 10 shows
a poor colour combination and what it looks like for people with deuteranopia -
insensitivity to green. The image was obtained using the Color Blindness
Simulator tool [27].
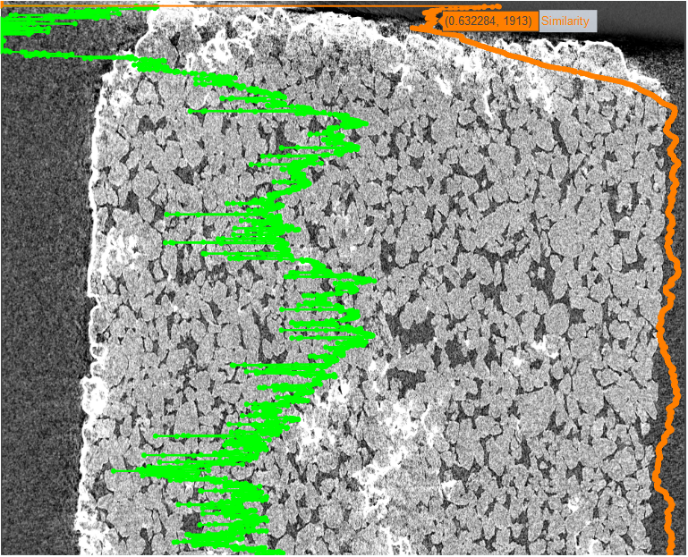
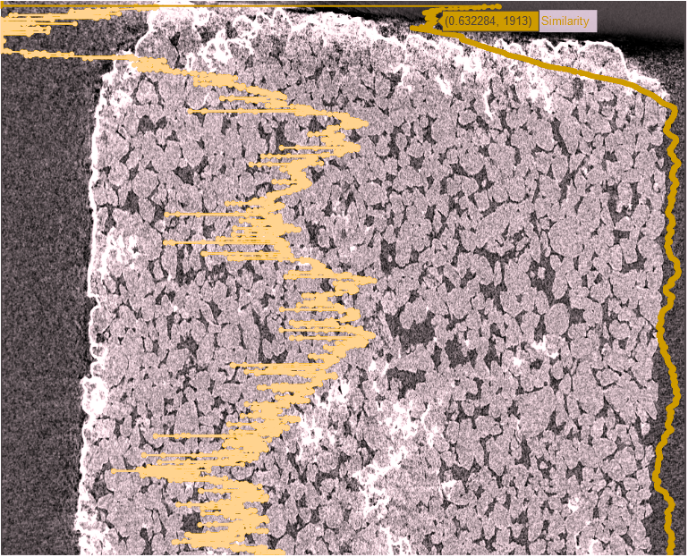
Figure 10. Appearance of colour graphs for people with normal vision (left) and with
deuteranopia (right).
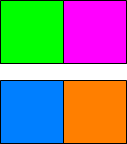
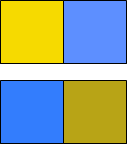
There are much fewer good combinations that would
be suitable for most types of colour perception disorders at the same time.
Such are, for example, green (0, 255, 0) and magenta (255, 0, 255), blue (0,
127, 255) and orange (255, 127, 0) (figureFigure 11)
[29]. In general, different
markers, textures, colours of different intensities are preferable.
|
|
|
|

|
|
a)
|
b)
|
c)
|
d)
|
|
Figure 11. Combinations of green and purple, blue and orange colours, as they
are seen by people with: a) normal vision; b) protanopia; c)
deuteranopia; d) tritanopia.
|
|
In case of heat maps, the most crucial distortion caused
by colour vision deficiency is loss of monotony in the colour palette, when
several completely different numerical values begin to correspond
to one colour. However, even if a palette preserve monotony, in any case, it partially
loses colour contrast over the entire interval or in some areas. If the data are
located mainly in this distorted range, the heatmap may lose information. The
best solution is to check the heatmaps using the colour blindness simulator
and, if necessary, adjust the choice of the colour scale in accordance with the
numerical range of data.
Regardless of colour blindness issue, palettes
with linearly increasing intensity are recommended for building heat maps.
Otherwise, the perception of false gradients is possible, since intensity is
the most important characteristic for human vision. In addition, colour shades should
be perceived equidistant in the colour space (i.e., to be “perceptually
uniform”) [29]. Popular
palettes that satisfy these requirements are, for example, viridis from
the matplotlib library [30], parula
in the Matlab and a set of palettes cmocean designed for oceanographic
applications [31].
With viridis palette, the heat map in figure
Figure 9 had a low colour contrast and became meaningless for some types of colour
blindness. Therefore, we selected the inferno palette from the
matplotlib library, which is also claimed to be “perceptually uniform”. In
general, it preserves content under various distortions, as well as in black
and white, but it turns into shades of the same colour with one of the rarest colour
vision disorders — tritanopia (0.0001% of the population [32]) (Figure 12). A possible solution is to change
the monitor settings, increase the contrast of the image, or automatically rescale
the colour scale for each heat map individually.
|
normal
vision
|

|
|
protanopia
|

|
|
deuteranopia
|

|
|
tritanopia
|

|
|
achromatopsia
|

|
|
Figure 12. Inferno palette as it seen by people with normal vision and with
various types of color vision deficiency.
|
We have investigated the applicability of the five
existing non-reference quality measures for the evaluation of tomographic image
slices. The IL-NIQE criterion coincided with experts’ opinion the most. The probable
reason is that this measure less than others relates to a fixed set of data
distortions used for training, and uses a simpler model, less prone to overfitting.
We have proposed the method to visualize quality
of a three-dimensional tomographic image for the purpose of choosing the best
fragment for subsequent mathematical modelling in the digital rock workflow.
This approach includes demonstration of the cross-section of the image in the
(xz) or (yz) plane and building on it the quality and similarity values for
each slice, where the similarity is calculated using Hellinger distance. We
have also proposed to build a combined heat map of the quality of cubic fragments
with different sizes, inscribed in the original 3D image. Graphs and heat map are
built considering their possible distortions in case of colour perception
disorders. The main requirement when choosing a colour palette was the
preservation of its monotony and information value for various types of colour
vision deficiency. The matplotlib inferno palette is the most compliant with
these requirements.
The disadvantage of the proposed approach is the
inability to consider local artefacts in separate slices of the tomographic
image when choosing the fragment of the best quality. This functional requires
the development of an own algorithm for assessing the quality of analysed
images, capable of detecting artefacts and evaluating quality in a local area.
The development of an algorithm for the detection of specific artefacts of
X-ray microtomography and FIB-SEM images, as well as the visualization of a
spatial map of artefacts in virtual reality, is the subject of our future
research.
1.
Koroteev D. et al. Direct hydrodynamic simulation
of multiphase flow in porous rock. Petrophysics, 2014, vol. 55, № 04, pp.
294-303.
2.
Berg C. F., Lopez O., Berland H. Industrial
applications of digital rock technology. Journal of Petroleum Science and
Engineering, 2017, vol. 157, pp. 131-147.
3.
Buzug T. M. Computed
Tomography: From Photon Statistics to Modern Cone-Beam CT. Springer-Verlag
Berlin Heidelberg, 2008, 522 pp.
4.
Holzer L., Cantoni M. Review of FIB Tomography.
Nanofabrication Using Focused Ion and Electron Beams: Principles and
Applications, edited by I. Utke, S. Moshkalev, P. Rusell, 2012, 752 pp.
5.
Tabassi E., Wilson C. L. A novel approach to
fingerprint image quality. IEEE International Conference on Image Processing
2005, 2005, vol. 2, p. II-37.
6.
SlideNet: Zhang T.
et al. Slidenet: Fast and accurate slide quality assessment based on deep
neural networks. 2018 24th International Conference on Pattern Recognition
(ICPR), 2018, pp. 2314-2319.
7.
Jenadeleh M., Masaeli M. M., Moghaddam M. E.
Blind image quality assessment based on aesthetic and statistical quality-aware
features. Journal of Electronic Imaging, 2017, vol. 26, № 4, pp. 043018.
8.
Pyatykh S., Hesser J., Zheng L. Image noise
level estimation by principal component analysis. IEEE transactions on image
processing, 2013, vol. 22(2), pp. 687-699.
9.
Safonov I. V. et al. Adaptive sharpening of photos. Color Imaging XIII: Processing, Hardcopy, and Applications, 2008, vol. 6807, p. 68070U.
10. Crete F. et al. The blur effect: perception and
estimation with a new no-reference perceptual blur metric. Human vision and
electronic imaging XII, 2007, vol. 6492, p. 64920I.
11. Safonov I. V., Kurilin I. V., Rychagov M.N., Tolstaya
E.V. Adaptive Image Processing Algorithms for Printing. Springer Singapore,
2018. – 304 p.
12. Moorthy A. K., Bovik A. C. A two-step framework
for constructing blind image quality indices. IEEE Signal processing letters,
2010, vol. 17(5), pp. 513-516.
13. Mittal A., Moorthy A. K., Bovik A. C.
No-reference image quality assessment in the spatial domain. IEEE Transactions
on Image Processing, 2012, vol. 21(12), pp. 4695-4708.
14. Sheikh H. R., Sabir M. F., Bovik A. C. A
statistical evaluation of recent full reference image quality assessment
algorithms. IEEE Transactions on image processing, 2006, vol. 15(11), pp.
3440-3451.
15. Ponomarenko N. et al. TID2008-a database for
evaluation of full-reference visual quality assessment metrics. Advances of
Modern Radioelectronics, 2009, vol. 10(4), pp. 30-45.
16. Liu
L. et al. Blind image quality assessment by relative gradient statistics and adaboosting
neural network. Signal Processing: Image Communication, 2016, vol. 40, pp. 1-15.
17. Mittal A., Soundararajan R., Bovik A. C. Making
a “completely blind” image quality analyzer. IEEE Signal Processing Letters,
2013, vol. 20(3), pp. 209-212.
18. Zhang L., Zhang L., Bovik A. C. A
feature-enriched completely blind image quality evaluator. IEEE Transactions on
Image Processing, 2015, vol. 24(8), pp. 2579-2591.
19. Srivastava A. et al. On advances in statistical
modeling of natural images. Journal of mathematical imaging and vision, 2003,
vol. 18(1), pp. 17-33.
20. Ruderman D. L., Bialek W. Statistics of natural
images: Scaling in the woods. Advances in neural information processing
systems. – 1994, pp. 551-558.
21. Mantiuk R. K., Tomaszewska A., Mantiuk R.
Comparison of four subjective methods for image quality assessment. Computer
graphics forum, vol. 31(8), pp. 2478-2491.
22. Avizo web-site
[Online]: https://www.thermofisher.com/ru/ru/
home/industrial/electron-microscopy/electron-microscopy-instruments-workflow-solutions/3d-visualization-analysis-software.html (accessed on 01.03.2019).
23. Hellinger E. Neue begründung der theorie
quadratischer formen von unendlichvielen veränderlichen. Journal für
die reine und angewandte Mathematik, 1909, vol. 136, p. 210-271.
24. Plotly web-site [Online]: https://plot.ly (accessed on 01.03.2019).
25. Rabkin E. B. Polychromaticheskie tablitsy dlya
issledovania tsvetooshushenia [Polychromatic tables for research of colour
perception]. Moscow, 1971, 174 p. [in Russian].
26. Okabe M., Ito K.
Color Universal Design (CUD): How to make figures and presentations that are
friendly to colorblind people [Online]: http://jfly.iam.u-tokyo.ac.jp/color (accessed on 01.03.2019).
27. Daniel Flück.
Color Blindness Simulator [Online]: https://www.color-blindness.com/coblis-color-blindness-simulator (accessed
on 01.03.2019).
28. Nuñez J. R., Anderton C. R., Renslow R. S. Optimizing
colormaps with consideration for color vision deficiency to enable accurate
interpretation of scientific data. PloS one, 2018, vol. 13(7), p. e0199239.
29. Geissbuehler M., Lasser T. How to display data
by color schemes compatible with red-green color perception deficiencies.
Optics express, 2013, vol. 21(8), pp. 9862-9874.
30. Matplotlib web-site
[Online]: https://matplotlib.org/ (accessed on
01.03.2019).
31. Thyng K. M. et al.
True colors of oceanography: Guidelines for effective and accurate colormap
selection. Oceanography, 2016, vol. 29(3), pp. 9-13.
32. Sharpe L. T., Stockman A., Jagle H. and Nathans
J. Opsin Genes, Cone Pigments, Color Vision and Color Blindness. Color vision,
edited by K. R. Gegenfurtner, L. T. Sharpe. Cambridge: Cambridge University
Press, 1999.