THREE-DIMENSIONAL VISUALIZATION FOR PHYLOGENETIC TREE
M. Forghani1, P. Vasev2, V. Averbukh1,2
1 Ural Federal University, Yekaterinburg, Russian Federation;
2 IMM UB RAS, Yekaterinburg, Russian Federation.
majid.forqani@gmail.com, vasev@imm.uran.ru, averbukh@imm.uran.ru
Contents
Abstract
Phylogenetic trees are used to demonstrate the evolutionary relationship between species. Previous researches had indicated there is correlation between mutation and physico-chemical properties changes of amino acid. Considering the physico-chemical changes in protein provides additional viewpoints to study process of mutation. A system VirTree has been designed for visualization of ultrametric phylogenetic trees. The system creates a three dimensional view and also provides a virtual reality presentation. The system clusters objects of phylogenetic tree according to physico-chemical property of amino acid while each leaf has its protein sequence. Tree leaves can also be clustered based on structure of tree and branch in which they are located. Adding a new dimension gives advantage to visualize each cluster independently. The algorithm of clustering uses a metric based on wavelet packet transform and classical multidimensional scaling method. In addition to 2-dimensional and 3-dimensional visualizations, the representation of trees in a virtual reality environment is implemented. The virtual reality is provided through Viewlang system. It allows creating interactive 3D graphical applications running in browsers. The virtual reality can dramatically increase the information content of visualization and provides a wide range of view. This allows seeing the overall picture of tree with details while due to limited size of monitor screen this is difficult for large trees by “traditional” methods of visualization.
Keywords: Ultrametric Phylogenetic Tree, Physico-chemical Property, Scientific Visualization, Virtual Reality, Viewlang
1. Introduction
Proteins are macromolecules that consist of some components, which are covalently joined together and called amino acids. There are 20 standard amino acids that form genetics information [1]. A protein can be considered as a signal. Genomic signal processing is used to analyze the protein sequence and model the biological function. In order to apply genomic signal processing on proteins, an alphabetical sequence is mapped to numerical one. The choice of the numerical mapping affects how its biological properties can be reflected in the numerical domain to reach a goal. Indeed the numerical mapping depends on type of particular application or aim of study.
Amino acid sequence analysis often provides important insights into the tertiary structure and biological function of proteins. Amino acid has several properties that are responsible for the structure and function of protein[2, 3]. The combinations of physico-chemical and biochemical properties of amino acids define the protein structures and functions.
An amino acid index is a numerical vector with 20 elements. It represents a physico-chemical or biochemical property of amino acid (20 numbers for 20 amino acids). Currently about 566 amino acid indices are collected and accessible in Amino Acid index (AAindex) database. This database was first developed by Nakai et al. [4] then extended by Tomii and Kanehisa [2], and it is continuously updated. The database may be accessed through website genome.jp [5] or may be downloaded by anonymous FTP from [6]. Each of 566 amino acid indices gives a viewpoint to study the target biological function.
Study of mutation and evolution of organisms through protein sequence analysis is an important field of study in genetics and biology. Sequence alignments and phylogenetic trees can provide information about the evolutionary history of the proteins that comprise a family [7]. The evolutionary history is achieved based upon similarity and differences in genetic characteristics. Phylogenetic trees represent analytical information for various other biological studies and it is important to have modern tools for their visualization, customization and interpretation [8]. The aim of tree visualization is to display complex evolutionary relationships between species to graphically human-readable presentation. Due to growth of genetics databases, the visualization and customization of phylogenetic tree become difficult especially for large trees
An ultrametric tree is a weighted rooted tree that all of its leaves are at the same depth. Each leaf represents a member of species and is labeled with unique taxon while two nodes can be joined together in the tree by common ancestor. In fact, each branch defines a relationship between its leaves. A rooted phylogenetic tree is a directed tree with a unique node that is most recent ancestor of all leaves [9]. The distance between a node and its ancestor is evolutionary distance and represents how distant the node (taxa) is from its most recent ancestor.
Traditionally, Phylogenetic trees have been represented as two dimensional (flat) diagrams while the difficulties of interpreting of such tree are growing in size and complexity [10]. Trees can be displayed in a number ways, e.g., circular radial, phylogram and dendrogram. There are several tools for drawing phylogenetic trees both online and standalone, e.g. TREEVIEW, PHYLO_WIN, TREECON, FIGTREE, SEEVIEW, iTOL.
The purpose of visualization is to provide a new scientific understanding or viewpoint by visual methods. It allows researchers to better observe the insight of data [11]. To visualize in 3-dimensional, tree is displayed in a circular (radial) mode with additional dimension that makes it 3D. The circular representation is particularly useful for the visualization of mid-sized trees (up to several thousand leaves)[8]. A high-resolution 3D phylogenetic tree can be constructed using parameters such as isoelectric focusing, molecular weight and immuno-cross reactivity or any other relevant attribute of a character or trait that gives discrete phylogenetic relationship [12].
As an example of 3D visualization of phylogenetic tree, 3D Phylogeny Explorer (3DPE) is a phylogeny tree viewer that provides 3D representation of tree. It maps tree onto 3 axes where species are on X-axis, paralogs on Z and Y-axis shows evolutionary distance. It makes the tree visualization more informative for interpretation [8]. In addition to 3DPE, Hughes et al. [13] had had introduced the idea of visualizing phylogenetic trees in three dimensional hyperbolic space with the Walrus graph visualization tool. With Walrus, it becomes possible to visualize and navigate phylogenetic trees with more than 100,000 nodes.
In this paper, a system for 3D visualization of ultrametric tree is presented. The process of tree visualization is explained in more details in the next sections.
2. Proposed Method
There are several studies about relationship of mutation and physico-chemical properties changes. These properties allow researchers to study the biological function from different viewpoints. For example the potential of electron-ion interaction (PEII) correlates with some biological properties of organic molecules such as carcinogenicity, toxicity, antibiotic activity, etc [14]. Other examples are volume and hydrophobicity of amino acids that affect the amino acid substitution during evolution [2]. Therefore it is necessary to add this information to phylogenetic tree to better understand the process of evolution.
Each amino acid of a protein receives an effect from its neighbor amino acids. An issue in mathematical modeling of complex biological system is to consider the effect of neighbors on target amino acid. In other words, it is important which amino acids are in neighborhood of target amino acid position and how they affect it. There are various studies that had investigated neighborhood effects of amino acids [15-19]. Since the protein can be studied from different structures (primary, secondary and tertiary), it is important to capture and study this effect in different structures and levels.
A simple way to extract the information of neighbor effect is using wavelet transform. Wavelet transform is able to decompose a signal into high and low frequency components. It can continue the decomposition on low frequency component while keeps high frequency part of signal in each level. An extension of wavelet transform called wavelet packet transform provides a full decomposition of signal. It decomposes the high frequency part of signal same as low frequency part [20, 21]. In order to apply wavelet packet transform, an alphabetical protein sequence must be converted to numerical. A significant conversion can be done using AAindex indices. Once the numerical conversion is finished, a feature vector should be extracted from the sequence. Wavelet packet sub-band energy is a good candidate for feature extraction. Wavelet packet sub-bands energy has been applied in different applications e.g. DNA sequences classification [22].
The sub-band energy extraction leads to multidimensional representation of protein. To visualize proteins in 3D space, classical multidimensional scaling (CMDS) has been applied. CMDS is a technique that displays the structure of distance-like data as a geometrical representation. It is equivalent to principle component analysis when the input of CMDS is a data set [23]. The input of CMDS is dissimilarity matrix and output is configuration matrix. The correlation distance has been selected as distance measure of CMDS. An example of such visualization and its physico-chemical property are demonstrated in Figure 1.
One way to display a phylogenetic tree is circular (radial) mode that is chosen in the current paper. As mentioned above, an ultrametric tree is a tree in which all leaves have the same distance from root. In usual circular 2D representation, all arc lengths between each two neighbor leaves are equal by default. Adding the information obtained from first dimension of CMDS to the circular 2D representation provides new viewpoint to study the relationship between leaves of tree. It gives a three dimensional circular tree while new additional dimension displays the clustering obtained by CMDS. In general, using a relevant attribute of a character, trait of leaves, such as isoelectric focusing, or even physico-chemical properties may lead to a complex visualization that is not easy to interpret while VirTree decreases the complexity in two ways: first, by considering of neighbor effect, and second, by clustering that is based on similarity taking in account the neighbor effect. This allows bettering visualization of circular tree since the metric algorithm (through wavelet packet) provides a better clustering of leaves. There are some important positions in protein that are sites of interest such as antigenic sites. A remarkable advantage of Virtree is visualization of individual site property with phylogenetic tree. In other words, Virtree is even able to visualize information obtained from a specified protein position in a new dimension.
|
|
|
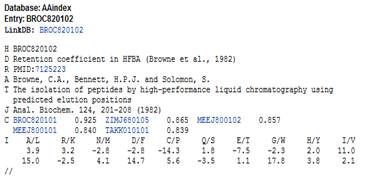
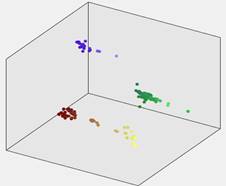
Fig. 1. Left image is an example of AAindex physico-chemical property taken from AAindex database [5]. Right image shows visualization of influenza viruses using amino acid property in left image. The clustering was done by classical multidimensional scaling with correlation distance.
Virtree system is a graphical user interface (GUI) Matlab program that consists of 2D and 3D representations. The 2D plot displays two-dimensional (flat) circular tree while 3D one shows the same tree but with additional dimension (is referred as) Z and has helix shape (see Fig.2). Final 2D and/or 3D customized graphical representation of phylogenetic trees can be saved separately. Phylogenetic trees can be loaded from a file in the standard Newick format. The GUI program does not include alignment or tree reconstruction methods. It is a tool for visualization and provides a graphical representation of ultrametric tree.
In addition to clustering based on physico-chemical properties of amino acids, there is an option to validate clusters in phylogenetic tree based upon “cluster” command for phytree object in Matlab [24]. When clusters are declared, uniform color will be assigned to a cluster automatically. For better visualization of clusters, within-cluster leaves distance can be decreased by ratio and this allows to increase between-clusters distance (see right image in Fig. 2). The compaction ratio controls how within-cluster leaves be close together. Similarly, the compaction also affects the Z distance between and within clusters. There are also additional options to show trunk and labels, control the markers size and select color of markers.
|
|
|
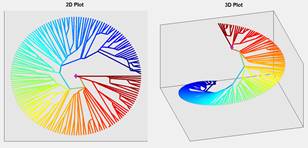
Fig. 2. An ultrametric tree before clustering in 2D and 3D displays on left and after clustering on right. (The tree was taken from study of birds [25-27])
As mentioned ago, circular mode display is particularly useful for the visualization of tree with up to several thousand leaves. Trees with several thousand leaves have very crowded and complex visualization. The speed of zoom in/out of a specific part of tree depends to number of objects located in that part and system hardware. To diminish this dependency, a fast web-based representation has been applied with virtual reality using Viewlang.
Viewlang is 3D visualization framework for web. It allows creating interactive 3D graphical applications running in browsers. Viewlang was created with scientific visualization in mind. Viewlang's key features for developer are:
• QML language for scene description and user interaction.
• WebGL for graphics output.
• Supported browsers include Chrome and Firefox.
QML is a highly attractive language for describing interactive data structures. It is based on JavaScript and extends it with object composition and property binding features. This allows describing complex object networks relatively easy and expressive[28].
WebGL is a standard for graphics in Web. WebGL-based applications may run on desktop, mobile, and VR environments. It provides API for JavaScript codes running in browsers. Viewlang combines QML and WebGL and provides extra types for 3D objects and 2D GUI. Developer writes scene code using QML and publishes scene to browser. Viewlang viewer presents 3D scene in a browser, allowing user to interact with scene and its GUI. An example of Viewlang code and it visualization is presented in Fig. 3.
|
Scene { Param { id: a min: 0; max: 20; value: 5 }
Spheres { positions: [ 0, a.value, Math.sin(a.value) ] color: [a.value/20,1,0] radius: 2 }
Cylinderstrip { color: [0,1,0] positions: { var res = []; for (var i=0; i<a.value; i++) { res = res.concat( [0,i,Math.sin(i)]); } return res; } } } |
|
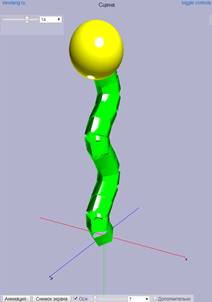
Fig. 3. An example of Viewlang code and resulting presentation. You may copy and run this code in a browser: http://viewlang.ru/code/c.html
The example contains:
1. High-level Scene object (required by Viewlang).
2. Param object with min and max values. A GUI element will be generated by Viewlang at the top-left of the screen. User may interact with it, thus changing value in a program.
3. Spheres object for showing yellow sphere.
4. Cylinderstrip object for showing green set of cylinders.
Note interesting fact: QML automatically recalculates «positions» property of spheres and cylinders when «a» value changes. The «color» of spheres also changes in same manner.
Viewlang viewer has a number of features, including:
• Allowing user navigates in 3D scene, include rotate, zoom and pan.
• Animate scene on given Param objects and write animations to video files.
• Enter VR using WebVR, tested with Oculis Rift and Sony HMZ T1 helmets.
Viewlang was used in a number of projects, for example:
• Visualization of grid geometries from Tecplot files.
• Visualization of computation results on a model of a left ventricle of the heart.
• Visualization of special mathematical graphs, e.g. symmetrical 2-extensions of 3D cubic lattice.
More information about Viewlang is available at [29].
Virtual Reality (VR) environments are actively used to provide leaping into a new quality of cognitive visualization. Virtual environments are characterized by such features as egocentric point-of-views and user-centered often multi-sensory interactions. The VR environments are dynamic, rather than static. The user's experience of the virtual world may combine a visual channel with the auditory or kinesthetic feedbacks. The immersion and sense of presence (feeling of “being there”) are factors which define VR. The sense of presence distinguishes VR from “traditional” 3D Computer Graphics. Users “immersed” in VR control the graphics output. Thus presence and immersion effects are integral parts of VR. The VR loses its most remarkable ability without them. Similar to color and animation, presence and immersion open a new dimension in visualization. The color and animation directly extend the informative aspects of visualization, but presence and immersion create conditions for another perception of information. In scientific visualization, as in applying VR in industrial applications, it must be looked for new ways to not only increase the quality of interpretation, but also to control the visualization processes.
VR provides us with a wider view space than monitor screen that allows user to change some visualization parameters such as the thickness of the tree, tree scaling parameters and the size of the label leaf. In order to see an individual leaf or branch, user just needs to go closer to it by passing through VR environment. That is much more convenient than zoom in /out in 2D format. In this way, VR visualization is more flexible than 2D presentation. It provides a new quality of visualization and enables user to view a general picture while the details are simply visible (see Fig. 4).
|
|
|
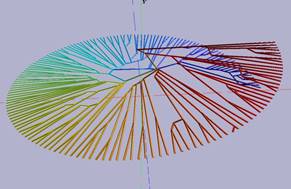
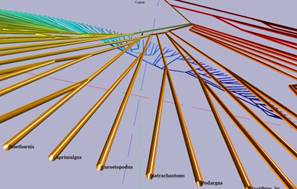
Fig. 4. Virtual reality presentation of circular tree without clustering through Viewlang system calling from Matlab.
3. Conclusion
In summary, Virtree allows user to customize the tree visualization. It supplies 2D and 3D circular tree displays. Moreover, system can validate tree clusters and additional dimension provides better recognition of clusters in plot. The new dimension also makes a distance between leaves labels for easy to read them. In case of protein studies, it provides a clustering that takes in account the neighbor effect. It is able to visualize physico- chemical information obtained from whole, part or individual site of protein. This advantage can be useful for study of antigenic sites. When there is no strong correlation between tree clusters (or branches) and those clusters obtained through classical multidimensional scaling, the 3D representation gives a disarranged structure. However the circular 2D structure of tree is kept. Although construction of clusters is done by classical multidimensional scaling, but K-mean clustering method can also be used for this aim. In order to create a 3D presentation, only one physico-chemical property of amino acid can be used in clustering and visualizing in new dimension. Taking together information obtained from whole indices in AAindex leads to visualization of multidimensional data that is not considered in the current paper. Addition virtual reality capabilities give a wide range of view. Immersion into three-dimensional space and easy navigation in it should provide researchers with more opportunities for studying the structure of trees. In future work, the system will be improved by adding alignment and tree reconstruction modules that allows working with FASTA format and different types of tree (root and unrooted). In addition, the interface in virtual reality will be more interactive that provides tree customization in virtual space directly. In brief, this preliminary study shows that visualization of phylogenetic tree can be improved by adding of new dimension that presents relationship between tree leaves and provides a viewpoint to better study of tree leaves objects.
References
1. Cozzone, A.J., Proteins: Fundamental chemical properties. eLS, 2010.
2. Tomii K., Kanehisa M. Analysis of amino acid indices and mutation matrices for sequence comparison and structure prediction of proteins. Protein Engineering, Design and Selection, 1996. 9(1): p. 27-36.
3. Kawashima S., Kanehisa M. AAindex: amino acid index database. Nucleic acids research, 2000. 28: p. 374-374.
4. Nakai K., Kidera A., Kanehisa M. Cluster analysis of amino acid indices for prediction of protein structure and function. Protein Engineering, Design and Selection, 1988. 2(2): p. 93-100.
5. http://www.genome.jp/aaindex/.
6. ftp://ftp.genome.jp/pub/db/community/aaindex/.
7. Zhai Y., Tchieu J., Saier Jr M.H. A web-based Tree View (TV) program for the visualization of phylogenetic trees. Journal of molecular microbiology and biotechnology, 2002. 4(1): p. 69-70.
8. Letunic I., Bork P. Interactive Tree Of Life (iTOL): an online tool for phylogenetic tree display and annotation. Bioinformatics, 2006. 23(1): p. 127-128.
9. Huson D.H., Scornavacca C. Dendroscope 3: an interactive tool for rooted phylogenetic trees and networks. Systematic biology, 2012. 61(6): p. 1061-1067.
10. Kim N., Lee C. Three-Dimensional Phylogeny Explorer: Distinguishing paralogs, lateral transfer, and violation of" molecular clock" assumption with 3D visualization. BMC bioinformatics, 2007. 8(1): p. 213.
11. Rhyne T.-M. Does the difference between information and scientific visualization really matter? IEEE Computer Graphics and Applications, 2003. 23(3): p. 6-8.
12. Milner M., et al., Constructing 3D phylogenetic trees. Current Science, 2003: p. 1471-1478.
13. Hughes T., Hyun Y., Liberles D.A. Visualising very large phylogenetic trees in three-dimensional hyperbolic space. BMC bioinformatics, 2004. 5(1): p. 48.
14. Veljkovic V., Cosic I., Lalovic D. Is it possible to analyze DNA and protein sequences by the methods of digital signal processing? IEEE Transactions on Biomedical Engineering, 1985(5): p. 337-341.
15. Xia X., Xie Z. Protein structure, neighbor effect, and a new index of amino acid dissimilarities. Molecular biology and evolution, 2002. 19(1): p. 58-67.
16. Fu M., et al., Neighbor preferences of amino acids and context-dependent effects of amino acid substitutions in human, mouse, and dog. International journal of molecular sciences, 2014. 15(9): p. 15963-15980.
17. Petersen M.T.N., Jonson P.H., Petersen S.B. Amino acid neighbours and detailed conformational analysis of cysteines in proteins. Protein engineering, 1999. 12(7): p. 535-548.
18. Kabat E.A., Wu T. The influence of nearest-neighbor amino acids on the conformation of the middle amino acid in proteins: comparison of predicted and experimental determination of β-sheets in concanavalin A. Proceedings of the National Academy of Sciences, 1973. 70(5): p. 1473-1477.
19. Ghadimi M., Khalifeh K., Heshmati E. Neighbor effect and local conformation in protein structures. Amino Acids, 2017. 49(9): p. 1641-1646.
20. Mallat S., A wavelet tour of signal processing. 1999: Academic press.
21. Ruch D.K., Van Fleet P.J. Wavelet theory: an elementary approach with applications. 2011: John Wiley & Sons.
22. Zhao J., et al. DNA sequences classification based on wavelet packet analysis, in Wavelet Analysis and Its Applications. 2001, Springer. p. 424-429.
23. Wang J. Geometric structure of high-dimensional data and dimensionality reduction. 2011: Springer.
24. https://www.mathworks.com/help/bioinfo/ref/clusterphytree.html.
25. Braun E.L., et al., Homoplastic microinversions and the avian tree of life. BMC evolutionary biology, 2011. 11(1): p. 141.
26. Hackett S.J., et al., A phylogenomic study of birds reveals their evolutionary history. science, 2008. 320(5884): p. 1763-1768.
27. Han K.-L., et al., Are transposable element insertions homoplasy free?: an examination using the avian tree of life. Systematic biology, 2011. 60(3): p. 375-386.
28. Vasev P. Three-dimensional visualization in a web based environment based on Qml declarative description. International (47th all-Russian) youth school-conference, Yekaterinburg, January 31-January 31 - February 6, 2016.
29. http://viewlang.ru.
ТРЕХМЕРНАЯ ВИЗУАЛИЗАЦИЯ ФИЛОГЕНЕТИЧЕСКИХ ДЕРЕВЬЕВ
М.А. Форгани1, П.А.Васёв2, В.Л. Авербух1,2
1Уральский федеральный университет, Екатеринбург, Россия
2Институт математики и механики имени Н.Н. Красовского УрО РАН, Екатеринбург, Россия
majid.forqani@gmail.com, vasev@imm.uran.ru, averbukh@imm.uran.ru
Аннотация
Филогенетические деревья используются для демонстрации эволюционной взаимосвязи между видами. Предыдущие исследования показали, что существует корреляция между мутациями и изменениями физико-химических свойств аминокислот. Рассмотрение физико-химических изменений белка дает дополнительные точки зрения на изучение процесса мутации. Система VirTree была разработана для визуализации ультраметрических филогенетических деревьев. Система создает трехмерное представление деревьев, а кроме того обеспечивает представление в среде виртуальной реальности. Система кластеризует объекты филогенетического дерева на основе физико-химических свойств аминокислоты, в то время как каждый лист имеет свою последовательность белка. Листья данного дерева также могут быть кластеризованы на основе структуры дерева и ветви, в которой они расположены. Добавление новой мерности дает возможность визуализировать каждый кластер индивидуально. Алгоритм кластеризации использует метрику на основе преобразования вейвлет-пакетов и метода классического многомерного шкалирования. В дополнение к двух- и трёхмерным визуализациям реализовано представление деревьев в среде виртуальной реальности. Средства виртуальной реальности предоставляются через посредство системы Viewlang. Она позволяет создавать интерактивные трёхмерные графические приложения, работающие в браузерах. Виртуальная реальность значительно увеличивает информативность визуализации и обеспечивает широкий спектр обзора. Это позволяет увидеть общую картину больших деревьев с деталями, что затруднительно в случае «традиционных» методов визуализации из-за ограниченного размера экрана монитора.
Ключевые слова: ультраметрическое филогенетичсекое дерево, физико-химические свойства, научная визуализация, виртуальная реальность, Viewlang