SPECIAL OPTICAL FIBER PREFORM LAYERS 3D-RECONSTRUCTION
Yu.A. Konstantinov2, K.P. Latkin1,2, F.L. Barkov1,2, A.S. Smirnov1,2, M.M. Poskrebyshev4, V.P. Pervadchuk1, D.B. Vladimirova1, Yu. A. Konin2,3, A.I. Garanin1,2,3, V.V. Burdin1,2
1Perm National Research Polytechnic University, Perm, Russian Federation;
2Photonics Lab of Perm Federal Research Centre of Urals Branch of Russian Academy of Science, Perm, Russian Federation;
3Perm Scientific-Industrial Instrument Making Company, Perm, Russian Federation;
4Inversion Sensor Company, Perm, Russian Federation.
Contents
2. Preform outer diameter control
3. Erbium ions location data acquisition
5. The usage of holographic methods for preform investigation
Abstract
In this paper we review several techniques to perform 3D-analysis and data visualization of various layers in the special fiber preforms. The special fiber manufacturing process is of high complexity and cost. Thus, the analysis of preforms before the process of their drawing into fiber is necessary for a quality control of the product obtained.
The first technique is outer diameter control during preform manufacturing. The wavelet analysis software is implemented in order to reduce noise component.
The next one is the system to analyze erbium ions concentration in active fiber perform core. It should be noticed, that in this technique the invisible layers are measured due to control of their luminescence at 1530 nm, when pumped at 978 nm. Thus, the obtained luminescence power of these layers is proportional to the concentration of the luminescent element, which makes it possible to obtain a detailed distribution of this parameter over different coordinates. Using described methods, we developed and constructed computer-aided computer vision system used in preform manufacturing process.
The next technique, holography, is more universal. It helps to estimate spatial distribution of various preform characteristics. The photography matrix is used there as a hologram medium. This method is implemented as an experimental installation, and its significant modification is expected in the nearest future.
Also we undertook the first attempts to study the geometry of the fiber perform channels by the methods of white light interferometry. The article describes the basic approach to solve the problem and outlines the main directions for further work in this field of study.
Since all the proposed techniques are non-destructive for glass structure, they can be used during manufacturing process in addition to standard techniques. It is noted that the developed elements of the data acquisition system make it possible to obtain information sufficient for 3D-reconstruction of the geometric parameters of all the key structural elements of various types optical fiber preforms. In conclusion we suggest the idea of complex visualization system combining considered techniques.
Keyworlds: 3D-reconstruction, optical fibre preforms, on-line measurements and visualization
1. Introduction
The optical fibers are widely used in telecommunications, sensor systems and other areas of science and technology [4,6]. Usually silica glass optical fibers are manufactured from fiber preforms that may be produced using several well-known techniques (MCVD – Method of Chemical Vapor Deposition, VAD – Vapor Axial Deposition, OVD – Outside Vapor Deposition and their modifications) [7]. Then the preform usually passes the stage of mechanical processing and after that it should be drawn at the fiber draw tower [3]. The manufacturing technology of standard telecommunication fibers is well understood and controllable, but there is still significant scope for improved fabrication of non-conventional fibers designed for optoelectronical circuits. In the case of active fiber, the technological process has the following differences [1]. During the chemical vapor deposition the preform core is doped not only by the germanium oxide, but also by the erbium oxide to achieve the luminescence in the fiber at the wavelength of 1550 nm. In the case of polarization-maintaining (PM) fiber, after the deposition, the preform goes to the stage of air-channel drilling (air-channels are used for the insertion of the stressrods that will cause the birefringence in the fiber). The major parameters under control are: outer preform diameter at the stage of MCVD process during the deposition (including deflection control) and outer surface 3D-geometry; erbium dopant 3D-distribution along the preform length; air channels 3D-geometry. The glass refractive index depends mainly on concentration of germanium, therefore, erbium concentration cannot be measured using optical techniques. The spatial 3D-distribution of refractive index along the preform as well as in cross section is also important, but at present it is successfully controlled by the conventional instruments.
2. Preform outer diameter control
The first technological stage that we are going to discuss is outer diameter control and preform 3D-reconstruction.
The MCVD process requires the stability of the quartz tube temperature (the tube that will become a part of fiber optic preform) in the heating zone by changing the flow rate of hydrogen in the burner. This flow rate is adjusted according to the readings of the optical pyrometer. The level of doping of the precipitate varies according to the program given by adjusting the supply of reagent vapors to the reaction zone. Many years’ experience of utilization of this process revealed the need for continuous monitoring of the outer diameter of the pipe during the deposition process and especially when the tube is collapsing. It should be noted that a considerable time of the deposition process (several hours) leads to the evaporation of quartz from the outer surface of the pipe and reduces its diameter.
Collapse of the tube (transformation into the preform) is usually carried out in several passes, during each of them the outer diameter of the pipe should be changed by a certain value. The need to impose strict limitations on the deviation of the tube from cylindrical shape (no more than 5% of the nominal diameter) also requires continuous monitoring of its geometry. Until now, the control of the tube dimensions has been performed visually by the operator with use of the 173 mm working distance microscope. Under the strong thermal radiation from the tube, this technique did not provide the required accuracy and stability of the technological process. Measuring the preform diameter by contact methods is also excluded since any measuring instrument can damage the heated rotating preform. Moreover, not all the MCVD lathe in the basic configuration are equipped with a system for contactless measurement of the preform outer diameter, therefore manufacturers of fiber-optic light-guides are forced to find their own technical solutions.
In line with the above, a technique for non-contact measurement of the geometric characteristics of cylindrical preforms was developed by usage of a megapixel CCTV camera with the interface USB 2.0 VEC 545 (LLC "EVS", St. Petersburg) and our own software (Fig. 1).
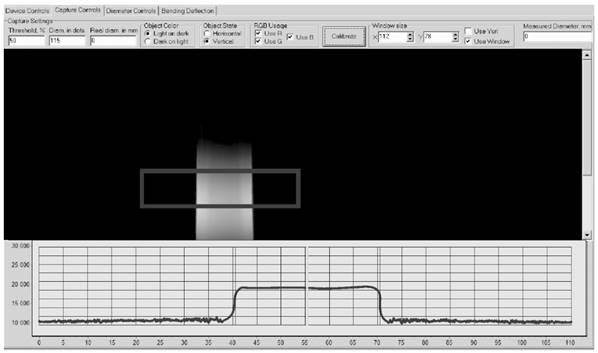
Fig. 1. Developed MCVD preform geometry control software [5]
To enlarge the image obtained from the camcorder, the Computar TG10Z0513FC-2 lens with a four-fold gray protective filter is used. The video camera is mounted on the bracket of the pyrometer of the MCVD lathe. The software supplied with the camera does not provide any information processing; for this purpose, a special own utility has been developed. The developed software has a user-friendly interface. The user has an access to the video image settings directly in the program, without having to run driver's user interface, and select the area under investigation, which greatly simplifies and speeds up the calculations. At the user’s request, the spatial orientation of the sample can be changed, the filtering on the RGB color components or the image inversion can also be turned on or off.
The software allows the use of threshold and correlation algorithms to determine the diameter of the preform. At a constant burner temperature and stable lighting conditions, it is appropriate to use the threshold algorithm:
![]() ,
, ![]() ,
,
where ![]() is
the image data array describing the variation of brightness;
is
the image data array describing the variation of brightness; ![]() and
and ![]() are
the lowest and the highest threshold values. The differences in brightness in
both horizontal and vertical dimensions can be written as
are
the lowest and the highest threshold values. The differences in brightness in
both horizontal and vertical dimensions can be written as
![]() ,
,
![]() ,
,
where ![]() is a
raw image data array (single frame) and
is a
raw image data array (single frame) and ![]() is a
differential calculation step. In the case of dramatic temperature changes the
correlation algorithm could be applied:
is a
differential calculation step. In the case of dramatic temperature changes the
correlation algorithm could be applied:
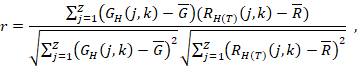
where ![]() is a cross-correlation value of
is a cross-correlation value of ![]() image
and
image
and ![]() reference
image saved at preform temperature
reference
image saved at preform temperature ![]() ;
; ![]() and
and ![]() are
their mean values over j. All these techniques enable on-line geometry
control during the MCVD-process. The next stage is off-line 3D-reconstrucion of
preform geometry. Due to the high noise level during the MCVD process the
received data should be filtered. We used the Discrete Wavelet Transform (DWT)
package for this purpose.
are
their mean values over j. All these techniques enable on-line geometry
control during the MCVD-process. The next stage is off-line 3D-reconstrucion of
preform geometry. Due to the high noise level during the MCVD process the
received data should be filtered. We used the Discrete Wavelet Transform (DWT)
package for this purpose.
At the first stage of the analysis, the initial processing is performed over the available time series (after the MCVD stage the preform raw geometry parameters are presented as Preform Center and Preform Diameter), the methods of which include the graphical representation of the initial series in the time domain, as well as the elimination of the trend of the series. In the simplest case, this is the elimination of the constant term (centering the series). Next, the rows are processed using a continuous wavelet transform with the parent Daubechies wavelet of orders 1-10. As a result, we obtain the scalings of the wavelet coefficients of expansion and the lines of the local maxima so-called skeleton transformations. It is known that if the data contain harmonic or quasi-harmonic components, the topographic map of the skeleton will consist of lines oriented along the vertical scale axis. In the case of a noise component, the skeleton lines are stretched in a perpendicular direction, i.e. parallel to the horizontal time axis. Thus, visually estimating the skeleton lines, even at the first stage of the study, it is possible to select highly noisy signals (Fig. 2). Batch data processing on the basis of the MatLab platform, WaveletToolbox, was used.
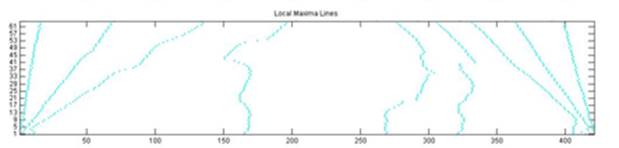
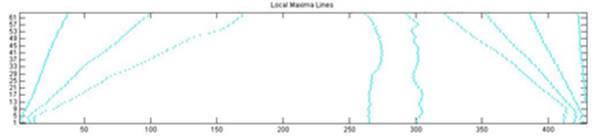
Fig. 2. Skeleton Image of the noised data (upper figure) and that of the data containing no noise (lower figure)
The second stage of the study is the identification of the noise components of the signal. Let the signal model have the form of an algebraic sum s(t) = f(t) + σe(t), where f(t) – desired signal, e(t) – noise, σ – noise amplitude, s(t) – signal under test.
Standard SoftThresholding procedure corresponds to the wavelet coefficients transformation of the following form:
![]()
where λ is a predefined treshhold value. Thus, before performing the inverse wavelet transform, wavelet coefficients with absolute value below certain cut-off level are set to zero.
As a parent wavelet in the construction of a wavelet filter, wavelet functions with a compact support, such as Daubechy wavelets, Coiflets and Symlets are usually considered. Coiflets are special case of Daubechies wavelets with vanishing moments of scaling function.
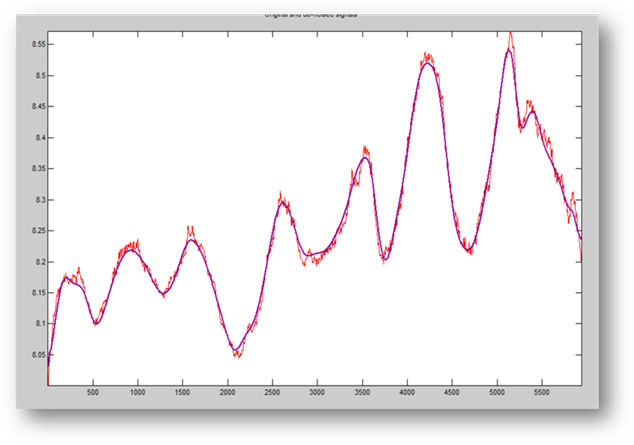
Fig. 3. Raw signal (red color) and denoised signal (blue one) using Coiflets
The figure above demonstrates the effect of noise reduction. A filter with small scales corresponding to the lower part of the spectrum separates high-frequency components from the signal, which usually correspond to extraneous noise. Changing the scale, one can achieve complete suppression of high-frequency noise.
At the same time, however, there is a risk of distortion of
the desired signal. In practice, it is more convenient to choose the scale
after the transformation, by calculating the wavelet spectrum in a sufficiently
wide range of scales. Then the necessary scales are selected on the spectrum
map, and the inverse wavelet transform is produced. It should be noted that one
can select two or more bands of the spectrum, not limited to only one area.
This technique allows to calculate the frequencies at which the noise
components appear and to identify the nature of noise. There is a certain
relationship, though not obvious at first glance, between the concept of
Fourier harmonics and the scale of the wavelet. The main point in this
relationship is the inverse proportionality of the own frequency and scale,
weighted by some conversion factor: ![]() ,
where
,
where ![]() - own frequency, a – scaling
coefficient.
- own frequency, a – scaling
coefficient.
At present it is clearly seen that it is possible to build the preform 3D-surface reconstruction after performing all steps (see figure 4). It is a very useful option in the case of the MCVD process automation, but it is not applicable as a quality test technique, because after the wavelet noise reduction the surface has non-uniformities tens or hundreds times bigger than they really are.
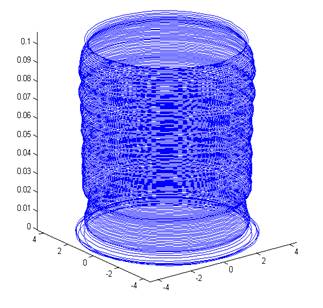
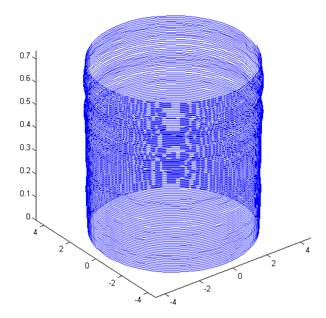
Fig. 4. 3D-surface reconstruction using raw signal (upper figure) and denoised signal using Coiflets (lower figure)
For the precise 3D-image (we shall talk about this in the final part of this article) we suggest to use the data from standard preform analyzer not related to the preform fabrication process.
The obvious drawback of the method of using a standard preform analyzer is a small sampling of the preform length coordinate. Long-term measurements are possible, but this is not always convenient for some applications; therefore, we recommend using both data from the lathe sensors and those obtained in the laboratory on standard equipment to construct a 3-D surface. Later in this article, we are also considering one more possible method – holography.
3. Erbium ions location data acquisition
The measurement is carried out using a pumping diode with a wavelength of 978 nm (near the erbium pumping wavelength), which illuminates the core of the preform from the side, and an integrated receiver with a quartz filter that passes only the luminescence band. The filter is located perpendicularly to the rays of the radiation source, which makes possible reducing the influence of the pump diode radiation on the results obtained. The erbium concentration, in this case, is directly proportional to the receiver's voltage. The results of a test preform measurement is presented below (Fig. 5) Thus, the basis of measurement is the luminescent properties of a material in the glass structure. Using this effect we have constructed an instrument ErGO-1 (Fig. 6), Erbium Grand Observer, model 1. It consists of precise optomechanics and electronic components that allow full radial scan of the preform. ErGO software is the managing application, that controls the positioning motor's and pump diode's drivers as well as ADC and other instrument units. It allows to obtain the comprehensive amount of data that could be used for the further visualization of erbium oxide distribution via every avaliable method (from MathLAB and Excel to GL Scene and other libraries and programs).
It is clearly seen that by changing the angle of investigation we can obtain the 3D-reconstruction of erbium dopant location in the preform. It is useful in the case of Large Mode Area (LMA) fibers.
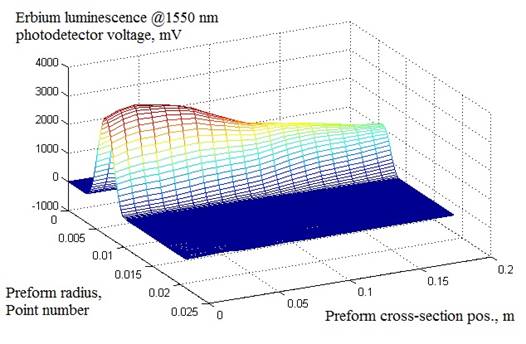
Fig. 5. Developed ErGO-1 analyzer data
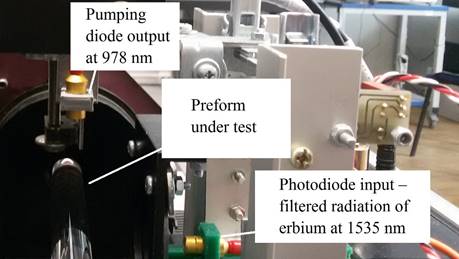
Fig. 6. Analyzer’s opened case
4. Air channels investigation
Air channels geometry is a very important thing which is needed to achieve the constant birefringence of the fiber along its length [2]. The main bottleneck is that contact measurements are not allowed as well as immersion of the preform into liquids. Here we present a non-contact technique that consists of the usage of the special fiber sensor inside the air channel. The fiber tip should be curved in a special way: its bending loss should not have strong influence on the signal attenuation, but it has to be placed perpendicularly to the air channel surface.
We have used a test sample to make a simple method demonstration. A short piece of preform with the drilled channels was mounted on nanopositioning stage, the sensor fiber which was connected with the IR-source and receiver via fiber coupler, is designed to measure the back-reflection optical power from the air channel surface.
After the first experiments we have found out that the amplitude back-reflection sensor does not have the expected performance. This is why we have transformed it into the interferometric scheme by adding the reference mirror with the adjustment microstage. We will report about the applicability of this setup as soon as comprehensive tests are performed.
5. The usage of holographic methods for preform investigation
The methods of holography are not yet widely spread in the field of optical fiber preform geometry properties study, but we think in future it can be applied for rapid analysis.
The process of digital reconstruction of holograms consists of calculating the backward propagation of light from the hologram to the reconstruction plane. The reconstruction process could be described by a finite discrete form of the Fresnel approximation for the integration of diffraction:
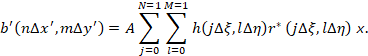
![]()
The parameters used in this formula to calculate the complex number in the image plane are given by a CCD matrix having an N × M pixel size and a pixel pitch Δξ and Δη in two orthogonal directions. The hologram is stored in array h (jΔξ, lΔη). The distance between the object and the CCD matrix is denoted by d, and as a rule d'= d. The complex coefficients do not depend on the hologram in question, they are contained in the data of the CCD-describing matrix.
Reconstructed image displays restoration of sharpness and borders of the smallest details.
As a test sample we have placed the preform with drilled air channels into the developed instrument. In the figure 7 we can observe the non-uniformities in silica as well as core and channels borders.
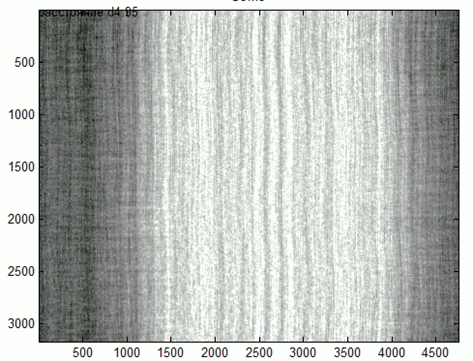
Fig. 7. Holographic image of the preform
The reason for use of the technique described is to distinguish the non-uniformities that conventional preform analyzer cannot locate (for example, air bubble could be missed if its location does not coincide with the cross-section under test). After locating the non-uniformity, the nearby area could be investigated more precisely using preform analyzer. Also, we suppose it is possible to find some correlation with refractive index (RI) of the preform layers.
6. Conclusion
As a conclusion we would like to join all the data obtained from described stages and decide if they are enough to build the full 3D-distribution of all optical and geometrical parameters. As we mentioned above the data from MCVD stage is not applicable for this purpose, so this could be taken only as a draft, and at the final stage we need to substitute this by data received with preform profile analyzer. The only thing we have to take from the developed MCVD measurement system is preform deflection (at present this option is not included into conventional preform analyzers). So this method is rather useful as well as holographic method. Rare-Earth ions location setup has been developed and constructed and it gives the full information about erbium 3D-spatial distribution. The method of the air channel investigation is still being developed. It will be discussed in the future publications. The idea of joining all these data is shown below (Fig. 8).
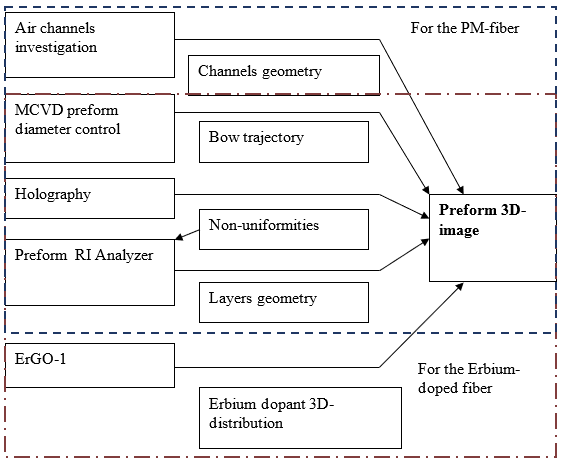
Fig. 8. The idea of preform 3D-image construction
There are a lot of well-known methods for 3D-visualization. The choice depends on the current application. If it is designed for the lab test we suggest to use MatLAB built-in function. Also, it is possible to use scaled bitmap sequence to show the parameters changes at every single cross-section (Fig. 9).
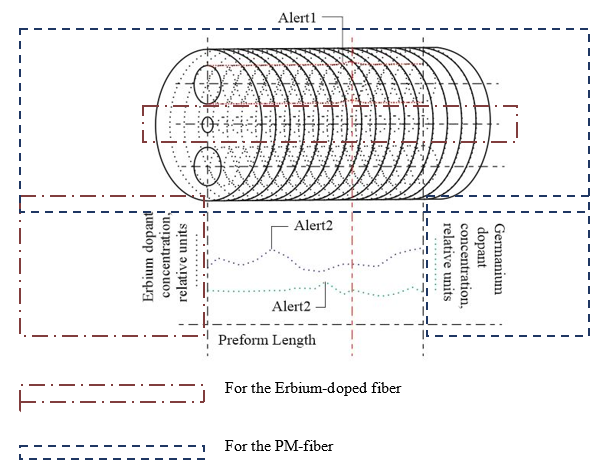
Fig. 9. An example of preform visualization
At present the described approach is not universal, it has narrow application range in the field of special optical fibers (erbium doped fibers, panda-type fibers), and it is recommended to use this in combination with other techniques. Our set-ups allow to get information about the erbium oxide distribution inside the fiber preform, preform outer diameter during its fabrication process, the stress-rods geometry investigation set-up is now at the developing stage. The world-known firms like Photon Kinetics produce preform investigation instruments, but their comparison with our schemes is not reasonable due to the different kinds of data they allow to obtain. For the detailed studies we recommend to use them both. According to our information, we described in literature the feature of the erbium oxide distribution investigation in optical fiber preforms for the first time.
7. Acknowlegment
We thank Perm Scientific-Industrial Instrument Making Company for providing samples for tests as well as G.K. Shakirova and A.R. Khlopin for very helpful assistance.
References
1. Dhar A. et al. The mechanism of rare earth incorporation in solution doping process. Opt. Express 16 (17). 12835 (2008).
2. Carter A.; Samson B. PANDA-style fibers move beyond telecom. Laser Focus World. August, 2004.
3. Just F. et. al. The influence of the fiber drawing process on intrinsic stress and the resulting birefringence optimization of PM fibers. Optical Materials. vol. 42, April 2015, p. 345-350.
4. Keiser G. et. al. Review of diverse optical fibers used in biomedical research and clinical practice. J Biomed Opt. 2014 Aug;19(8):080902.
5. Konstantinov Yu.A., Poskrebyshev M.M.., Kharlamova N.A., Kryukov I.I. Television measurement system of optical fibre preforms dimensions during the process of chemical vapour deposition. St. Petersburg Polytechnic University Journal of Engineering Science and Technology. 2011, #6-2(138) [in Russian].
6. Lee B. Review of the present status of optical fiber sensors. Optical Fiber Technology. vol. 9, Issue 2, April 2003, p. 57-79.
7. Nagel S. et al. An overview of the modified chemical vapor deposition (MCVD) process and performance. IEEE J. Quantum Electron. 18 (4), 459 (1982).
ТРЕХМЕРНОЕ ВОССТАНОВЛЕНИЕ СЛОЁВ В ЗАГОТОВКЕ СПЕЦИАЛЬНОГО ВОЛОКОННОГО СВЕТОВОДА
Ю.А. Константинов2, К.П. Латкин1,2, Ф.Л. Барков1,2, А.С. Смирнов1,2, М.М. Поскребышев4, В.П. Первадчук1, Д.Б. Владимирова1, Ю.А. Конин2,3, А.И. Гаранин1,2,3, В.В. Бурдин1,2
1Пермский национальный исследовательский политехнический университет, Пермь, Россия;
2Лаборатория фотоники Пермского федерального исследовательского центра Уральского отделения Российской академии наук, Пермь, Россия;
3Пермская научно-производственная приборостроительная компания, Пермь, Россия;
4Инверсия-Сенсор, Пермь, Россия.
Аннотация
В данной статье проводится обзор комплекса методик, предложенных для реализации 3D анализа и последующей визуализации данных о различных слоях заготовок специальных волоконных световодов. Проблема, решаемая данной системой, существует на производстве и связана с его высокой сложностью и стоимостью.
Первой была предложена методика контроля внешнего диаметра заготовки в процессе её производства. Отметим, что здесь используется вейвлет анализ на уровне ПО для избавления от неизбежно возникающих шумовых компонент.
Следующей представлена система анализа концентрации ионов эрбия в сердцевине заготовки активного волокна. Данная методика примечательна тем, что предметом исследования являются неразличимые человеческим глазом и стандартными системами машинного зрения стеклянные слои, и использует эффект люминесценции активных ионов эрбия на длине волны 1530 нм при облучении светом с центральной длиной волны 978 нм. Таким образом, получаемая мощность излучения люминесценции этих слоёв связана с концентрацией люминесцирующего элемента, что дает возможность получить подробное распределение этой величины по различным координатам. На основе описанных методов авторы разработали и сконструировали автоматизированную систему машинного зрения, применяющиеся в условиях производства.
Следующая методика, голография, более универсальна – с ее помощью удаётся восстановить распределение различных параметров внутренних слоёв различных типов заготовок. В данном методе как голографирующая среда используется матрица фотоаппарата. Данный метод реализован в качестве макетной установки, и в ближайшее время ожидается его существенная модификация.
Также авторы предприняли первые попытки исследования геометрии каналов заготовки волоконного световода методами белосветной интерферометрии. В статье описан базовый подход к решению проблемы и обозначены главные направления дальнейших работ в данной области.
Все предложенные способы контроля являются неразрушающими, что даёт возможность использовать их в процессе производства, дополняя данные, полученные в рамках штатных измерений. Отмечается, что разработанные элементы системы сбора данных позволяют получить информацию, достаточную для 3D-восстановления геометрических параметров всех ключевых конструктивных элементов заготовок волоконных световодов разных типов. В конце статьи предлагается концепция системы комплексной визуализации заготовок посредством настоящих методик.
Ключевые слова: 3D-восстановление, заготовки оптического волокна, измерения и визуализация в процессе производства