ON SOME ASPECTS OF INTEGRATED MULTISPECTRAL SINGLE-LAYER IMAGING ARRAYS AND THEIR APPLICATION FOR IMAGE FUSION
M. Smagin
Joint-Stock Company MNITI
Email: smagin@mniti.ru
Contents
3. Source images, algorithms and software
4. The intention of the experiment
4.1. Position of the Demosaic Operation within the Fusion Algorithm
4.2. Spatial arrangement of sensors in the imaging array
5. The description of the experiment
Abstract
Modern advancements in electronics and physics have created the opportunity to develop new types of multispectral image sensors with single or multiple sensitive layers. The distinctive feature of single-layer imaging arrays is the arrangement of its elements (sensible in different spectral bands) in a single plane that form a united array organized as a mosaic. Practical application of such imaging arrays for image fusion allows us to gain some important advantages, but it also requires the modification of fusion algorithms by adding the demosaic operation into the sequence of operations. It also creates the need to determine the proper spatial arrangement of sensible elements in the single-layer array, which allows the achievement of the best results, i.e. the most informative fused images.
The following article describes the result of a case study focused on the task to determine the robustness of several well-known image fusion algorithms (PCA, DWT and Laplacian Pyramid) to mosaic images and different types of spatial arrangements of sensors in multispectral image acquisition arrays. Several couples of source images (obtained in different spectral bands) were used to test the performance of the abovementioned algorithms on mosaicked images in order to find the most effective position of the demosaic operation in the sequence of operations in the tested algorithms.
Keywords:
1. Introduction
In the present article, the term “multiband surveillance system” is used to represent the image acquisition systems (equipped with several image sensors) that work in such a way, that the acquired images are being presented to the human operator concurrently and simultaneously in order to increase his or her situational awareness. The image sensors are sensible in different spectral bands. The images can be displayed on different independent monitors but nowadays the operation of image fusion is growing in use. The image fusion can be described as a process of combining information from multiple images to generate a single image that contains a more accurate description of the scene than any of the individual source images and is also more suitable for human or machine processing [1], [2].
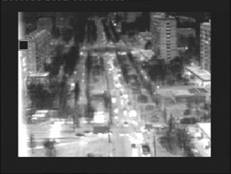
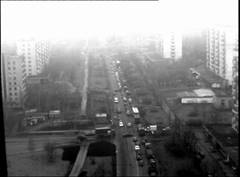
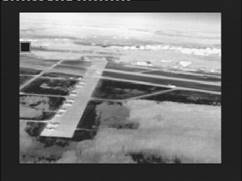
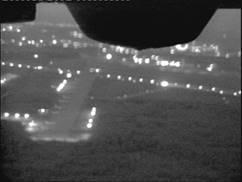
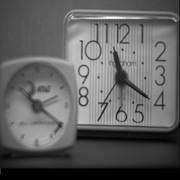
The example of fusion operation performed on visible and thermal infrared source images is presented in Fig. 1 and 2.
|
Thermal Image |
Visible image |

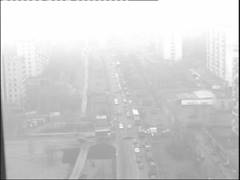
Fig. 1. Example of source images used for fusion
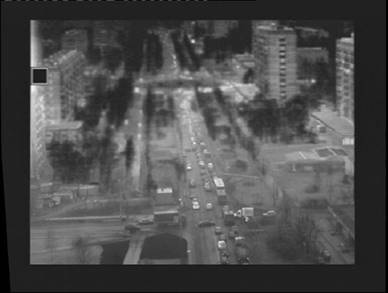
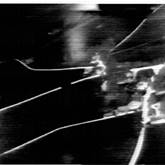
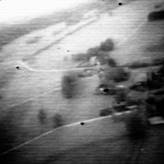
Fig. 2 Example of the obtained fused image
The analysis of modern multiband surveillance systems shows some interesting trends. The most attractive of them are:
· the application of new types of image acquisition devices that are based on newly invented sensible materials [3] – [5];
· the integration of image sensors with different spectral bands into integrated imaging devices with single multispectral imaging array [6], [7].
These trends are interrelated because new sensible materials with advanced features (e.g. wideband sensibility) or better manufacturing capabilities (e.g. fabrication with printed methods instead of photolithography) allow us to build new types of imaging devices.
These devices can be divided into two main groups according to their structure – single- and multilayer devices. Multilayer devices are designed as three-dimensional structures, which consist of several vertically stacked sensible layers with different absorption bands. Single layer devices (as it can be seen by their name) have only one sensible layer, which consists of pixel elements with different spectral absorption capabilities arranged in horizontal plane as a mosaic.
There are also some devices, that can be called “hybrid”, like the one described in [8], but they do not play significant role en masse.
The first ones are not so widely used, mostly due to their manufacturing complexity. Besides, a large number of engineering solutions that are required for the effective operation of these devises is the intellectual property of Foveon Inc.
The latter ones, on the contrary, attract much more interest. This is according to the number of recently published papers.
The usage of integrated imaging devices in multiband surveillance systems gives a lot of new opportunities but also brings some new challenges. Compared to the common multiband surveillance systems, which often have different image acquisition devices for each spectral band with separate chassis, optics etc. [9], [10], the usage of integrated imaging devices allows the decrease of weight and size of surveillance system. It also allows the avoidance of many problems related to the misalignment of optical axis and the decrease of the computational complexity of image fusion algorithms by avoiding the matching of source images before fusion.
The challenges, in their turn, are connected with the structure peculiarities of integrated image sensors. In the case of single-level sensors, the root of the problem lies in their mosaic structure.
Firstly, if we are consider the mosaic structure from the image fusion point of view, we must say that the demosaic operation is required to receive valid fused images. Thus, the first challenge – how to insert the demosaic operation into the image fusion algorithm while minimizing its influence on the resulted fused image.
A large number of works [11] – [13] is dedicated to the problem but most of them is focused on the synthesis of colored images using the so-called “Spectral mapping” or “Color composition” methods, when source images are considered as sub-band components of visual spectrum of a color image. This approach is also widely used as an image fusion algorithm but it is not the only one approach, and, in general, not the best one, because it does not allow the removal of noise and unwanted regions, e. g. fog or smoke, from the fused image.
The other peculiarity of the mentioned works is the tendency to increase the number of source subspectral components, i.e. source images. Usually they utilize 3 subbands, but in some works the number of sub-bands raises up to 8 or even more. Thus, the case of two monochrome images (the most common in image fusion applications), obtained in different spectral bands (e.g. visible and NIR, SWIR and LWIR, etc.), is often set aside.
Besides, there are a lot of different ways to build the mosaic structure of the imaging array by altering the mutual arrangement of its pixels. Therefore, the second question is – which form of pixel arrangement in sensing array will allow us to obtain the most informative fused images.
2. Formal task description
Proceeding from the aforesaid, the research, which is described in the present article, was focused on the solution of the following tasks:
1. To determine the position of the demosaic operation in the sequence of operations in image fusion algorithms, which allows the minimization of information loss in fused images.
2. To determine the form of the spatial arrangement of sensing elements in imaging arrays that allows us to obtain the most informative fused images.
This article represents the results of experiments, which were performed in order to solve these tasks.
3. Source images, algorithms and software
A set of couples of images were used to conduct the experiments which will be described further. Some of the images were taken from the open source libraries on the Web [14], others belong to JSC MNITI. The whole set of images is represented in the Table 1.
Table 1.
|
|
|
|
Thermal image |
Visible image |
|
|
|
|
MWIR image |
Visible image |
|
|
|
|
FLIR image |
LLTV image |
|
|
|
|
Visible image |
Visible image |

For the purposes of the experiment three most well-known image fusion algorithms were used – Principal Component Analysis (PCA)[15], Laplasian Pyramid algorithm [16] and Discrete Wavelet Transform (DWT) algorithm [17]. For the software implementation of the mentioned algorithms, we used a MATLAB program from Oliver Rockinger’s web-site [18].
Let us give a slightly more detailed description of the mentioned algorithms. According to the theory of Principal Component Analysis or PCA, the image that consists of N×M pixels, represents a vector with NM components, and each pixel value in this vector is a vector coordinate in NM-dimension space. Thus, the image fusion task boils down to the determination of the point in the NM-dimensional space, which lies in between the points that correspond to the source images. Then the weight coefficients should be calculated. If we multiply these coefficients by the radius-vectors of the source images points, then we will be able to reach the fused image point. These weight coefficients are used to calculate the fused image pixel values by weighted averaging of source images pixel values that correspond to pixels with the same coordinates. In practice, this task is solved by calculating the eigenvalues and eigenvectors of the covariance matrix for the source images. The weight coefficients are determined as components of the normalized eigenvector of the covariance matrix that corresponds to its maximal eigenvalue.
The basic principle of DWT algorithm is different from the one of laplacian pyramid algorithm. The main idea of both algorithms lies in division of the source images into sub-images with different spatial frequency. This operation can be performed several times so that the “high-frequency” sub-images are also divided into sub-sub-images and so on. In most cases, the number of iterations may differ from 2 to 5. We suppose that “low-frequency” sub-images most probably correspond to the underlying surface or to the background, when „high-frequency” sub-images ‒ to the objects on it. Obtained sets of sub-images are fused as separate images (the “high-frequency” images are usually summed, and the “low-frequency” are averaged, and the process goes back in reverse order. The fused image is “constructed” of fused sub-images by summarizing.
The difference between laplacian pyramid and DWT algorithms lies in the sub-image partitioning method, and therefore in the number of sub-images generated on each algorithm iteration.
4. The intention of the experiment
The intention of the experiment was to simulate the image fusion process by altering the simulation parameters, which correspond to position of the demosaic operation in image fusion algorithm and the spatial arrangement of image sensor array. Consequently, the main purpose was to find the best combination of these parameters, which allow the obtainment of the most informative fused images.
A detailed description of the particular set of parameters (which was taken as corresponding to demosaicing and spatial arrangement) is presented below.
4.1. Position of the Demosaic Operation within the Fusion Algorithm
A large number of image fusion algorithms has been invented during these 30 years. Therefore, there are many classification systems which are used to categorize the algorithms. According to the system described in [14], image fusion algorithms can be divided into pixel-level, feature-level and decision-level.
In our research, we focused on pixel-level algorithms, as they are the most widely used and implemented in hardware. Leaving feature- and decision-level algorithms will be considered in the future work.
Two different steps can be distinguished in inner structure of pixel-level image fusion algorithms. Depending on the complexity of the whole image fusion algorithm, each step may represent a single operation, a chain, or even a large group of operations with its own algorithm. The classification criterion for such division is the way of source images processing - are they processed jointly or separately.
The separate processing stage (usually precedes the joint processing) is focused on analysis and/or processing of source images. It may contain such operations like image enhancement, multiresolution or digital wavelet transformation, decomposition, etc., producing either a processed source image or a set of image components, that was obtained by the source image decomposition.
We use the output of separate processing as the input of joined processing stage. Its main goal is the synthesis of the fused image, i.e. the fusion itself.
Therefore, the demosaic operation can be inserted into the algorithm before these groups (demosaicing of source images), between them (demosaicing of extracted features) and after them (demosaicing of the fused image).
The general pattern of image fusion algorithms that includes possible positions of the demosaic operation is represented in Fig 3.
The rectangles (represent the possible positions of the demosaic operation) are drawn with dotted lines to show, that the demosaic operation is optional and can be placed on No. 1, 2 or 3 positions. Lines, which show that source images are used for fusion operation, are also drawn with dotted lines because they may or may not be used for fusion (depending on the particular algorithm). The possibility of existence of several outputs of separate processing stage is represented in the Fig.1 by multiple lines between separate and joint processing stages.
In the described research, we tested all three positions of the demosaic operation and achieved different results. The results are presented below.
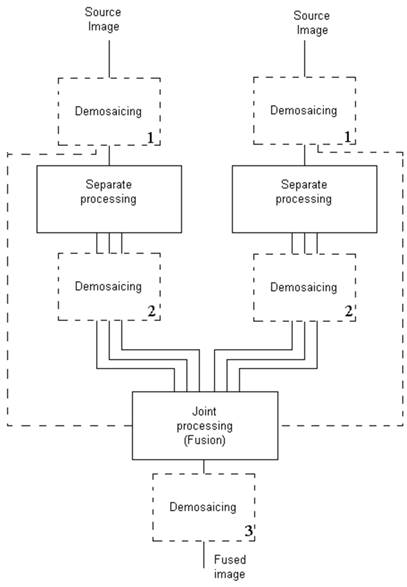
Fig. 3. General image fusion framework with possible position of the demosaic operation
4.2. Spatial arrangement of sensors in the imaging array
Spatial arrangement of sensors was also the subject of the test. The goal was to find the spatial arrangement form, which allows the achievement of minimal information loss after demosaicing.
Of course, even if we have only two different types of sensing elements, there are plenty of ways to arrange them in a two-dimensional array. But in this research, we chose the following three arrangement forms as they are the simplest and easiest to implementat:
- Row arrangement – each adjacent row include of elements sensible in different bands;
- Column arrangement – each adjacent column in imaging array are different;
- Diagonal arrangement – each two adjacent diagonal lines are different (also called as “Checkerboard pattern”).
These arrangement types were simulated by creating reduced source images, which included only row or column, or diagonal pixels of source images respectively. The images with even and odd reduced rows, columns or diagonals were processed during the experiments, but results were virtually the same in all cases, thus we do not take into the account the parity parameter of reduction.
5. The description of the experiment
During the first stage of the experiment, we synthesized fused images for each couples of source images using all the tested algorithms. Later, these images were used as a reference to estimate the information loss for each type of the spatial arrangement of the imaging array and the position of the demosaic operation within the algorithm.
During the second stage, we synthesized fused images for different types of spatial arrangements (using different types of reduced images) and for different positions of the demosaic operation within the fusion algorithm. These operations were performed for each of the earlier mentioned image fusion algorithms. To estimate the information loss, the synthesized fused images were compared with the reference ones, that had been obtained during the first stage of the experiment.
To estimate the information loss, we calculated the root mean square error (RMSE) between the reference fused images (obtained during the first stage) and demosaiced fused images (synthesized during the second stage). We took the formula from [15] and used it for the calculation:
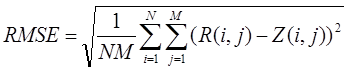
Where N and M represent the vertical and horizontal resolution (number of rows and columns) of the source images, and R(i,j) with Z(i,j) represent the values of pixels from compared images with coordinates i and j respectively.
The calculated results for each couple of images were averaged to the number of source image couples, and the obtained average values were taken as the final results and are represented bellow.
6. Results and conclusions
The obtained results were categorized by the source image set, algorithm type and sensor spatial arrangement and are shown in the following tables. Table 2 corresponds to the demosaicing of source images (demosaic operation is in position No.1 in Fig.3). Table 3 corresponds to the demosaicing of extracted features (demosaic operation is in position No.2 in Fig.3), and Table 4 corresponds to the demosaicing of fused images (demosaic operation is in position No.3 in Fig.3).
Final values in the table represent the RMSE, calculated between fused images that were obtained from full source images without demosaicing and fused images obtained from reduced source images with demosaic during the fusion. The values were calculated by averaging the values obtained for each couple of images and for each (even and odd) combination of rows, columns or diagonals.
It is worth to mention, that there was no great difference between the averaged values, i.e. the variance was relatively low. Thus, it can be stated that the ascertained pattern does not depend on such peculiarities of source images like their spectral band.
Absolute RMSE values as well as relative to the half of dynamic range values (256 levels of gray) are showed. The relative values (calculated in percent) help to show the difference between demosaiced and reference images.
These values represent the loss of information in fused images owing to the reduction and the demosaicing. The information loss increase with the increase of absolute RMSE values as well as relative values, calculated in percent.
Table 2
|
|
PCA |
Laplacian Pyramid |
DWT |
|
Row arrangement |
5,67 |
7,16 |
7.25 |
|
Column arrangement |
3,41 |
3,92 |
4,15 |
|
Diagonal arrangement |
3,45 |
4,29 |
4,44 |
Table 3
|
|
PCA |
Laplacian Pyramid |
DWT |
|
Row arrangement |
5,05 |
28,82 |
50.00 |
|
Column arrangement |
2,66 |
24,78 |
26,53 |
|
Diagonal arrangement |
3,98 |
11,01 |
26,66 |
Table 4
|
|
PCA |
Laplacian Pyramid |
DWT |
|
Row arrangement |
7,24 |
10,63 |
13.24 |
|
Column arrangement |
4,24 |
7,36 |
9,15 |
|
Diagonal arrangement |
6,75 |
7,57 |
9,24 |
The robustness of the tested algorithms to different forms of spatial arrangement of sensing elements in the imaging array can be determined by using the diagrams, represented in the Fig. 4.
|
a |
b |
|
c |
|
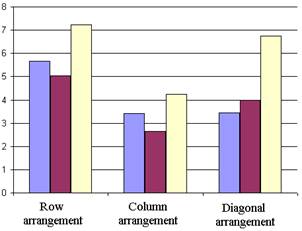
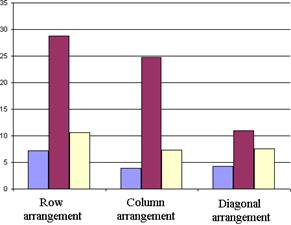
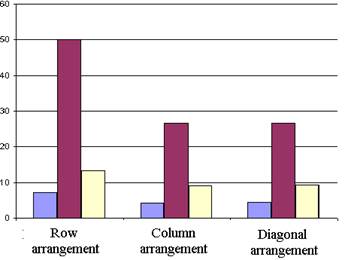
Fig. 4
The diagrams allow the visual comparison of the RMSE values, represented in the Tab. II-IV according to the forms of spatial arrangement of sensing elements in imaging array, for PCA-algorithm (Fig. 4a), Laplacian pyramid algorithm (Fig. 4b) and DWT-algorithm (Fig. 4c). As it can be seen, most of the cases show more or less distinctive minimum in the area, corresponding to the column arrangement of sensing elements in the imaging array.
The analysis of presented results allows us to make several conclusions:
1) The demosaicing of the source images before the fusion is the most effective way to insert the demosaic operation into the image fusion algorithm;
2) The demosaicing of fused images is also applicable, because it allows the achievement of acceptable image loss rates while requires less computations than the demosaicing of source images;
3) Column spatial arrangement of imaging array allows the achievement of lower information loss in fusion than diagonal and, especially, row spatial arrangement types.
4) The examined image fusion algorithms show different robustness to mosaic source images. While PCA-algorithm proved himself robust in all cases, Laplacian pyramid and especially DWT-algorithm showed considerable information loss in fused images, and sometimes (Table No.III) even almost total destruction of the fused picture.
References
1. Piella G. A general framework for multiresolution image fusion: from pixels to regions. Information fusion. 2003. Vol. 4. No. 4. Pp. 259-280.
2. Blum R. Image Fusion with Some Emphasis on CWD. US Army Research Office Electrical Engineering and Computer Science Department Lehigh University. Tech. Rep. DAAD19-00-1-0431.
3. Diedenhofen S.L. et al. Integrated colloidal quantum dot photodetectors with color-tunable plasmonic nanofocusing lenses. Light: Science & Applications. 2015. Vol. 4. No. 1. P. e234.
4. Gong X. et al. High-detectivity polymer photodetectors with spectral response from 300 nm to 1450 nm. Science. 2009. Vol. 325. No. 5948. Pp. 1665-1667.
5. Park H. Vertical Silicon Nanowires for Image Sensor Applications. 2014.
6. Frigerio J. et al. Electronic Imaging & Signal Processing Multispectral imaging sensors integrated on silicon. URL: http://spie.org/newsroom/4861-multispectral-imaging-sensors-integrated-on-silicon (Access date: 29.07.2016)
7. Kiku D. et al. Simultaneous capturing of RGB and additional band images using hybrid color filter array. IS&T/SPIE Electronic Imaging. International Society for Optics and Photonics, 2014. Pp. 90230V-90230V-9.
8. Lim S. J. et al. Organic-on-silicon complementary metal-oxide-semiconductor colour image sensors. Scientific reports. 2015. Vol. 5.
9. Podobna Y. et al. Modular multi-channel imaging system for littoral observation and target detection. SPIE Defense, Security, and Sensing. International Society for Optics and Photonics, 2012. Pp. 837202-837202-10.
10. Dual Band SWIR Security Camera System. URL: http://www.photonicsonline.com/doc/dual-band-swir-security-camera-system-0001 (Access date: 29.07.2016)
11. Lapray P. J. et al. Multispectral filter arrays: Recent advances and practical implementation. Sensors. 2014. Vol. 14. No. 11. Pp. 21626-21659.
12. Eichenholz J. M., Dougherty J. Ultracompact fully integrated megapixel multispectral imager. SPIE OPTO: Integrated Optoelectronic Devices. – International Society for Optics and Photonics, 2009. Pp. 721814-721814-10.
13. Shrestha R., Hardeberg J. Y., Khan R. Spatial arrangement of color filter array for multispectral image acquisition. IS&T/SPIE Electronic Imaging. International Society for Optics and Photonics, 2011. Pp. 787503-787503-9.
14. Image and image sequence fusion. URL: http://www.metapix.de/fusion. (Access date: 29.07.2016)
15. Sharma R. K., Pavel M., Leen T. K. Multistream video fusion using local principal components analysis. SPIE's International Symposium on Optical Science, Engineering, and Instrumentation. International Society for Optics and Photonics, 1998. Pp. 717-725.
16. Akerman III A. Pyramidal techniques for multisensor fusion. Applications in Optical Science and Engineering. International Society for Optics and Photonics, 1992. Pp. 124-131.
17. Pajares G., De La Cruz J. M. A wavelet-based image fusion tutorial. Pattern recognition. 2004. Vol. 37. No. 9. Pp. 1855-1872.
18. Image fusion toolbox for matlab 5.x. URL: http://www.metapix.de/toolbox.htm (Access date: 29.07.2016)
19. Hall D. L., Llinas J. Handbook for multisensor data fusion (Electrical engineering and applied signal processing). 2001.