FOCUSED REGION DETECTION USING MULTISCALE TOP-HAT TRANSFORM FOR MULTIFOCUS IMAGE FUSION
Defa Hu1, 2, Hailiang Shi3*, Weijin Jiang1, 2
1 Mobile E-business Collaborative Innovation Center of Hunan Province, Hunan University of Commerce, Changsha 410205, Hunan, China
2 Key Laboratory of Hunan Province for Mobile Business Intelligence, Changsha 410205, Hunan, China
3 College of Mathematics & Information Science, Zhengzhou University of Light Industry, Zhengzhou 450002, Henan, China
hdf666@163.com, hlshi@zzuli.edu.cn, 2858512981@qq.com
Contents
2. Multiscale Top-Hat Transform
3. Proposed Fusion Method Based on Focused Region Detection
4. Experimental Results and Discussions
Annotation
A novel focused region detection algorithm based on multiscale top-hat transform is proposed, and based on that a multifocus image fusion method is put forward for visualization purpose. In the method, firstly the combined image features of the bright features and the dark features extracted by multiscale top-hat transform are compared to generate two initial decision maps as the focused regions, and then refine the maps by using morphological opening and closing iteratively until some conditions are met. Finally, the fused image is merged by copying the pixels of the focused regions with consistency verification on the boundary pixels to reduce the block effect. The proposed fusion method is tested on three datasets of multifocus images and compared with some traditional fusion methods, and experimental results demonstrate that the proposed method is effective to preserve the salient information and enhance the contrast for visualization, and superior to the traditional methods in terms of several quantitative evaluation measures. Moreover it is robust to mis-registration.
Keywords: image fusion, focused region detection, multiscale top-hat, multifocus.
1. Introduction
Image fusion provides a means to integrate multiple images into a composite image that is more suitable for human visual perception and computer-processing tasks, such as feature extraction and target recognition. For example, the fusion of infrared and visible airborne sensor can aid pilots navigate in poor weather conditions, and the fusion of CT and MRI images may facilitate clinical diagnosis [1]. In addition, there are several clinical visualization applications [2], such as 3D conformal radiation therapy [3] that employ fusion techniques, and medical image visualization method [4] that is developed using intelligent decision fusion. The fusion algorithm requires therefore to identify the most important information in the source images and render it into a single composite. In this context, image fusion can be deemed as the visualization of a multi-valued image (whose components are the inputs to be fused) with a single-valued image (the fused image) [1].
Here we are interested in and investigate multifocus image fusion for visualization purpose. Because of the limited depth of focus of optical lenses of CCD/CMOS cameras, it is difficult to get all objects in focus for a photograph. Image fusion has emerged the means to overcome this issue [5-7].
In the past decades, a number of works has been carried out for multifocus image fusion, and many methods have been proposed. The simplest one, the weighted averaging fusion method, averages the grayscale values of the pixels of the same coordinates in the source image directly with some certain weights, which often results in reduced contrast [6, 7]. Multiscale transform (MST) is considered as an effective analysis tool in image processing, and various MST based fusion methods have been presented. Generally, MST-based methods include three steps [8]: (1) decomposition, (2) lowpass and bandpass subbands coefficients fusion, and (3) reconstruction. The commonly used MST methods not only include traditional downsampling transform, such as Laplacian pyramid transform, discrete wavelet transform, contourlet transform, but also include nonsubsampled multiscale transform, such as nonsubsampled contourlet transform (NSCT) and nonsubsampled shearlet transform [6].
Although MST is widely used in image fusion, there are some limitations in such applications. One obvious limitation is that they are sensitive to mis-registration. Although the impacts on the resultant fused image can be suppressed to a certain degree by using the nonsubsampled methods, the problem cannot be solved completely because these methods use a single transform coefficient as a processing unit [6]. Moreover, no matter which one of the MSTs is used, image fusion still could not be achieved perfectly in that the downsampling or upsampling is required in multiscale decomposition and reconstruction for the MST, and the reliable information of the source images may be changed to a certain degree for fusion, in which block textures and ringing effects are probably obvious. Due to the different image content, the reliability of fusion results differs [9]. Furthermore, the fused image may lose some information of the source image, because these fusion methods cannot select all the transform coefficients from the focused regions, even if the consistency verification could perform on neighborhood to select more from the focused regions [6].
Mathematical morphology is a widely-used theory in image processing and pattern recognition [10]. Top-hat transform is one important operation of mathematical morphology, and has been widely used in target detection, objection recognition, biomedical engineering and so on [11]. However, the processing ability of top-hat transform is inefficient because of image detail smoothing and using only one structuring element. Multiscale top-hat (MTH), the subsequent research result of top-hat transform, could extract more features of convex regions at different scales, which make it be more efficient for image denoising [12], image enhancement [13] and image fusion [11, 14-17]. Mukhopadhyay et al. [14] extract the scale-specific features from the source images using MTH, and then combine them to get the fused image. De et al. [15] employ morphological filters to select sharply focused regions from various images and then combines them together to reconstruct the fused image. Bai et al. [11] give a unified form of MTH based algorithms for image processing. Bai et al. [16] discuss and compare three weighted image fusion methods based on MTH in which the weights can be determined by mean value, standard deviation and entropy. Li et al. [17] present a focused regions detection method based on improved MTH to guide the fusion process in lifting stationary wavelet transform domain.
In this paper, a novel fusion method is proposed based on MTH in which the MTH is mainly used for focused region detection. In the method, focused regions rather than pixels are considered as processing unit, and the regions are processed in spatial domain instead of in transform domain. The fused image is merged by copying the pixels of the focused regions with consistency verification on the boundary pixels to reduce the block effect. The effectiveness of the proposed fusion method is demonstrated with several experiments, and better qualities are achieved in terms of quantitative evaluation measures, such as mutual information, feature mutual information, etc.
The rest of the paper is organized as follows. Section 2 reviews the theory of multiscale top-hat transform. Section 3 describes the proposed fusion method using MTH in detail. Section 4 presents the experimental results and discussions, followed by conclusion in Section 5.
2. Multiscale Top-Hat Transform
In mathematical morphology, with an image ![]() and a structuring element
(SE)
and a structuring element
(SE) ![]() , the
erosion of
, the
erosion of ![]() by
a flat SE
by
a flat SE ![]() at
any location
at
any location ![]() is
defined as the minimum value of the image in the region coincident with
is
defined as the minimum value of the image in the region coincident with ![]() when the origin of
when the origin of ![]() is at
is at ![]() . In equation form,
the erosion at
. In equation form,
the erosion at ![]() of
an image
of
an image ![]() by a
flat SE
by a
flat SE ![]() is
given by:
is
given by:
![]() .
.
Similar, the dilation of ![]() by
by ![]() at any location
at any location ![]() is defined as the maximum value of
the image in the window outlined by
is defined as the maximum value of
the image in the window outlined by ![]() when the origin of
when the origin of ![]() is at
is at ![]() . That is
. That is
![]() .
.
These operations of erosion and dilation are fundamental to morphological processing. In fact, many of the morphological algorithms are based on the two primitive operations. Opening and closing are the examples.
The opening of ![]() by
by ![]() , denoted
, denoted ![]() , is
defined as:
, is
defined as:
![]() .
.
Similarly, the closing of ![]() by
by ![]() , denoted
, denoted ![]() , is
defined as:
, is
defined as:
![]() .
.
Based on opening and closing, the top-hat transform, including white (bright) top-hat transform and black (dark) top-hat transform, denoted by WTH and BTH respectively, are expressed as follows:
![]() ,
,
![]() .
.
WTH is used to extract bright image features, and BTH is used to extract dark image features.
However, in the top-hat operation, only one SE is used, that
means the top-hat operator can extract image features at only one scale
corresponding to the size of the used SE [17]. The shape of SE ![]() plays a crucial role in
extracting features of given shape from an image in morphology. However, for a
categorical extraction of features or objects based on shape as well as size,
what we must incorporate a second attribute to SE is its scale. A morphological
operation with a scalable SE can extract features based on shape and size
simultaneously. Suppose there are
plays a crucial role in
extracting features of given shape from an image in morphology. However, for a
categorical extraction of features or objects based on shape as well as size,
what we must incorporate a second attribute to SE is its scale. A morphological
operation with a scalable SE can extract features based on shape and size
simultaneously. Suppose there are ![]() scales of SEs with the same shape, the SE at
scales of SEs with the same shape, the SE at ![]() th scale (
th scale (![]() ) is defined as:
) is defined as:
![]()
where ![]() is a nonnegative integer representing the scale
factor. By convention
is a nonnegative integer representing the scale
factor. By convention ![]() when
when ![]() .
.
To be effective at all scales, the multiscale top-hat transform, including WTH and BTH, can be defined as:
![]() ,
,
![]() .
.
![]() represents bright image features at scale
represents bright image features at scale ![]() , and
, and ![]() presents the dark image
features at scale
presents the dark image
features at scale ![]() . Through varying the sale factor
. Through varying the sale factor ![]() , the details of an image at
different scales could be extracted and used.
, the details of an image at
different scales could be extracted and used.
3. Proposed Fusion Method Based on Focused Region Detection
For simplicity, suppose there are two multifocus images,
denoted by ![]() and
and
![]() , and the fused
image is
, and the fused
image is ![]() . The
proposed fusion method is described in detail as follows.
. The
proposed fusion method is described in detail as follows.
STEP-1: Extract image features ![]() and
and ![]() according to Eq. (10), and compare
them to generate two initial decision map
according to Eq. (10), and compare
them to generate two initial decision map ![]() and
and ![]() according to Eq. (11) and Eq. (12)
respectively.
according to Eq. (11) and Eq. (12)
respectively.
![]()
![]()
![]()
In Eq. (10), ![]() contains all the bright features that have size
greater than or equal to
contains all the bright features that have size
greater than or equal to ![]() but less than
but less than ![]() , and
, and ![]() contains all the dark features within the same
range. Therefore, the maximum value of the two top-hat operations can present
the bright and dark features of the image simultaneously, and the sum of the
values can present the features that have all the sizes of SEs.
contains all the dark features within the same
range. Therefore, the maximum value of the two top-hat operations can present
the bright and dark features of the image simultaneously, and the sum of the
values can present the features that have all the sizes of SEs.
So, ![]() describes all the image features of the
describes all the image features of the ![]() scales of an
original image [17] that is to say, it denotes the focus value of the source
images at the location
scales of an
original image [17] that is to say, it denotes the focus value of the source
images at the location ![]() . Generally, 1s in a decision map by comparing
the
. Generally, 1s in a decision map by comparing
the ![]() indicate
that the pixel is in focus, and can be selected as the corresponding pixel of
the fused image.
indicate
that the pixel is in focus, and can be selected as the corresponding pixel of
the fused image.
However, in practice, comparing the focus value of ![]() and
and ![]() is not sufficient to
determine all the focused pixel. There are thin protrusions, thin gulfs, narrow
breaks, small holes, etc. in the maps. And according to the theory of imaging,
it can be known that the regions, either focused or defocused, are always
continuous in the inner regions. So the defects mentioned above should be
corrected for the fusion quality [17].
is not sufficient to
determine all the focused pixel. There are thin protrusions, thin gulfs, narrow
breaks, small holes, etc. in the maps. And according to the theory of imaging,
it can be known that the regions, either focused or defocused, are always
continuous in the inner regions. So the defects mentioned above should be
corrected for the fusion quality [17].
In order to detect the focused region accurately, two
initial decision maps ![]() and
and ![]() are generated simultaneously, denoted by Eq.
(11) and Eq. (12). It can be found that the focused regions denoted by
are generated simultaneously, denoted by Eq.
(11) and Eq. (12). It can be found that the focused regions denoted by ![]() and
and ![]() are probably overlapped
somewhere.
are probably overlapped
somewhere.
|
|
|
|
|
|
(a) |
(b) |
(c) |
(d) |
|
|
|
|
|
|
(e) |
(f) |
(g) |
(h) |

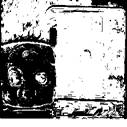
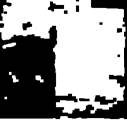
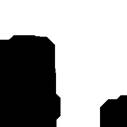

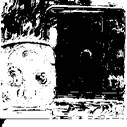
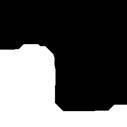
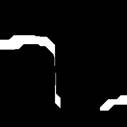
Fig. 1. The ‘clock’ multifocus images and focused region detection results. (a) multifocus image focused on the right clock; (b) the subsequent initial decision map of (a); (c) the intermediate result of refine version of the initial decision map using 3Í3 SE; (d) the last refine version of the initial decision map; (e) multifocus image focused on the left clock; (f) the subsequent initial decision map of (e); (g) the last refine version of the initial decision map; (h) the boundary decision map.
STEP-2: Refine ![]() and
and ![]() to detect focused regions accurately according
to the following focused region refinement algorithm, and generate a boundary
decision map
to detect focused regions accurately according
to the following focused region refinement algorithm, and generate a boundary
decision map ![]() .
.
In morphology, opening generally smoothes the contour of an object, breaks narrow isthmuses, and eliminate thin protrusions. Closing also tends to smooth sections of contours but, as opposed to opening, it generally fuses narrow breads and long thin gulfs, eliminates small holes, and fills gaps in the contours.
It also should be noted that STEP-1 and STEP-2 constitute the focused region detection algorithm.
|
Listing 1. Focused region detection algorithm |
|
for i=1:n assignment of opening on closing on calculate until the ratio end |
STEP-3: Reconstruct the fused image ![]() according to Eq. (13).
according to Eq. (13).
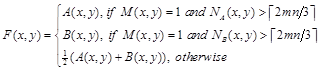
where
![]() ,
,
![]() represents the coordinates within a
represents the coordinates within a ![]() slipping window
center on the current pixel. The essence of
slipping window
center on the current pixel. The essence of ![]() is the number of neighbor pixels which are in
focused region.
is the number of neighbor pixels which are in
focused region. ![]() suggests
that the majority are from the inner focused region of image
suggests
that the majority are from the inner focused region of image ![]() .
.
4. Experimental Results and Discussions
To verify the performance of the proposed algorithm, two datasets of images with perfect registration and one dataset of images with mis-registration are used. For comparison purpose, the fusion experiment is conducted using spatial averaging method, Mukhopadhyay’s method [14] and another three MST based methods as well, which are described briefly as follows.
Method 1: Spatial averaging method (SA) is the simplest technique to fuse two images in which the fused image is formed by a pixel-wise averaging of the constituting images [14]. This method is crude and does not hold well in many cases. The fused image may not contain many salient features of the individual images. As a result there may be a huge loss of information at the time of merging the multifocus images.
Method 2: Mukhopadhyay’s method [14] combines the extracted features obtained by multiscale morphology (MTH) to get the fused image.
Method 3: Morphological pyramid (MOP) based method relies on formation of an image pyramid using morphological sampling theory [14, 18].
Method 4: DWT based method. The DBSS(2, 2) wavelet and decomposition level of 3 are used in this method [18].
Method 5: NSCT based method. Decomposition level of 3, with 4, 8, 16 directions from coarser scale to finer scale, and biorthogonal ‘9-7’ wavelet for nonsubsampled pyramid filter banks and ‘pkva’ wavelet for nonsubsampled directional filter banks [7] are used in this paper.
Method 6: The proposed fusion method. The initial SE size is
![]() , and the scale
number
, and the scale
number ![]() is
is ![]() .
.
In Method 3, Method 4 and Method 5, the lowpass subband coefficients and the bandpass subband coefficients are simply fused by the ‘averaging’ rule and the ‘absolute maximum choosing’ rule [7], respectively.
The first experiment is performed on the ‘clock’ multifocus images which have been registered precisely. Fig. 1 illustrates the ‘clock’ source multifocus images and the intermediate results of the focused region detection. Fig. 1(d, g, h) shows the decision map results of the focused regions and the boundary between the focused regions, and it can be found that the decision is basically consistent with the judgment of the human visual system, which makes the focused region detection method is feasible and effective. Fig. 2 illustrates the fusion results obtained by the above-mentioned fusion methods, in which we can easily observe that Fig. 2 (a) has an obvious contrast reduction and the other figures have roughly the same performance. For a clearer comparison, some enlarged areas from the fused images are shown in Fig. 3 and the area is shown in Fig. 2(a). From the figure, it can be found that Fig. 3(b, c) has some dark shadows around the characters of ‘1’ and ‘2’, and the others preserve the salient information well.
|
|
|
|
|
(a) |
(b) |
(c) |
|
|
|
|
|
(d) |
(e) |
(f) |


Fig. 2. The fusion results obtained by (a) spatial average, (b) Mukhopadhyay’s method , (c) morphological pyramid based, (d) DWT based, (e) NSCT based fusion methods, and (f) the proposed fusion method, respectively.
For further comparison, the average error, mutual information, feature mutual information and the gradient based fusion evaluation metric are used to evaluate the fusion performance quantitatively in this paper. The measures are described briefly as follows.
Average Error (AE) [19] is often used to compute the degree of distortion of the fused image. The lower value of the average error indicates that the fused image is with good fusion quality. It is defined as follows:
![]() ,
,
where ![]() is the size of the source image
is the size of the source image ![]() and the fused image
and the fused image ![]() ,
, ![]() is the pixel location.
is the pixel location.
The average error used in this paper is calculated by averaging the two corresponding values between the source images and the fused image:
![]() .
.
Mutual Information (MI) [20] measures the degree of dependency between two variables by measuring the distance between the joint distribution and the distribution associates with the case of complete independence. The joint and marginal distributions are simply obtained by normalization of the joint and marginal histograms of both images.
![]() ,
,
where ![]() is the number of gray level,
is the number of gray level, ![]() is the jointly normalized
histogram of
is the jointly normalized
histogram of ![]() and
and
![]() ,
, ![]() and
and ![]() are the normalized histogram
of
are the normalized histogram
of ![]() and
and ![]() , and
, and ![]() and
and ![]() represent the pixel values of the
images
represent the pixel values of the
images ![]() and
and ![]() , respectively.
, respectively.
The mutual information used in this paper is calculated by averaging the two corresponding values between the source images and the fused image:
![]() .
.
|
|
|
|
|
(a) |
(b) |
(c) |
|
|
|
|
|
(d) |
(e) |
(f) |
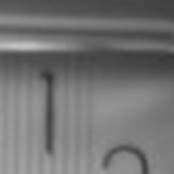
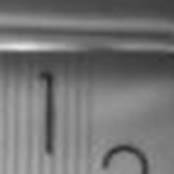
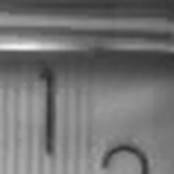
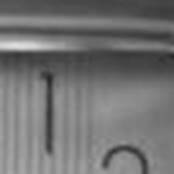
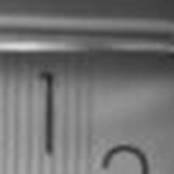
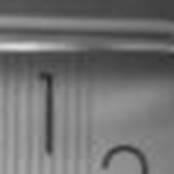
Fig. 3. Comparison of enlarged areas of the fused images of Fig. 2: (a)-(f) are taken from the corresponding part of Fig. 2 (a)-(f), respectively.
Table 1. Quantitative results of the fused images of Fig. 2.
|
Method |
AE(A,B,F) |
MI(A,B,F) |
FMI(A,B,F) |
Q(A,B,F) |
L(A,B,F) |
N(A,B,F) |
|
SA |
0.0167 |
2.4811 |
0.8749 |
0.6919 |
0.3080 |
0.0001 |
|
Mukhopadhyay |
0.0188 |
2.4980 |
0.8862 |
0.7458 |
0.1902 |
0.0640 |
|
MOP |
0.0277 |
2.1222 |
0.8665 |
0.6804 |
0.1849 |
0.1346 |
|
DWT |
0.0218 |
2.2561 |
0.8789 |
0.7219 |
0.1823 |
0.0957 |
|
NSCT |
0.0197 |
2.3974 |
0.8834 |
0.7450 |
0.1885 |
0.0665 |
|
Proposed |
0.0167 |
3.0136 |
0.8937 |
0.7533 |
0.1387 |
0.1080 |
(3) Feature Mutual Information (FMI) [21] is a non-reference objective image fusion metric based on mutual information, which calculates the amount of information conducted from the source image to fused image. The utilized feature is the gradient map since gradient map contains information about the pixels neighborhoods, edge strength and directions, texture and contrast.
![]() ,
,
where ![]() and
and ![]() are the regional mutual information between the
corresponding windows in the fused image and the two source images
respectively, and
are the regional mutual information between the
corresponding windows in the fused image and the two source images
respectively, and ![]() is the entropy of the corresponding window.
is the entropy of the corresponding window.
(4) Gradient based fusion performance evaluation metric [7, 22] associates important visual information with gradient information and assesses fusion by evaluating the success of gradient information transferred from the inputs to the fused image. There are three measures commonly used, defined as follows:
![]() ,
,
![]() ,
,
![]() ,
,
where ![]() ;
; ![]() and
and ![]() denote the edge strength and orientation
preservation values at location
denote the edge strength and orientation
preservation values at location ![]() respectively;
respectively; ![]() is similar to
is similar to ![]() ;
; ![]() and
and ![]() represent perceptual importance of each input
image pixel.
represent perceptual importance of each input
image pixel. ![]() measures
the total fusion information transferred from the sources to the fused image,
measures
the total fusion information transferred from the sources to the fused image, ![]() measures the lost
information in the fusion process, and
measures the lost
information in the fusion process, and ![]() measures the introduced artificial information.
They are all in the range of
measures the introduced artificial information.
They are all in the range of ![]() .
.
Table 1 gives the quantitative measure results of Fig. 2, in
which the best results are indicated in bold. From the table, it can be easily
found that the proposed method provides the best fusion performance in terms of
the largest values of ![]() ,
, ![]() ,
, ![]() and the smallest values in
and the smallest values in ![]() ,
, ![]() among the several fusion methods. It
also can be found that the measure of metric
among the several fusion methods. It
also can be found that the measure of metric ![]() of the proposed method gives the poor
performance in that there is still some block effects since the boundary of the
focused regions cannot be identified accurately.
of the proposed method gives the poor
performance in that there is still some block effects since the boundary of the
focused regions cannot be identified accurately.
|
|
|
|
|
|
(a) |
(b) |
(c) |
(d) |
|
|
|
|
|
|
(e) |
(f) |
(g) |
(h) |


Fig. 4. The ‘disk’ multifocus images and the fusion results: (a) multifocus image focused on the right clock; (b) multifocus image focused on the left book; (c)-(f) the fusion results obtained by (c) spatial average, (d) Mukhopadhyay’s method, (e) morphological pyramid based, (f) DWT based, (g) NSCT based fusion methods, and (h) the proposed fusion method, respectively.
Table 2. Quantitative results of the fused images of Fig. 4.
|
Method |
AE(A,B,F) |
MI(A,B,F) |
FMI(A,B,F) |
Q(A,B,F) |
L(A,B,F) |
N(A,B,F) |
|
SA |
0.0203 |
2.0796 |
0.9014 |
0.5520 |
0.4478 |
0.0002 |
|
Mukhopadhyay |
0.0216 |
2.1536 |
0.9053 |
0.7123 |
0.2337 |
0.0539 |
|
MOP |
0.0333 |
1.7290 |
0.8894 |
0.6462 |
0.1902 |
0.1636 |
|
DWT |
0.0244 |
1.9049 |
0.9045 |
0.6777 |
0.2249 |
0.0974 |
|
NSCT |
0.0226 |
2.0270 |
0.9069 |
0.7130 |
0.2259 |
0.0611 |
|
Proposed |
0.0203 |
2.7445 |
0.9109 |
0.7413 |
0.1477 |
0.1110 |
The second experiment is performed on the ‘disk’ multifocus images which are also registered precisely. Fig. 4 shows the source images and the fused images, and the corresponding quantitative results are given in Table 2. The similar conclusion that the proposed fusion method outperforms the other comparison methods can be made from the data.
The third experiment is performed on the ‘lab’ multifocus images which are mis-registered. Fig. 5(a) and Fig. 5(e) are the source images focused on the clock and the person respectively, and there is a slight movement of the person head between the two images. The rest of Fig. 5 shows the processing results of the focused region detection. Fig. 6 displays the fused images, and similar to the first experiment, the enlarged areas of the corresponding fused images are taken and displayed in Fig. 7. As can be seen, Fig. 7(a), (b), (d), (e) have obviously white shadows on the inner side of border of the hair and the background, and Fig. 7(c) has some dark shadows on the outer side of the border and the ear. Fig. 7(f) obtained by the proposed method is with the best visual effect in that it preserves the salient information and the contrast perfectly for visualization. The quantitative comparisons are given in Table 3, which indicates that the proposed method is robust to the mis-registered situation, and can still provide the excellent fusion performance.
|
|
|
|
|
|
(a) |
(b) |
(c) |
(d) |
|
|
|
|
|
|
(e) |
(f) |
(g) |
(h) |

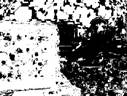
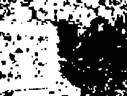
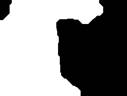

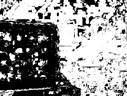
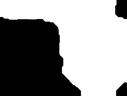
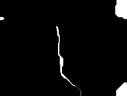
Fig. 5. The ‘lab’ multifocus images and focused region detection results. (a) multifocus image focused on the left clock; (b) the subsequent initial decision map of (a); (c) the intermediate result of refine version of the initial decision map using 3*3 SE; (d) the last refine version of the initial decision map; (e) multifocus image focused on the right person; (f) the subsequent initial decision map of (e); (g) the last refine version of the initial decision map; (h) the boundary decision map
|
|
|
|
|
(a) |
(b) |
(c) |
|
|
|
|
|
(d) |
(e) |
(f) |


Fig. 6. The fusion results obtained by (a) spatial average, (b) Mukhopadhyay’s method, (c) morphological pyramid based, (d) DWT based, (e) NSCT based fusion methods, and (f) the proposed fusion method, respectively.
|
|
|
|
|
(a) |
(b) |
(c) |
|
|
|
|
|
(d) |
(e) |
(f) |
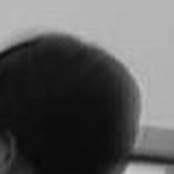
Fig. 7. Comparison of enlarged areas of the fused images of Fig. 6: (a)-(f) are taken from the corresponding part of Fig. 2(a)-(f), respectively.
|
Table 3. Quantitative results of the fused images of Fig. 6. |
||||||
|
Method |
AE(A,B,F) |
MI(A,B,F) |
FMI(A,B,F) |
Q(A,B,F) |
L(A,B,F) |
N(A,B,F) |
|
SA |
0.0145 |
2.4661 |
0.9105 |
0.6096 |
0.3901 |
0.0003 |
|
Mukhopadhyay |
0.0156 |
2.4839 |
0.9122 |
0.7353 |
0.2115 |
0.0532 |
|
MOP |
0.0229 |
2.1247 |
0.8978 |
0.6780 |
0.1727 |
0.1493 |
|
DWT |
0.0176 |
2.2727 |
0.9143 |
0.7114 |
0.1950 |
0.0936 |
|
NSCT |
0.0162 |
2.4307 |
0.9164 |
0.7416 |
0.1979 |
0.0605 |
|
Proposed |
0.0145 |
2.9115 |
0.9193 |
0.7642 |
0.1171 |
0.1187 |
5. Conclusion
Multiscale top-hat transform is a powerful tool in the field of image processing because it uses a scalable structuring element to extract features based on shape and size simultaneously. In this paper, multiscale top-hat transform is used to extract bright and dark features from the source images respectively, and based on the combined features, the focused regions are identified as processing units rather than pixels, which can reduce the impact of the mis-registration and preserve the salient information and the contrast for visualization. The fused image is merged by copying the pixels of the focused regions with consistency verification on the boundary pixels. The fusion process is completely performed in spatial domain instead of transform domain, which can reduce the computational complexity and improve the speed of fusion as well. The experimental results of three datasets demonstrate the validity and superiority of the proposed fusion method, and the proposed method is robust to mis-registration. The Matlab implementation of the proposed fusion method is available upon request.
Acknowledgment
The authors first sincerely thank the editors and anonymous reviewers for their constructive comments and suggestions, which are of great value to us. This work was supported by National Natural Science Foundation of China (No. 61202464, No. 61472136, No. 11501527) and Natural Science Research Program of Henan Educational Committee (No. 14A120012).
References
1. Piella G., Image fusion for enhanced visualization: A variational approach, International Journal of Computer Vision, vol. 83, no. 1, pp. 1-11, 2009.
2. James A.P., Dasarathy B.V., Medical image fusion: A survey of the state of the art, Information Fusion, vol. 19, pp. 4-19, 2014.
3. Weber D.C., Dipasquale G., Rouzaud M. and Miralbell R., A comparison of gross tumor volumes segmented on diagnostic MRI and planning CT with or without post-operative open low-field MR1 fusion for 3-D conformal radiotherapy of glioblastomas, EJC Supplements, vol. 3, no. 2, pp. 405-405, 2005.
4. Zhu Y.M. and Cochoff S.M., An object-oriented framework for medical image registration, fusion, and visualization, Computer methods and programs in biomedicine, vol. 82, no. 3, pp. 258-267, 2006.
5. Zhang Z. and Blum R.S., A categorization of multiscale-decomposition-based image fusion schemes with a performance study for a digital camera application, Proc. IEEE, vol. 87, no. 8, pp. 1315–1326, 1999.
6. Wu W., Yang X., Pang Y., Peng J. and Jeon G., A multifocus image fusion method by using hidden Markov model, Optics Communications, vol. 287, pp. 63-72, 2013.
7. Zhang Q. and Guo B.L., Multifocus image fusion using the nonsubsampled contourlet transform, Signal Processing, vol. 89, no. 7, pp. 1334-1346, 2009.
8. Zhang X., Li X., Liu Z. and Feng Y., Multi-focus image fusion using image-partition-based focus detection, Signal Processing, vol. 102, pp. 64-76, 2014.
9. Cao Y., Cai Y.Z., Han Y., A New Fusion Method for Lost-focus Images Based on Vision Structural Similarity, Journal of Shanghai Jiaotong University, vol. 44, no. 11, pp. 1501-1506, 2010.
10. Bai X., Zhou F. and Xue B., Image fusion through local feature extraction by using multi-scale top-hat by reconstruction operators, Optik-International Journal for Light and Electron Optics, vol. 124, no. 18, pp. 3198-3203, 2013.
11. Bai X. and Zhou F., A unified form of multi-scale top-hat transform based algorithms for image processing, Optik-International Journal for Light and Electron Optics, vol. 124, pp. 13, pp. 1614-1619, 2013.
12. Mukhopadhyay S. and Chanda B., An edge preserving noise smoothing technique using multiscale morphology, Signal Processing, vol. 82, no. 4, pp. 527-544, 2002.
13. Mukhopadhyay S. and Chanda B., A multiscale morphological approach to local contrast enhancement, Signal Processing, vol. 80, no. 4, pp. 685-696, 2000.
14. Mukhopadhyay S. and Chanda B., Fusion of 2D grayscale images using multiscale morphology, Pattern Recognition, vol. 34, no. 10, pp. 1939-1949, 2001.
15. De I., Chanda B. and Chattopadhyay B., Enhancing effective depth-of-field by image fusion using mathematical morphology, Image and Vision Computing, vol. 24, no. 12, pp. 1278-1287, 2006.
16. Bai X., Gu S., Zhou F. and Xue B., Weighted image fusion based on multi-scale top-hat transform: Algorithms and a comparison study, Optik-International Journal for Light and Electron Optics, vol. 124, no. 13, pp. 1660-1668, 2013.
17. Li H., Chai Y. and Li Z., A new fusion scheme for multifocus image based on focused pixels detection, Machine Vision and Application, vol. 24, pp. 1167-1181, 2013.
18. Oliver Rockinger image fusion toolbox, http://www.metapix.de /toolbox.htm.
19. Jagalingam P. and Hegde A.V., A Review of Quality Metrics for Fused Image, Aquatic Procedia, vol. 4, pp. 133-142, 2015.
20. Xu Z., Medical image fusion using multi-level local extrema, Information Fusion, vol. 19, pp. 38-48, 2014.
21. Haghighat M.B.A., Aghagolzadeh A. and Seyedarabi, H., A non-reference image fusion metric based on mutual information of image features, Computers & Electrical Engineering, vol. 37, no. 5, pp. 744-756, 2011.
22. Petrovic V. and Xydeas C., Objective image fusion performance characterization, Proc. Int. Conf. Computer vision, vol. 2, pp. 1866-1871, 2005.