RUBY ON RAILS USAGE FOR ANIMATED VISUAL REPRESENTATION OF GRAPHICAL INFORMATION AND DEVELOPMENT OF AN ELECTRONIC JOURNAL
E.A. Roganov
National Research Nuclear University MEPhI (Moscow Engineering Physics Institute), Russian Federation
Contents
2. Animation of statistic data
3. Visualization position in the ranking
3.1. The rating system of assessments
3.2. Inductive calculation of the rating
3.3. Visualization of the schedules one-parameter family of functions
4. Website of electronic journal
4.1. Web-oriented scientific materials
4.3. Ruby on Rails as a means of creating the electronic journal
Abstract
The article deals with the possibilities of using Ruby on Rails framework for visualization of graphics and text information. First, it describes methods of SVG-animation and AJAX-technology to draw graphs of one-parameter family of functions. In order to visualize the change of a position in the ranking of departments, we create from scratch a simple Rails application. Then, in the real web-application we add the ability to visualize the student’s position in the rating. We also propose a method to calculate effectively this position.
The article proposes suggestions for the development of an electronic journal web site (portal) based on free software and information technology: markup language Markdown, MathJax library, document converter Pandoc, framework Ruby on Rails. Markdown was originally designed as a convenient language for reading and directly editing, from which is easy to get html. Now this language is widely used for preparation of scientific publications and training materials. The appearance of the document converter Pandoc confirmed the role of Markdown as a “universal” language.
The Ruby on Rails framework is an ideal instrument for the creation of the electronic journal web site. The usage of this portal requires neither any deep knowledge of latest information technology, nor the installation of special software. The portal is compatible with mobile devices and any qualified author can easily master a bit of additional knowledge and skills necessary to work with this environment. We describe the advantages obtained when implementing the journal web site by this method.
Keywords: Ruby on Rails, Free Software, SVG, AJAX, visualization of position in rating, inductive functions, Markdown, Pandoc.
1. Introduction
“Ruby on Rails, or simply Rails, is a server-side web application framework written in Ruby under the MIT License. Rails is a model–view–controller (MVC) framework, providing default structures for a database, a web service, and web pages. It encourages and facilitates the use of web standards such as JSON or XML for data transfer, and HTML, CSS and JavaScript for display and user interfacing.” — says Wikipedia about Ruby on Rails [1]. Among the most well-known applications that are built on Ruby on Rails, can be called GitHub and Shopify. There are the hundreds of thousands of applications based on this framework since its release in 2004. Many information systems of National Research Nuclear University MEPhI also developed based on Ruby on Rails.
Ruby on Rails is under active development, its latest version (5.0) was released June 30, 2016. Despite its extensive use in various fields [2-4], it is rarely used to solve the problems associated with handling big data and visualization of different data types.
The aim of this article is to demonstrate the possibilities of Ruby on Rails for vizualization of graphics and text information. It discusses the following examples:
· usage SVG-animation to illustrate the variation in time of statistical data;
· utilization AJAX-technology to draw graphs one-parameter family of functions, whitch need large computing resources for calculation of their values;
· creation of an electronic journal site containing articles in the markup language Markdown, which provides transformation articles into various output formats (including HTML, PDF, docx, ebook, and others) by a converter Pandoc, visualization of the hypertext representation of mathematical formulas using MathJax library and the ability to search publications, which contain a given fragment of text or formula.
Problems, described in the first two sections, are only model problems and illustrate the features of the framework Ruby on Rails and the simplicity of its use for plotting graphs and their animations. Experience has shown that the second-year students, who know the basics of object-oriented programming, are able to learn the basics of Ruby on Rails within one month.
The third section contains a quite specific proposal for the implementation of the electronic journal site using modern information technology. A significant part of ideas already tested in practice, and the transition to the use of these technologies can be made gradual and not noticeable, even for authors who do not want to learn new technologies. Such a site is able to facilitate the work of editorial staff and to provide additional capabilities to readers of the magazine.
Importantly, all technologies and software products used in the described approach are Free Software. Besides, application built with Ruby on Rails, uses interpreted languages (Ruby, Haml, SASS, JavaScript, CoffeeScript, SASS, Markdown and others), so it always contains the easily readable and modifiable full source code. This allows constantly to improve the code and provides greater independence from a particular programmer.
2. Animation of statistic data
As a first example of using Ruby on Rails framework for
visualizing graphic information consider the task of processing a little less
than 400000 assessments of MEPhI students they have received over the past four
years during exams. We will consider only the positive ECTS evaluations: ![]() ,
, ![]() ,
, ![]() ,
, ![]() and
and ![]() . For
calculation of the grade point average we will use the following scale:
. For
calculation of the grade point average we will use the following scale: ![]() ,
, ![]() ,
, ![]() ,
, ![]() ,
, ![]() .
.
For all departments of the university, and for each of the subjects taught at each department, we can easily find following values:
·
quantity of the evaluations of ![]() ,
, ![]() ,
, ![]() ,
, ![]() and
and ![]() for
each of the past eight examinations periods;
for
each of the past eight examinations periods;
· percentage of these evaluations;
· grade point average.
Consider a rating of departments sorting them according to the average score for each of the the examinations periods. Similarly, there is rank each of the disciplines of the department among all its disciplines. We may to determine the change of these positions in time of the transition from one period to another. Our task is to create a Rails-application, which will grant ability to download all available assessments, will allow to calculate the above-described characteristics of departments and disciplines, and to visualize the variation in time of these characteristics.
Despite the fact that the professional use of Ruby on Rails requires very extensive knowledge in various fields, the solution is relatively simple and routine tasks with the help of this framework can be prepared very quickly and with little effort. This is true, of course, only under the assumption that the developer has the skills to work with databases, understands the principles of object-oriented programming and is familiar with the basics of modern Internet technologies.
In our application we do not need to implement authentication of users, do not even need to deploy it on the server in production mode — is sufficient work of application in development mode. New “empty” application, which we will name marks, can be created by a command rails new marks -d postgresql. After that you should create a basic models (departments, disciplines and evaluations) with just a few commands and the means to work with them (controllers and views), create the link of models with the database, initialize the database tables and perform some more simple actions to “animate” app.
We will not discuss scripts populate the database and calculation of characteristics of departments and disciplines described above, since these steps are quite standard. Not of much interest and discussion of interfaces to visualize of tables sorted by the average score of the department of university or the discipline of department. We note only that the amount of code that you should to write to solve these tasks is extremely small, and the use of Haml markup language allows you to easily create and read the code. Here’s how to set a table row:
- @chairs.each_with_index do |c, i|
%tr
%td
%span
= (i + 1).to_s + '.'
%span{title: 'For detailed information'}
= link_to "#{c.name}\ (#{c.num})", chair_path(c)
%td.text-center.text-bold
= sprintf("%.2f", c.av_value)
%td.text-center
= c.g_marks['total']['total']
- %w(A B C D E).each do |m|
%td.text-center
= c.p_marks['total'][m]
%td.text-center
= link_to(fa_icon('bar-chart'), animate_chair_path(c))
Let’s move on to a discussion of the underlying problem — the creation of the animation to visualize the time variation of various characteristics of departments and disciplines. The first step is the choice of animation technology. Modern HTML5 standard offers to choose between SVG and CANVAS. There are many reasons why for our animation (as opposed, for example, from case of games) is better to use SVG [5,6]. Author of the publication [7] has come the same conclusion.
There are a number of libraries that facilitate the creation of SVG-animation, with many of them are Free Software [8,9].
In Ruby on Rails is traditionally used jQuery [10], but the creation of SVG-animation only with its help is difficult. At the other extreme we can apply of one of the most powerful tools for visualization — D3.js library [11]. But as correctly noted Jerome Cukier, “You may not need d3” [12]. So we choose the compromise solution — small, focused precisely on the creation of animation, Velocity.js library [13]. Additionally, it is possible learn to use this library very quickly.
The process of creating SVG-animation in Ruby on Rails is quite simple. First, we need to add to code of SVG-image the data-attributes with information about the values of all the changing image parameters. In the case of a bar chart, for example, can be set an array of successive heights of columns diagram or an array of successive differences of heights. A html-code generated by application, might look like:
<rect id="rect-A" y="144.88px" x="52" width="76" height="105.12px"
style="fill:rgb(100,100,200);" data-arr="[8.5,-23.4,1,-25.9,14.8,-0.5]">
Then in a javascript-file we add event handlers and functions that will read from DOM elements the information about the necessary changes and to call Velocity.js animation methods. The code of these functions is also quite simple and clear. Here’s a snippet:
var arr2 = JSON.parse($("#text-" + marks[index]).attr('data-arr'));
$("#rect-" + marks[index])
.delay(2000)
.velocity({height: "+=" + arr2[0] +"\"", y: "-=" + arr2[0] +"\""},
{duration: 1500/speed, easing: "ease-in"});
In this code is called a method that after two-second delay (delay (2000)) for a specified period of time (duration: 1500/speed) changes the height and ordinate of a rectangle of the bar chart.
The direct incorporation of svg-animation into the text of article is difficult, therefore the result of animation is converted into a video file using the Simple Screen Recorder and shown in Fig. 1.
Fig. 1. Animation of the time variation of some characteristics of the department
3. Visualization position in the ranking
3.1. The rating system of assessments
Score-rating system for assessing knowledge and skills of students are well known and widely used in many countries. Often, their use is strictly formalized (see., eg, [14]). Discussion of the advantages and disadvantages of the various systems of knowledge assessment is not the purpose of this work, but one wants to note that any such system is the simply way to convert some primary grade points into final rating of the student. Therefore, only the presence of a sufficiently large number of objective primary grade points can be the basis for the application of any of these systems.
The system of simple rating (ranking of overall position) is different from the score-rating system: in it is important not the absolute value of the rating (the number of points or credits in the score-rating system), but only a relative position in the ranking. This approach is not new — it was widely used in the past. Phrases such as “the best graduate of the seminary out of 148 people” or “graduated the Academy the first (out of seventeen)” is much more informative than modern “graduated with honors”. Years of experience has convinced the author that the use of the simple rating system is more efficient.
So, if in some discipline (or, better yet, in some of
profiling disciplines) the professors systematically carry out various types of
control — quizzes, tests, laboratory work, mandatory individual homeworks,
midterm exams and other, it becomes possible to evaluate the current progress
of students using a rating system. Simplified compared to actual use in
practice the rating calculation scheme is defined as: ![]() ,
where
,
where ![]() — rating,
— rating, ![]() — contribution of
formal assessments and
— contribution of
formal assessments and ![]() — contribution of the assessments of
large chunks of the course.
— contribution of the assessments of
large chunks of the course.
The formal assessments here are systematic, preplanned
methods of testing students that are used to determine how well students have
learned the material that is being taught. Contribution ![]() of formal assessments
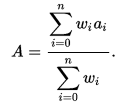
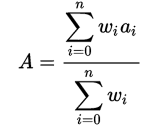
is defined as weighted average of normalized grade points for each of them. In
most situations, it is sufficient to use scale from
of formal assessments
is defined as weighted average of normalized grade points for each of them. In
most situations, it is sufficient to use scale from ![]() to
to ![]() and make one assessment
every two weeks. Normalization of the assessment is simply the subtraction the
value
and make one assessment
every two weeks. Normalization of the assessment is simply the subtraction the
value ![]() , which allows us to give practical
meaning to the expression “negative evaluation”. Thus, a result of
, which allows us to give practical
meaning to the expression “negative evaluation”. Thus, a result of ![]() assessments
assessments
Weights ![]() should
be chosen so that the contribution of the latest assessment was the highest,
and the previous assessments were less important. This makes it possible to
stimulate the students’ work, because receiving of a high score immediately
leads to a marked increase in rating.
should
be chosen so that the contribution of the latest assessment was the highest,
and the previous assessments were less important. This makes it possible to
stimulate the students’ work, because receiving of a high score immediately
leads to a marked increase in rating.
The large chunks of the course are scored using the
following ternary scale: “Do not passed”, “passed” and “passed excellent”. An
example of such an assessment is midterm exam. Contribution ![]() in rating of these
types of evaluations is simply the sum of the contributions of each of them:
in rating of these
types of evaluations is simply the sum of the contributions of each of them:

where ![]() —
contribution of
—
contribution of ![]() -th assessment.
-th assessment.
More accurately
- large chunk of the course,
which is passed excellent, does some fixed positive contribution into
rating (eg,
 scores);
 - passed in time (or with a
relatively short delay) chunk gives no contribution into rating, the long
delay (eg, two weeks) attracts a fixed penalty (eg,
 score);
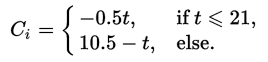
 - contribution to the rating of
the failed large chunk depends on the number of days
 , passed since the
deadline: it can be set, for example, as a linear or piecewise-linear
function of the following form:
, passed since the
deadline: it can be set, for example, as a linear or piecewise-linear
function of the following form:
Since for the final evaluation of the student’s success is important not the numeric value of rating, but ranking of overall position, a graph of position changes of a particular student for a semester is a very useful information. At Fig. 2 shown one of the pages of the portal edu-online.mephi.ru, containing the graph of this function (taking into account the requirements of the Personal Data Protection Act). Web portal edu-online.mephi.ru is implemented based on Ruby on Rails and used in the real educational process.
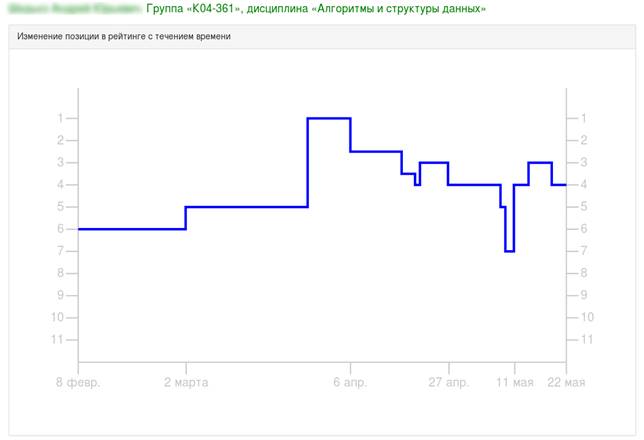
Fig. 2. Schedule a position change in the ranking of a particular student
It should be noted that the calculation of the current rating of a group of students, and even of the set, consisting of 6-8 groups, is quite simple for any formula used to calculate the rankings. The problem is slightly more complicated, when it comes to finding a changing during the term position in the ranking of a particular student. The computational complexity of this function for a specific discipline is related to the need to determine the ranking of a group of students (or for set of groups) for each of the passed days, due to the contribution to the rating of the failed large chunks. At the same time the complexity of average rating for several academic disciplines increases in proportion to the number of disciplines.
It is generally accepted (see, fg, [15]), that the response time of the “good” Web application for every user request should not exceed a few tens of milliseconds, and cannot be more than 200-300 milliseconds. In our case, the situation is aggravated by the fact that calculating in the Rails-app performed by relatively slow Ruby interpreter.
Calculation in advance and storage in a database ranking each of the students for all already passed days of the semester is impossible as there is the need of rapid recalculation overall position in the event of a change for one or another reason one of the first-grade points. Another important factor is the requirement of the fast recalculation of overall position when change the parameters defining the function itself calculating rankings. The latter is very useful for finding optimal parameters defining this function.
With using the library for generating fake data [17] it
is easy to create 6 educational groups by 25 students and
6 disciplines by which each student will get 15 random grade points.
To simplify calculation we not will to consider the assessments of the large
chunks of the course, and all the weights ![]() in
the formula
in
the formula
will be assumed to be unity. The experiment shows that under these conditions the receiving of chart, similar to shown in Fig. 1, takes about two seconds.
Thus, the problem of fast calculation the rating of students for each already passed days of the semester is a separate important task.
3.2. Inductive calculation of the rating
To effectively calculate the array of rating numeric values (for all consecutive days of semester) it is reasonable to apply the theory of inductive functions, proposed A. G. Kouchnirenko [16] 30 years ago.
According to this theory the function ![]() from
the space of sequences of
from
the space of sequences of ![]() is
called inductive if
is
called inductive if ![]() can
be calculated from
can
be calculated from ![]() and
and ![]() , that is, if
, that is, if ![]() such that
such that ![]() . Here
. Here
![]() — the
space of sequences of elements from the set
— the
space of sequences of elements from the set ![]() ,
, ![]() — some sequence of
elements,
— some sequence of
elements, ![]() — sequence obtained from
— sequence obtained from ![]() by concatenating of
the element
by concatenating of
the element ![]() .
.
The simplest examples of inductive functions on sequences of
integers ![]() the
length of the sequence and the sum of its elements. For the first of these
functions a mapping
the
length of the sequence and the sum of its elements. For the first of these
functions a mapping ![]() defined by the formula
defined by the formula ![]() and
for the second
and
for the second ![]() .
Non-inductive function is, for example, the arithmetic mean of sequence
elements.
.
Non-inductive function is, for example, the arithmetic mean of sequence
elements.
The main value of the theory of inductive function it is
practical recommendations to build a so-called inductive extension for any
non-inductive function. The inductive extension of functions ![]() it is
a inductive function
it is
a inductive function ![]() for
which
for
which ![]() such that
such that ![]() . To
construct the inductive extension, we need to store some additional information
on sequence. As a result, we get an efficient algorithm recomputation of the
function when new element is added to the sequence.
. To
construct the inductive extension, we need to store some additional information
on sequence. As a result, we get an efficient algorithm recomputation of the
function when new element is added to the sequence.
For example, for non-inductive function “arithmetic mean of
the elements of a sequence” its inductive extension is a function ![]() ,
defined on a non-empty (the length of which is not less than one) sequences of
integers whose value is a pair of numbers: the sum of the elements and its
quantity. Each of these components allows the inductive recalculation and
mapping of
,
defined on a non-empty (the length of which is not less than one) sequences of
integers whose value is a pair of numbers: the sum of the elements and its
quantity. Each of these components allows the inductive recalculation and
mapping of ![]() in this case is simply the ratio of
these two values.
in this case is simply the ratio of
these two values.
Let us return to the problem of calculating the rating for
the relatively large number of students and the grade points. For simplicity,
we again consider the absence of assessments of large chunks of the course, and
the function ![]() — contribution of grade points
— contribution of grade points ![]() ,
, ![]() ,
, ![]() ,
, ![]() will
be considered as function on the space of sequences these grade points. It is
easy to see that this function would be inductive, if the weights are
decreasing geometric progression with denominator
will
be considered as function on the space of sequences these grade points. It is
easy to see that this function would be inductive, if the weights are
decreasing geometric progression with denominator ![]() (maximum weight for
the last evaluation). In this case, the
(maximum weight for
the last evaluation). In this case, the ![]() .
.
Simple inductive extension also may be constructed also for
the case of equal weights when the function ![]() is
the arithmetic mean of the grade points.
is
the arithmetic mean of the grade points.
Both these cases, however, are not well describe the desired
behavior of the rankings: in the first case a contribution of “old” grade points
is too insignificant, and in the second all the grade points are equivalent.
Intermediate variant can be obtained if the weights decrease by law ![]() for
some
for
some ![]() . In such case the rate of the weights
decrease is significantly lower than for exponentially law
. In such case the rate of the weights
decrease is significantly lower than for exponentially law ![]() .
.
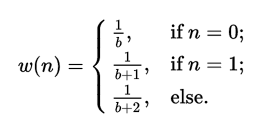
Easy to see, however, that construction of the inductive
extension of the function ![]() in that case requires the memorization
of all grade points. The situation can be improved if the specified law will be
applyed only for last three grade points and all earlier grade points will be
considered with equal weight:
in that case requires the memorization
of all grade points. The situation can be improved if the specified law will be
applyed only for last three grade points and all earlier grade points will be
considered with equal weight:
In this case for the recalculation of the function ![]() when
a new grade point
when
a new grade point ![]() is added sufficiently additionally to
remember only the last two grade points of the sequence
is added sufficiently additionally to
remember only the last two grade points of the sequence ![]() .
.
Formulas of recalculating ![]() for strings of length
at most two are obvious. So let’s move directly to the general case and
consider the function
for strings of length
at most two are obvious. So let’s move directly to the general case and
consider the function ![]() , for
sequence length of at least two:
, for
sequence length of at least two:
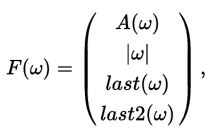
where ![]() —
length of
—
length of ![]() ,
, ![]() and
and ![]() — the last and the
penultimate its elements, respectively. For convenience, we denote successive
components of function
— the last and the
penultimate its elements, respectively. For convenience, we denote successive
components of function ![]() by
by ![]() ,
, ![]() ,
, ![]() and
and ![]() .
.
We calculate the value of ![]() at the sequences
at the sequences ![]() and
and ![]() .
.
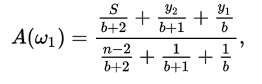
where ![]() denotes the sum of the first
denotes the sum of the first ![]() elements of the
sequence
elements of the
sequence ![]()
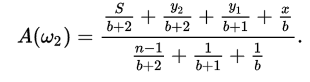
Comparing the values of ![]() at
sequences
at
sequences ![]() and
and ![]() , we
get
, we
get
where
![]()
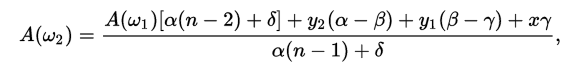
The resulting formula gives us the opportunity to
effectively calculate the value of the function ![]() at an elongation of
the sequence. Software implementation of the mapping
at an elongation of
the sequence. Software implementation of the mapping ![]() is as follows:
is as follows:
x = val.to_f - 3.0
rating_a =
case n
when 0
x
when 1
(b*y1+(b+1.0)*x)/(2.0*b+1.0)
else
(rating_a*(@A*(n-2)+@D)+(@A-@B)*y2+(@B-@C)*y1+@C*x)/(@A*(n-1)+@D)
end
y2 = y1
y1 = x
n += 1
The variable rating_a here
corresponds to the function ![]() , variables @A,
@B, @C и @D — are, respectively,
, variables @A,
@B, @C и @D — are, respectively, ![]() ,
, ![]() ,
, ![]() and
and ![]() , and the names of all
other program variables match with their names in mathematical calculations
given above. The use of this algorithm can significantly reduce the time of
computing the rankings. Evaluation of reduce the time along with the server’s
characteristics, on which deployed web application, is done below after the
decision of the main problem — visualization of the change in the rating
as function of the parameter
, and the names of all
other program variables match with their names in mathematical calculations
given above. The use of this algorithm can significantly reduce the time of
computing the rankings. Evaluation of reduce the time along with the server’s
characteristics, on which deployed web application, is done below after the
decision of the main problem — visualization of the change in the rating
as function of the parameter ![]() .
.
The optimal value of this parameter, which determines the
weighting coefficients in the formula for calculating the rating may be
adjusted by means of modeling. For this purpose, in the conditions described
above (150 students, 15 grade points for each of 6 disciplines) need to analyze
the resulting graphs for different values of ![]() , which leads to the
task of visualization of the one-parameter family of functions.
, which leads to the
task of visualization of the one-parameter family of functions.
3.3. Visualization of the schedules one-parameter family of functions
Optimization of calculations, which done with help the
theory of inductive functions, reduces required time for the image changes
position in the ranking for a particular value of the parameter ![]() , but nevertheless
these calculations require a certain time. Besides we may perform these
calculations only on the server, because the needed data have a very large
volume.
, but nevertheless
these calculations require a certain time. Besides we may perform these
calculations only on the server, because the needed data have a very large
volume.
In this situation use animation to visualize the functions of the family schedules is inappropriate, because this approach first needs considerable time for the calculation of the required data, and then a large amount of data will need to transfer to the client. We not need animation, however. Ruby on Rails framework has quite standard means to show of a sequence of charts.
Our interface should provide the ability to specify the end
of the variation range of the parameter ![]() from a
fixed initial value of
from a
fixed initial value of ![]() , a step of change of the parameter and
timeout between the beginning of visualization of two consecutive schedules. In
order to increase the visibility the color of the chart should change smoothly
from initial blue to final red. To implement this, we need
, a step of change of the parameter and
timeout between the beginning of visualization of two consecutive schedules. In
order to increase the visibility the color of the chart should change smoothly
from initial blue to final red. To implement this, we need
- prepare a view, which using
SVG-technology shows initial schedule of the family, corresponding to the
starting value of the parameter
 ;
; - add the entry form, allowing to
set the final value
 , step of change and the timeout;
 - implement in CoffeeScript a recursive method that reads these parameters, and then
- adds the step value to ;
- makes AJAX-request to the server, which returns the data needed to visualize of the next schedule;
- calls themselves using the setTimeout.
Here is the code of this method:
anim_eval = (curr, from, step, to, elem, course_group_set_id,
student_id, timeout) ->
if (step > 0 and curr < to + 1.0e-9) or (step < 0 and curr > to - 1.0e-9)
num = Math.floor((curr-from)/(to-from)*255)
$.ajax
url: "/students/#{student_id}/animate"
method: 'PUT'
data: {anim_val: curr, anim_color: num,
course_group_set_id: course_group_set_id}
success: (data) ->
$('polyline').attr("style", data['style'])
$('polyline').attr("points", data['points'])
$('.anim-show').val(data['value'])
setTimeout ( ->
anim_eval(curr + step, from, step, to, elem,
course_group_set_id, student_id, timeout)
), timeout
The result is presented in the form of a video file in Fig. 3.
Fig. 3. Visualization of the schedule change of position in the rating depending on the parameter
The described web application is deployed in a virtual machine (container) with a 128 GB of RAM, where for it are available 8 processing threads (of the 32 on the main Cisco C300M server, 2x Intel Xeon E5-2680). The server operating system is Debian 8.3 (Jessie), container OS — Scientific Linux 7.1 (Nitrogen).
The experiment shows that drawing of a single schedule requires about 250 milliseconds. A study with a rack-mini-profiler [18] provides more details: about 12% is spent on obtaining grade points and other relevant information from the database, a little less than 2% is required to generate the html-code, and the rest of the time takes calculation of the students rating. This means that the use of the theory of inductive functions reduces the computation time ranking is almost ten times.
4. Website of electronic journal
4.1. Web-oriented scientific materials
The wide spread of mobile devices requires scientific materials, work with which on such devices is a convenient and comfortable. So as viewing on such devices pdf-documents, as well as Word or Excel files is hindered, in fact this is equivalent to the requirements of the presence of materials in a html-format [19].
An important problem, which has long been kept active dissemination of hypertext scientific materials were difficulties with visualization mathematical formulas in browsers. All solutions offered before the creation of JavaScript-library MathJax [20], have certain disadvantages. MathJax allows you to include in the html-document a source code of mathematical formulas using MathML, LaTeX or ASCIIMathML. When viewing the page in the browser occurs interpretation of this code and the user sees a beautiful formula.
Especially useful is the ability to turn on formulas in TeX-notation [21] — one of the best ways to present mathematics. Many physicists, chemists, mathematicians and programmers are familiar with computer typesetting system LaTeX, which widely used for the production of publications in the scientific world. Learning to use TeX-notation to enter formulas is easy, so as it very comfortable and natural. Many known web sites (eg, Wikipedia) have long use instead of mathematical formulas images, obtained by this technology. MathJax eliminates the preliminary phase of images creation and allows to include TeX-notation of formulas directly into the web pages.
4.2. Markdown and Pandoc
Hypertext documents can be obtained in many different ways, using files various formats, including Microsoft Word, as the source. In recent years, more and more popular becomes approach, in which the source code is created in the Markdown [22], which is converted by Pandoc [23] to html-format. The main advantage of this approach is the possibility of obtaining from the same source code without any additional processing of documents many other formats, including pdf, docx and epub. Pandoc provides and the reverse transformation from a variety of formats to Markdown. Fig. 4 shows some of the most useful from the point of view of the author possibility of this converter.
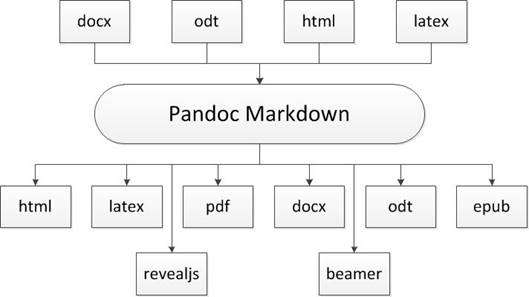
Fig. 4. The most useful features of the Pandoc converter
Markdown markup language was originally designed only as a convenient language for reading and directly editing, from which it is easy to get html. In a series of articles (see, fg, [24,25]), you can find specific suggestions on the use of the language for the preparation of scientific publications and educational materials. Markdown is so simple that one can learn to use it in only 5-10 minutes. As a small example, let the following fragment of the source code of this article:
- implement in CoffeeScript a recursive method that reads these parameters,
and then
- adds the step value to\ $b$;
- makes AJAX-request to the server, which returns the data needed to
visualize of the next schedule;
- calls themselves using the `setTimeout`.
Fig. 5 and 6 show html-version and pdf-version of the resulting document, obtained from it by means of the converter Pandoc.

Fig. 5. HTML-version of the output document fragment
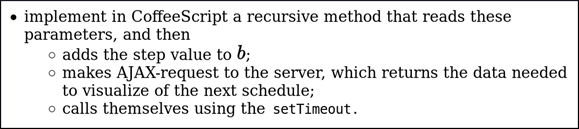
Fig. 6. PDF-version of the output document fragment
The appearance of the converter Pandoc — the library, providing high-quality conversion of documents from a large number of input formats into a wide set of output formats — confirmed the role of a Markdown language as “universal” language for internal representation, because Pandoc can produce documents more than three dozen different formats from the text in Markdown.
Using Markdown and Pandoc in order to obtain a plurality of output documents in various formats from a single source representation can already be considered as a fairly standard approach, although he did not get fairly widespread. A description of all the key ideas of this approach is published, for example, in [26].
4.3. Ruby on Rails as a means of creating the electronic journal
Although all the necessary software is Free, not all are able to install it on your computer. A lesser problem is the requirement of usage Markdown, and a set of mathematics in LaTeX notation, but highly desirable organization of the “transition period”, when the author of the publication can combine the use of new technology with the familiar style of work.
The wide dissemination of scientific materials preparation techniques described above prevents first of all the need to use specialized software. Although all the necessary software is Free, not all are able to install it on your computer. A lesser problem is the requirement of usage Markdown, and a set of mathematics in LaTeX notation, but highly desirable organization of the “transition period”, when the author of the publication can combine the use of new technology with the familiar style of his work.
One way to solve these problems is to create a dedicated web portal based on Ruby on Rails, which can simultaneously serve as a convenient medium for the preparation of scientific materials by authors and site to accommodate the electronic edition of the magazine.
Authors can create a new document on the portal directly from the browser using Ace web editor or upload a document file from his or her computer. One can also upload documents in docx, odt, epub, docbook, html, latex and some other formats. These materials using Pandoc utility will automatically be converted to files on the Markdown language. On the portal may be downloaded and other additional files needed to produce the final document: images, source codes, style files, used in the preparation of hypertext documents.
For each document can be specified required formats of the output file and some additional parameters. These parameters allow modify the document content and its representation. For a pdf-file these parameters allow change, for example, font-size and style of pagination. After the output parameters of the document are set a special rake task starts. It converts source material into output document using Pandoc. Usually it is necessary also to perform some additional operations as before a convertion, as and after it.
One of the reasons, which require additional actions, is the fact that the html-documents with math formulas created by Pandoc converter are incorrect in the following way: non-breaking space in source text before math formula does not give the desired effect. A similar problem occurs when punctuation marks immediately follow math formula.
To solve these and other problems is required a simple post-processor to handle the html-file obtained as a result of the work the Pandoc converter. When building a pdf-version of the documents also there is a need in the postprocessor: LaTeX does not support the inclusion of SVG-images and need to convert them to another format, we should not use syntax coloring code of programs, the documents in russian language, containing accented characters, need in the additional transformation, realized with the following code:
hash = {
'а́' => "\\\\'{а}", 'е́' => "\\\\'{е}", 'и́' => "\\\\'{и}",
'о́' => "\\\\'{о}", 'у́' => "\\\\'{у}", 'ы́' => "\\\\'{ы}",
'э́' => "\\\\'{э}", 'ю́' => "\\\\'{ю}", 'я́' => "\\\\'{я}"
}
puts buf.gsub(/а́|е́|и́|о́|у́|ы́|э́|ю́|я́/, hash)
Availability of source texts in the Markdown language and mathematical formulas in TeX-notation makes it easy to implement a search materials, which contain a given fragment of text or formula. For this purpose can be used the opportunities provided directly by the DBMS PostgreSQL [27]. In the latter case it is also expedient use of the gem-package PgSearch [28].
5. Conclusion
Problems, described in the first two sections of the article, demonstrate the effectiveness of using Ruby on Rails framework for visualization of graphics and text information. This approach allows us to consider only Free Software and in the simplest cases do not require highly skilled developers.
An important practical result is the specific proposals for the realisation of the electronic journal site.
Their implementation will allow for a gradual transition to the use of modern information technologies in the field of preparation of scientific materials, create the favorable conditions for authors of articles for mastering these technologies. This will significantly facilitate the work of editorial staff and will provide to the readers a number of previously unavailable features.
For the implementation of the portal it is proposed to use a well-known method of combining newest achievements in selected areas of information technology. It is also proposed to expand the Markdown markup language in order to obtain a universal representation for the text and to create preprocessor to handle this expanded language. It needs also to implement postprocessor to eliminate defects after operation of the converter Pandoc.
Described technologies to creation of an electronic journal site are used in practice for the preparation of teaching materials. This article is also prepared with using the described technologies.
Creating of electronic journal web site will provide:
· creation by authors without qualified technicians’ assistance their own research materials, which meet modern technological standards;
· dynamic producing, from a single original material source, of documents in more than 30 different formats, including html, pdf and docx;
· usage of the convenient TeX-notation for creating mathematical formulas and for visualizing them in a high quality in most of common formats of output documents; the latter is particularly important for the html-articles;
· adaptive design of html-documents, which facilitates the work via mobile devices;
· the ability to search publications, which contain a given fragment of text or formula.
The author of this work is not aware of the existence of functioning now of websites of electronic journals, which provide for authors and readers a complete list of features listed above. Especially important are the possibility of creating from a single original material source of output documents in various formats, and search articles, containing a given fragment of text or formula.
References
- Ruby on Rails: Web Development That Doesn’t Hurt. URL: http://rubyonrails.org (Accessed 25.08.2016)
- Wan J.H., Zhang Y.W. Design and implementation of the freight forwarding management information system based on ROR. Control Engineering and Information Systems: Proceedings of the International Conference on Control Engineering and Information System, ICCEIS, 2014. pp. 919-922.
- Irribarra D.T., Freund R., Fisher W., Wilson M. Metrological traceability in education: A practical online system for measuring and managing middle school mathematics instruction. Journal of Physics: Conference Series, 2015. vol. 588. no. 1. Article no. 012042.
- Chunling C. Construction of the Individualized College English Learning Management System Using Ruby on Rails. Proceedings of International Conference on Service Science, ICSS, 2016. pp. 160-163.
- Buckler C. 7 Reasons to Consider SVGs Instead of Canvas. URL: https://www.sitepoint.com/7-reasons-to-consider-svgs-instead-of-canvas (Accessed 25.08.2016)
- Perna M.A. Canvas vs. SVG: Choosing the Right Tool for the Job. URL: https://www.sitepoint.com/canvas-vs-svg-choosing-the-right-tool-for-the-job (Accessed 25.08.2016)
- Gordeev D.S. Visualization of internal representation of CLOUD SISAL programs. Scientific Visualization, 2016. vol. 8. no. 2. pp. 98-106.
- Arora S. The 10 Best JavaScript Libraries for SVG Animation. URL: http://noeticforce.com/Javascript-libraries-for-svg-animation (Accessed 25.08.2016)
- Ivanovs A. Top 30 Free jQuery Animation Libraries & Plugins. URL: https://colorlib.com/wp/free-jquery-animations-libraries-plugins (Accessed 25.08.2016)
- JavaScript library. URL: https://jquery.com (Accessed 25.08.2016)
- JavaScript library for manipulating documents based on data. URL: https://d3js.org (Accessed 25.08.2016)
- Cukier J. You may not need d3. URL: http://www.jeromecukier.net/blog/2015/05/19/you-may-not-need-d3 (Accessed 25.08.2016)
- Accelerated JavaScript animation. URL: http://velocityjs.org (Accessed 25.08.2016)
- The regulation of the rating system of knowledge assessment, skills and abilities of students in the BSEU. URL: http://www.bseu.by/russian/student/reyting.htm (Accessed 25.08.2016)
- Website Response Times. URL: https://www.nngroup.com/articles/website-response-times (Accessed 25.08.2016)
- Kushnirenko A.G, Lebedev G.V. Programmirovanie dlya matematikov: Ucheb. posobie dlya vuzov [Programming for mathematicians: manual for schools]. Nauka, 1988. 384 p. [In Russian]
- A library for generating fake data. URL: https://github.com/stympy/faker (Accessed 25.08.2016)
- Profiler for development and production Ruby rack apps. URL: https://github.com/MiniProfiler/rack-mini-profiler (Accessed 25.08.2016)
- Sefton P. Towards Scholarly HTML. Serials Review, 2009. vol. 35, no. 3, pp. 154-158.
- A JavaScript display engine for mathematics. URL: http://www.mathjax.org (Accessed 25.08.2016)
- Typesetting system TeX. URL: https://en.wikipedia.org/wiki/TeX (Accessed 25.08.2016)
- Gruber J. Markdown: A text-to-HTML conversion tool for Web writers. http://daringfireball.net/projects/markdown (Accessed 25.08.2016)
- Pandoc Document Converter. URL: http://pandoc.org (Accessed 25.08.2016)
- Voegler J, Bornschein J, Weber G. Markdown — A simple syntax for transcription of accessible study materials (Conference Paper). Lecture Notes in Computer Science (including subseries Lecture Notes in Artificial Intelligence and Lecture Notes in Bioinformatics), 2014. vol. 8547. pp. 545-548.
- Ovadia S. Markdown for Librarians and Academics. Behavioral & Social Sciences Librarian, 2014. vol. 33, no. 2. pp. 120-124.
- Kielhorn A. Multi-target publishing. TUGboat, 2011. vol. 32. no. 3. URL: https://www.tug.org/TUGboat/tb32-3/tb102kielhorn.pdf (Accessed 25.08.2016)
- Object-relational database management system PostgreSQL. URL: http://www.postgresql.org (Accessed 25.08.2016)
- PgSearch — Ruby gem to take advantage of PostgreSQL’s full text search. URL: https://github.com/Casecommons/pg_search (Accessed 25.08.2016)