VISUALIZATION OF A PRODUCT’S LIFE CYCLES IN THE COMMON INFORMATION SPACE ON THE BASIS OF PROJECT MANAGEMENT METHODS
N.M. Leonova, A.D. Modyaev, V.D. Kolychev
National Research Nuclear University MEPhI (Moscow Engineering Physics Institute), Russian Federation
Contents
3. Visualization of combined models of a product and project’s life-cycle
5. Organization of project designs and usage of visual models by performers
In this article a set of visual models developed by the authors and used in making the concept of industrial enterprises automation is considered. The problems of the integrated information support of the product lifecycle are solved by using the visual analytical methods. The visual modeling technology aimed at the use of flat and 3D-scenes in the formation of design decisions for the development of management and process automation, as well as mathematical modeling and decision support that is built by using the concept of a single information space of an industrial enterprise. By using the methods of visual analytics based on the project-oriented approach to management a set of graph-analytical models used in making the configuration of the integrated information environment of modern industrial enterprise is revealed. In the article, they consider visual models and the possibility of their use in the data, functional and structural modeling, planning and project management of creating integrated information systems. The basis of informational integration of lifecycle stages is a product tree which is produced and most intensively used in the stage of design and technological preparation of production. In this paper presented the experience of application and development of visual analytics models in the process of design and creation of integrated automated systems of enterprise management.
Keywords: Common information space, Project management, Product’s life-cycle, Design management, Project, Visual analysis.
1. Introduction
The application of methods of visual analytics [1,2] is one of the most effective instruments of the system approach to creating unified systems of automation at an enterprise, enabling one to make the common integrated conception of management. [4, 6] The system of visual models, on the one hand, must include all the processes of the product’s life-cycle making the common information space of an enterprise, and, on the other hand, must be used as an instrument of visualization while doing mathematic modeling and giving ground for design decisions on automation. The principles of project-oriented approach to management and also the visual models of projects in the format of network and linear models of the block of work enable one to use the principles of visual analytics when making managerial decisions. On the base of combining models of a product and project’s life-cycles, visual models targeted at increasing the quality, productivity, efficiency and other characteristics of a manufactured product are formed. Visual models of flat and spatial stages (3D models) are a base for creating information models and by means of them projects on product release are formed, processes of design and technological preparation for the production are implemented, integrating designers’ efforts on developing models and prototypes, enabling one to use methods of project management, achieving a successive engineering and changes in the composition of members if necessary.
Authors’ use of developed software tool for planning and managing a product’s life-cycle processes and the application of automated designing systems at the stage of design-engineering preproduction enable one to form a set of visual models and aids enhancing the effectiveness of made decisions during the design implementation.
A description of the conception of combining models of a project and product’s life-cycle by means of visual methods is aimed at creating automation technology of planning operations and management of work phases on the basis of standard design decisions and authoring software tool.
In particular, visual models are developed for the presentation of information during the project implementation in the format of Gantt diagrams, such as a schedule of execution phase, a schedule of loading work equipment, performers’ professions, working models in the format of Workflow, and visual models of a product’s life-cycle targeted at optimizing the processes of management.
2. Visual analytics models for the automation of products’ life-cycle management at industrial enterprises
Visual analytics models are used at all stages of a life-cycle of a manufactured science intensive product.
Information created at all stages of a life-cycle is highly dissimilar and manifold. At the same time digital information models are transformed into visual analytical models by means of application of special program products and exchange formats of information export and import , for instance, the standard STEP [12].
Sharing of a great amount of dissimilar information leads to the necessity of creating the common information space with the usage of a set of data systems automating industrial processes.
Herewith, it should be noticed that stages of products’ life-cycle connected with the concept formulation, designing, creation of test models and dummies of products are the most important regarding management, and a majority of visual analytical methods is mainly used at the stage of design-engineering preproduction. A basic means of creating the common information space at an enterprise is PDM – a system concentrating information and at the same time being a workspace for designers, production engineers, planners, engineers of the departments of design rule management, metrology etc., enabling one to manage design processes of a product, as well as to use visual models at the stages of science intense products exploitation, see fig. 1.
Within the framework of preproduction processes, a series of SAPR is used, enabling one to transform information from a digital form into a visual presentation with the purpose of meeting customers’ demands and co-design.
Any automated system introduced at an enterprise needs updating and adjustment, which also apply to visual methods and models of data presentation (classifiers, a list of materials, organizational structure, reference books, workflow samples, and a structure of products).
According to the authors, in most domestic PDM-systems, the functions of scheduling, cost and resource planning are insufficiently developed, as well as mechanisms of workflow management, taking into account vagueness of projects on new technologies and forecast of new NIOKR results implemented at enterprises.
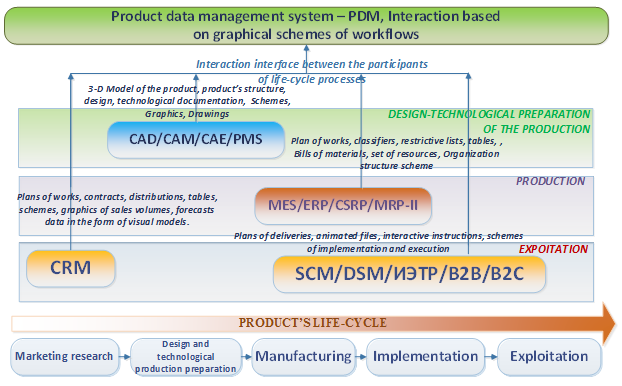
Fig. 1. Visual model of data presentation and integration at all stages of a life-cycle
Consequently, mechanisms of visualizing resource diagrams, charts of using equipment and production personnel turn out to be in high demand in modern plant conditions [34]. It appears possible to incorporate developed decisions on visualizing project data as outer supplements by means of API-interfaces into the product data management system for the purpose of working out an integrated decision.
Domestic experience in automating plants indicates that “island-type” automation, which partly includes some stages of a product’s life-cycle, is characteristic for modern conditions, and at the same time the development of integrated decisions is still not widely spread.
In this article, it is offered to use a software tool and visual models for developing decisions on the automation of products’ life-cycle on the basis of a project-oriented approach to management.
3. Visualization of combined models of a product and project’s life-cycle
Methods of visual analytics [1] enable one to structure the stages of a product and project’s life-cycle [3,5], revealing the processes of manufacturing high-tech products. Fig. 2 shows a scheme of a visual analysis, revealing the technology of project management at an enterprise, which is realized on basis of a closed scheme with a reverse connection of input and output, within the framework of which vertical processes of a product’s life-cycle overlap horizontal processes of a project’s life-cycle.
A customer’s demands, parameters of released production, as well as a product and project’s life-cycles are the initial data for the visualization.
On the basis of the given scheme, the processes of preproduction management, product release, modernization, as well as updating of samples of a new technique are realized. A visual model presented in picture 2 enables one to represent a closed cycle of designing and production and to consider an end-to-end cycle of designing and manufacturing, achieving a pregiven level of quality and characteristics of manufactured products.
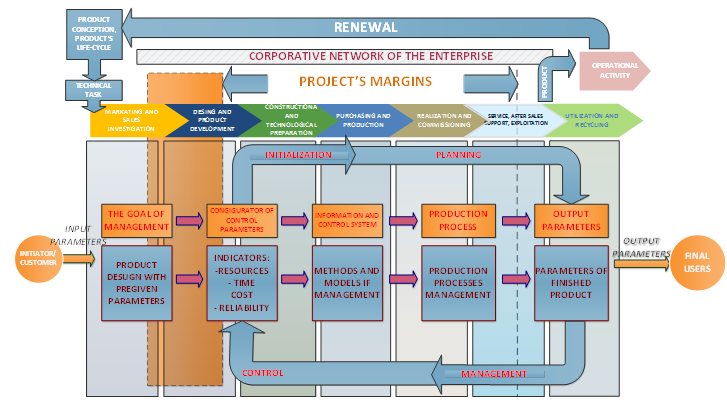
Fig. 2. Schematic visualization of the production management in the common information space of an enterprise
Using a visual model of the initial data, it is possible to work out principles and approaches to solving the tasks of managing the production parameters, taking into account the requirements of quality management of released products, reduction in periods of preproduction, and considering the adaptation of production line to the customers’ demands in market conditions. It is possible to form the production project management by means of combining models of a product and project’s life-cycles.
Fig. 3 visualizes a model of combined processes of a product and project’s life-cycles.
Using the project characteristics as a control object, depicting them as structural, temporal, cost and resource parameters, laying the processes of a product’s life-cycle on the project processes by means of geometric combination, a visual model presented in picture 3 graphically enables one to show a process of designing a science intensive product and to form approaches to the configuration of automated recurring process of design.
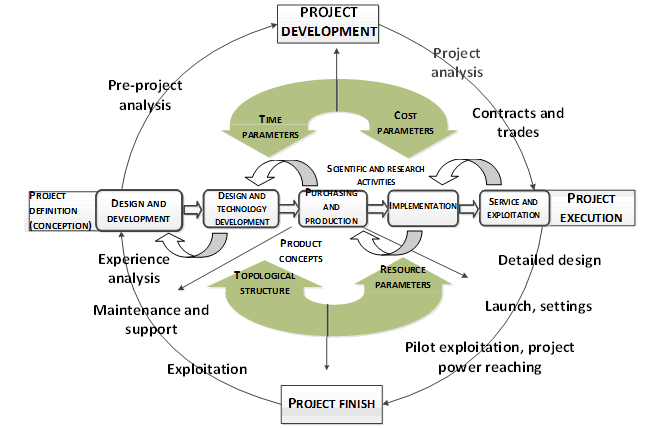
Fig. 3. Visual model of a product and project’s life-cycle
Within the framework of a project-oriented approach to management, it is possible to visualize a recurring process of design, which is influenced by temporal, cost, topological and resource project parameters. A recurring process of design leads to creating a visual Spiral model of a life-cycle [7], which visualizes a multilevel structure and a presence of multiple product versions (prototypes) presented in fig. 4. A Spiral model of a life-cycle is used for visualizing effects caused by the creation of high-tech science intense products.
Parameters of spiral turns characterize processes of a life-cycle, letting one consider the accumulated experience in design and modeling of business processes at previous stages and to achieve the reduction in design time of projects by using resources, savings costs, applying results of risk analysis, revising, adapting a product design, taking into account customers’ and marketing demands.
By means of a visual analysis, a spiral model is transformed into a two-dimensional model shown in fig. 5. The transformation of a Spiral model of a life-cycle into a two-dimensional picture is implemented on the basis of presenting the Spiral in polar coordinates [7]. With this purpose, a logarithmic spiral is used, the turns of which are placed at the same distance from each other. Within the scope of each spiral turn, the functions shown in fig. 5 are realized and with the purpose of reflecting the recurrence of design, characteristic for a spiral model, a reaction coupling, which models a closed cycle with the account of created intangible assets, is added into the linear network. The functions are implemented with the account of “staging” of a product’s life-cycle and the data created within the scope of design work are used at each separate stage, fig. 5. A visual analysis is carried out by means of matching spiral turns representing design work with the stages of a product’s life-cycle. In this case, visual analytics methods imply the transformation of polar coordinates into the rectangular coordinate system. The given visual transformation reveals an opportunity to optimize life-cycle stages according to temporal, cost and resource parameters. In this case, a polar radius and an angle circumscribing a project’s life-cycle have a visual geometric interpretation of a product’s life-cycle parameters.
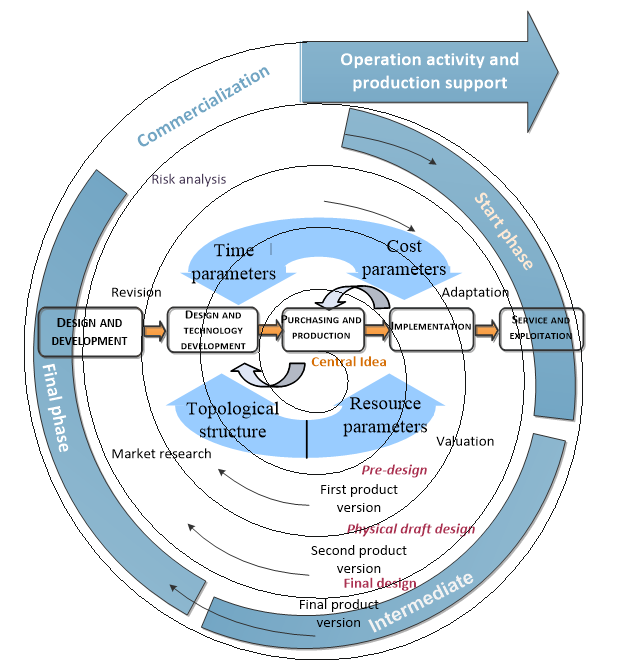
Fig. 4. Visualization of a Spiral model of a product’s life-cycle combined with a project’s life-cycle model
A model of a project’s life-cycle forms data flows influencing the design and used in successive processes of a product’s life-cycle, establishing, thus, a visual matching between two models. The scheme shown in picture 5 enables one to specify data flows generated at different stages of a life-cycle in details, revealing the functions implemented by the integrated production system within the scope of the common information space of an enterprise presented in picture 1.
A two-dimensional picture, which represents data communication between the stages of a product and project’s life-cycles, is used as a visual method.
Taking into account geometrical models of combined products and projects’ life-cycles, considering peculiarities of organizing mutual workspace of project development, creation of the common information space at an enterprise and standard work models implemented at the stage of design-engineering preproduction, a geometrical model of reducing a project’s life-cycle is worked out [13, 14, 19] and presented in picture 6.
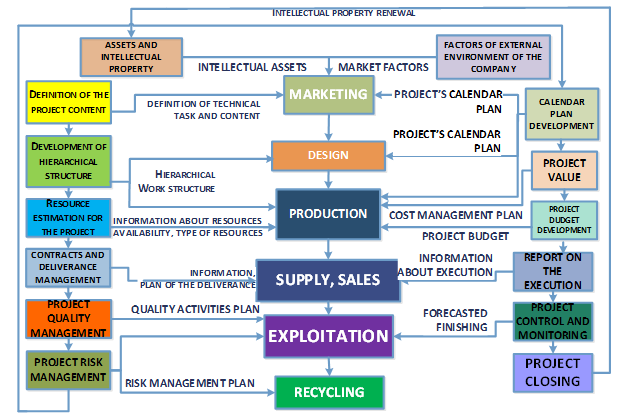
Fig. 5. Visualization of a two-dimensional model of a product and project’s life-cycles by means of project management methods
Visualization of models of performers’ work in the common information space of an enterprise enables one to show geometrical interpretation of an effect caused by the reduction of duration of a product’s life-cycle.
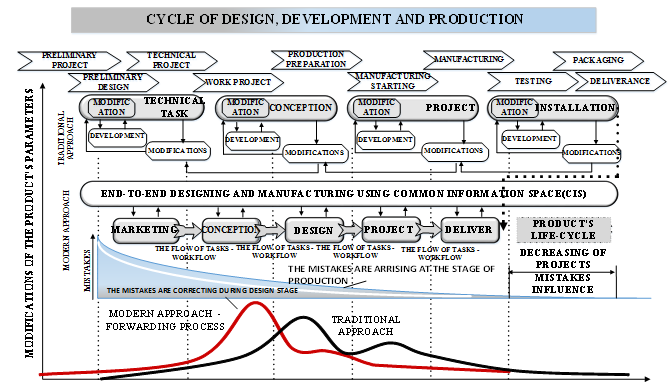
Fig. 6. Visual scheme presenting the reduction of a life-cycle by means of the production management and planning
The traditional scheme of the design implementation is presented above in fig. 6, and the organized modern scheme of a product’s life-cycle management is presented below.
By means of the automation of the project management at the stage of design-engineering preproduction according to the temporal, cost and resource parameters, it turns out to be possible to start the stages of a product’s life-cycle at earlier periods of time [3]. The reduction of a product’s life-cycle duration, as it can be seen in fig. 6, takes place due to the combination of design and engineering preproduction stages, using the earlier created project decisions on production prototypes, realizing the combination of a product and project’s life-cycles in practice, initiating Workflows (at each stage), forming the tasks and conforming the documents in an electronic form on the basis of the common information space. Thus, the creation of integrated production system makes it possible to reduce the influence of project mistakes on the processes of manufacturing science intensive products and to reduce a product’s life-cycle duration (life-cycle curve moves to the left with respect to a previous position by using tools and project management systems).
4. The application of visual models during the project decisions on the creation of the common integrated information system of an enterprise taking
Information modeling of the project decisions on the creation of integrated infomedia of an enterprise taking is presented in fig. 7 in the format of a two-dimensional picture (scheme).
A visual model of project decisions is based on a stellar centralized structure including a common database of an enterprise, which is a core of an integrated system, providing information interoperability between the participants of production processes.
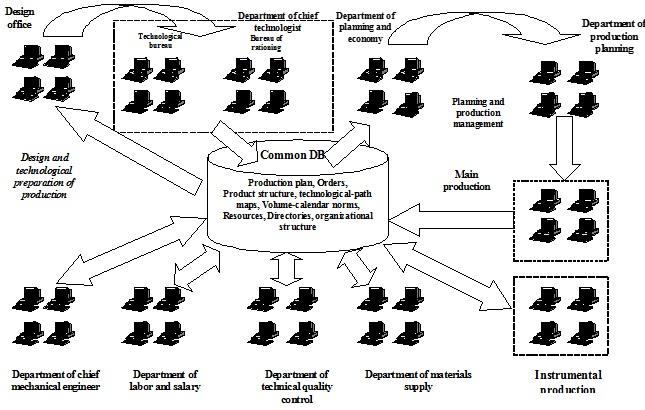
Fig. 7. A generalized visual model of the common integrated infomedia of an enterprise
The detailed visual model of the common integrated infomedia of an enterprise enables one to work out a system approach to the interaction between the departments of a plant on the basis of a project-oriented approach and the use of the common data warehouse, including visual models, diagrams of production, drawings, schemes and tables.
A geometrical model of the tree of product structure presented as a graph in fig. 8 is a basis for data integration in the common information space of an enterprise. The given model plays a crucial part at the stage of design-engineering preproduction, which is the most important stage of a product’s life-cycle. With the help of methods of visual analytics, it is possible to represent the differences between the design and technological structures of a product, and this allows quickening designers and technologists’ work on the development of project decisions concerning the production prototypes.
The tree of product structure consists of assembly units, installations etc.
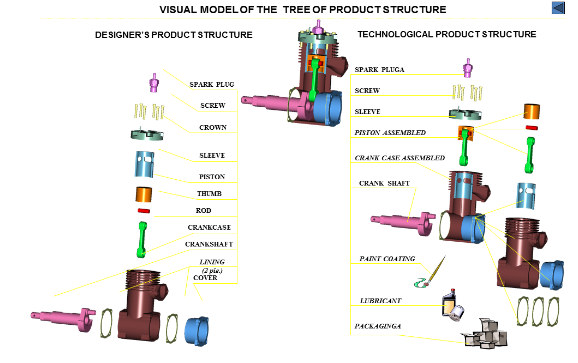
Fig. 8. Geometrical model of a product in the format of the tree of design and technological structures
Having formed the visual model of the tree of production structure, see fig. 8, one can start visualizing the work package of design and production processes presented in the format of a network alternative model of a life-cycle (a column with alternative structure) presented in fig. 9. In the sequel, a network model of a life-cycle is transformed into a visual representation in the format of linear Gantt diagram used during the management of terms, times, resources of production projects.
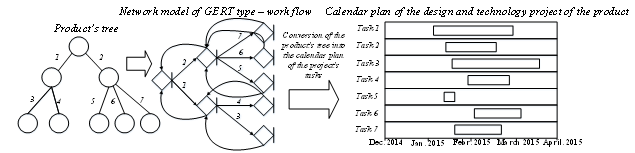
Fig. 9. Geometrical model of transformation of the product tree into the project schedule
Visual models of a product’s life-cycle in the form of a graph with ordered events have a special structure [5, 11] established on the basis of topological (spatial-structural) parameters of a project work package and allow one to solve the tasks of optimizing temporal, cost and structural characteristics of the production processes.
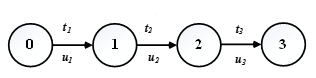
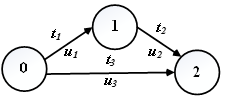
In fig. 10a and 10b, the visual models of a product’s life-cycle are presented in the format of an oriented graph for the successive and series-parallel position of stages [9].
|
|
|
|
Fig. 10a. Visual model of a product’s life-cycle in the form of a two-dimensional picture, an oriented graph (chain type) |
Fig. 10b. Visual model of a product’s life-cycle in the form of a two-dimensional picture (“graph with ordered events”) |
Having used a visual model of a product’s life-cycle in the format of an oriented graph, we can build a workpackage spatial structure (created by many full lines in the graph of a life-cycle) and the regions of feasibility for solving the tasks of reducing the costs of the project workpackage [18] on conditions that design implementation is limited in terms. Let us take the following ratio Cu(tu)=au−butu, as an expenditure function of the implementation of an operation u, where au is a cost level of the work u, bu is a cost for accelerating the work u by time unit, tu is duration of an executive phase tu.. Solving the optimization task by means of a geometrical model of a life-cycle in the format of a two-dimensional picture as initial data, see schemes 10a and 10b, we shall get visualization of feasible regions of the linear programming task [9, 21, 22, 23], see fig. 10a and 10b. Picture11a corresponds with the life-cycle structure presented in fig. 10a of an oriented graph with a chain structure and picture11b of ordered events, see fig. 10b.
|
|
|
|
Fig. 11a. Visual model of feasible regions for a chain life-cycle graph |
Fig. 11b. Visual model of feasible regions for a graph of ordered events |
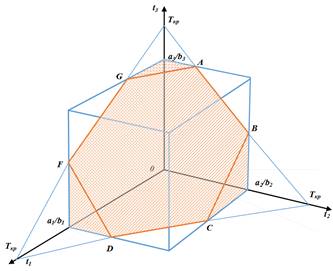
Geometrical models of feasible regions enable one to get the rate of dependence of project work package costs on the duration of a critical path for both variants of life-cycle visual structures.
The dependency ratio is presented as (1) for the visual model of a chain life-cycle and the dependency ratio (2) is obtained for the model of a life-cycle with transitive arcs (showing auxiliary life-cycle processes).
The development of project decisions on the creation of integrated data management system at an enterprise [14, 20] is implemented by means of the visual model in fig. 12.
Combining the stages of a product and project’s life-cycles and taking into account the criteria of effectiveness, the process of creating the common information system on the basis of the project management begins [25, 26, 27, 28].
Basing on the methods and technologies of designing the program systems, it is necessary to take into account the criteria of effectiveness, which enable one to define the most rational variant of forming the integrated automated production system built on basis of optimization principles and acquisition of the best characteristics of designed production. Fig. 12 shows the process of combining the highlighted stages of a life-cycle of a project on the creation of automated system of design-engineering preproduction with the stages of a product’s life-cycle. At the stages of a product’s life-cycle, it is necessary to take into account the criteria of effectiveness specifying target directions of the production development and improvement. Having correlated the life-cycle stages with the criteria of effectiveness, it is possible to formulate the requirements for the creation of integrated automated system of managing the stages of design-engineering preproduction and to start the design process with the application of methods of project-oriented management, considering such work conditions as the connection of program interfaces, scalability, portability, adaptation and expansibility of offered approaches and project decisions.
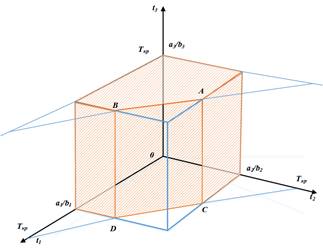
The two-dimensional visual scheme in fig. 12 is transformed into the spatial scheme, showing made decisions and formulation of the optimization task of choosing the configuration of integrated information system, see fig. 13.
The introduced scheme of indicators in fig. 13 enables one to formulate an approach to forming a model of optimizing project decisions on creating the integrated system of design-engineering preproduction.
Taking into account the stages of a product’s life-cycle, considering the criteria of effectiveness shown in fig. 12, we visualize a variation region of consequential and inconsequential losses, the ranges of which define acceptability of obtained project decisions on the creation of the automated information management system.
The variation ranges enable one to make decisions, considering the demands of transferability of projects to other kinds of production system, forming them with the account of acceptable temporal, cost and resource parameters.
Creation of architectural project decisions on the formation of the common integrated information management system at an enterprise is implemented on the basis of the visual model, see fig. 13.
As it follows from the visual model, see fig. 13, the criteria of effectiveness are grouped according to the system principles and form an integral criterion, which defines the ways of automating preproduction processes management on the basis of the concept of a product’s life-cycle. Thus, the visual model gives an idea of a possibility to vary the indicators of effectiveness in the given ranges with the purpose of making rational decisions on the automation.
Basing on the introduced indicators of effectiveness, considering the requirements and limitations imposed on the production processes with the application of optimization methods and project management, visual regions of varied indicators are formed and rational required variants of project decision making are contained in their defined ranges.
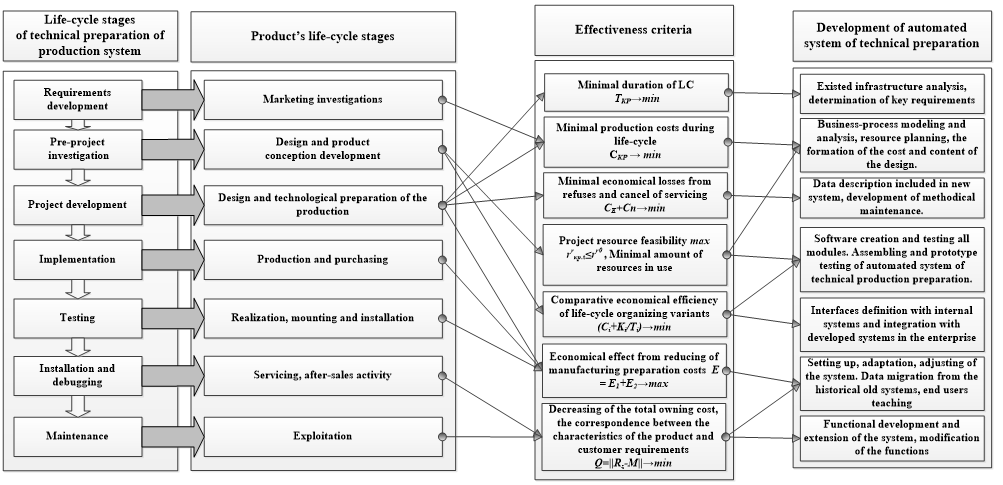
Fig. 12. Visual model of making project decisions on the creation of the integrated information system on the basis of effectiveness criteria
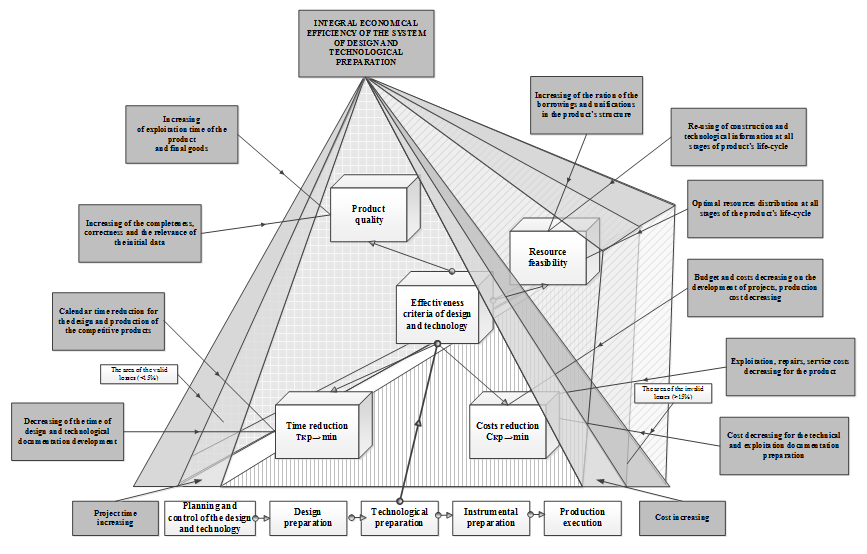
Fig. 13. Visual model of a system indicating the effectiveness of a product’s life-cycle processes
5. Organization of project designs and usage of visual models by performers
On the basis of visual models of developing the project decisions and the system indicating the effectiveness of a product’s life-cycle, see picture 13, a geometrical model of building an integrated decision is worked out, considering the informational and organizational interaction of performers, fig. 14.
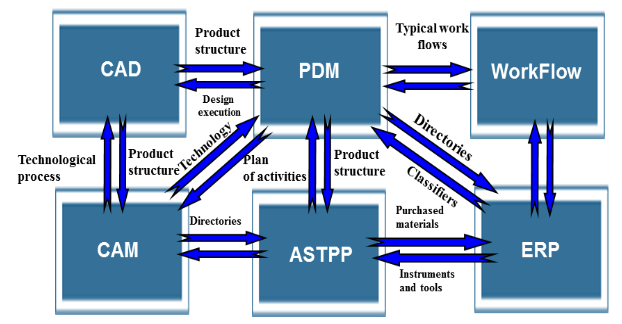
Fig. 14. Visual architecture of the integrated decision on the automation of processes
Interaction of performers is realized on the basis of exchanging the data on a product’s structure, reference books, technological processes, operating plans, purchase products and tools by means of the application programs and the standard automation decisions such as CAD and CAM systems.
By means of a designer and technologist’s automated design systems, the production models in the format of spatial scenes (3D-models) are worked out, see fig. 15.
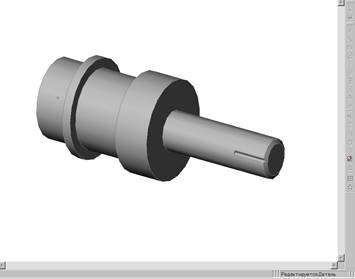
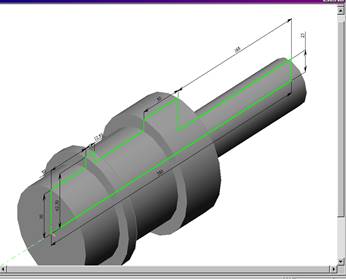
Fig. 15. Geometrical model of a product (3D-model)
Geometrical models of products are stored in the data management system and available to all the participants of design processes with the account of adjustable parameters of an access. Taking into account the workflows generated during the preproduction, it is possible to maintain versioning of documents, drawings, schemes and tables.
The tree of production structure is formed on the basis of visualizing a product’s model in the form of a three-dimensional scene, see fig. 16. Here, visualization of each component (junctions) in an assembly structure is necessary.
By means of exchange formats STEP or specially made converters, automatic transfer of the tree of production from SAPR system to the system of the product data management is possible. This means that a visual model is transformed into the format of data exchange file, and further it is used for the production project management.
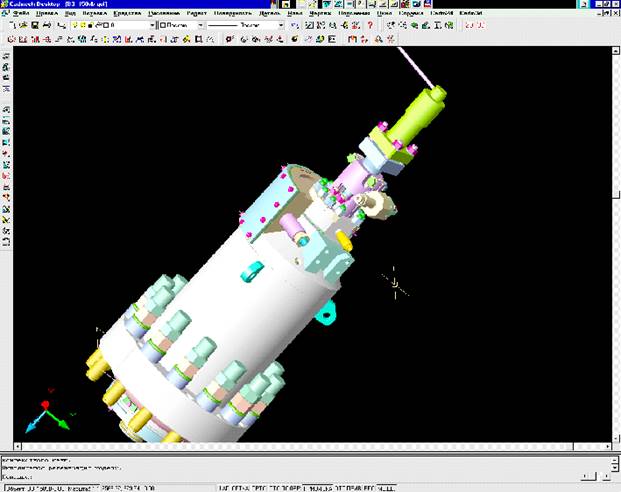
Fig. 16. Visual model of a complex product (assembly)
With the purpose of implementing a design-engineering stage of preproduction, a workflow on the creation of a complex product’s component is organized. The structure of workflows is shown in the form of a two-dimensional picture – an oriented graph, presented in fig. 17.
Interaction between performers is realized on the basis of cooperative work, as well as doing the tasks on projecting of design or technological documentation distributed according to the specialists’ professionalism and the tree of production structure.
The visual model of production management by the example of a design-engineering department of a pilot plant is presented in the format of a two-dimensional scheme, fig. 18. Standard work models TMP are created in the format of visual models and stored in the common data base of the preproduction management.
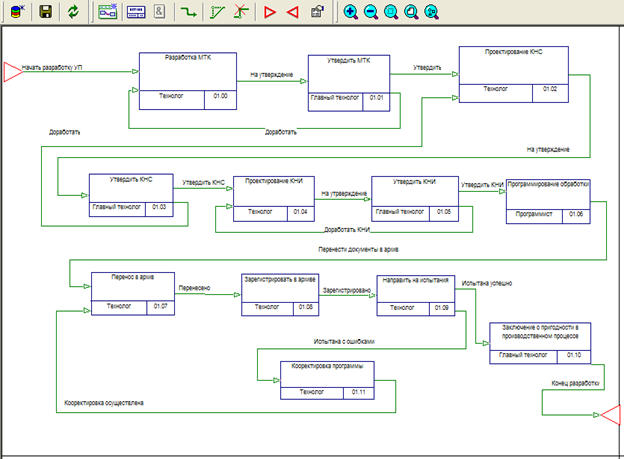
Fig. 17. Visual model of the production workflows
The models of workflows are designed on the basis of business-process models constructed within the scope of preproject analysis of an automated object, as a rule, on the basis of the modeling Workflow-IDEF 3.
An element of the workflow is called action, which is connected with other actions and can be implemented several times, depending on the logical conditions or the peculiarities of processes of manufacturing particular products.
Visual models of workflows represent an oriented graph with cycles standing for actions (tasks) repetition, herewith performers’ appointments are given in actions and a particular performer is determined at the stage of the model realization.
It should be pointed out that a majority of workflows, which automate different business-processes, see picture 18, is formed at an enterprise, which corresponds to the creation of the best practice bases and highlighting of graphic schemes accumulating the experience from manufacturing science intensive products at an enterprise, which contribute to portability, adaptation and adjustability of project decisions to a particular customer’s demands.
Fig. 18 represents a majority of workflow models describing the performers’ interaction with the usage of a project principle of the design management.
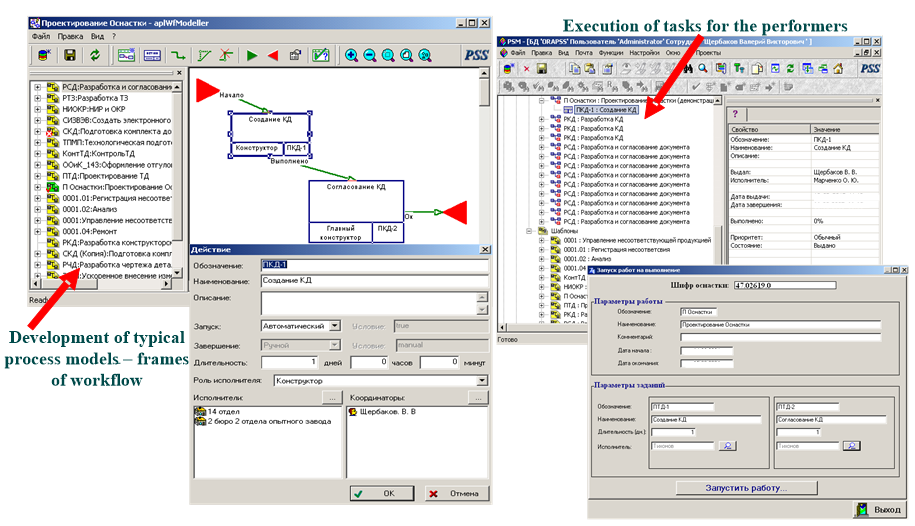
Fig. 18. Visual model of design-engineering preproduction management
Collective development of projects on the creation of high-tech production with the application of the common information space and visual methods enables one to increase a part of adoptions in a product’s structure and by means of workflow models to reduce the lead time, the costs of creating design and technological documentation, maintenance of a single classifier of resources, materials, tools etc.
Visualization of information about the load of resources with regard to the professional performers is available to all the participants of the preproduction at all stages of a product’s life-cycle, see fig. 19.
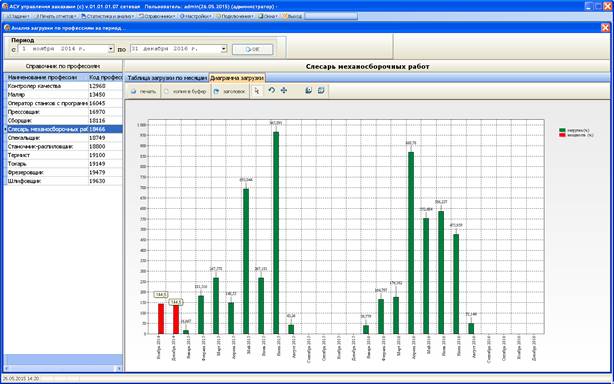
Fig. 19. Visual model of chosen loaded resources
The given visual model is used for tracing the most loaded and often used resources by professional performers with the purpose of their timely relocation for the execution of the most urgent tasks and minimization of lead time.
Visual model of loading the production equipment used during the production processes is presented in fig. 20.
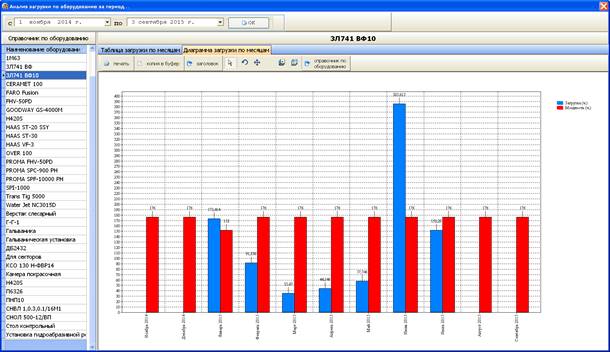
Fig. 20. Visualization of loading the equipment
Visual analysis enables one to define which equipment is overloaded and to identify the most loaded units of technique with the purpose of timely planning and managing rare and expensive resources.
Linear Gantt diagram [10, 24], which is used during the production planning, enables one to visualize temporal indicators of work packages, taking into account logical interconnection and job sequencing, see fig. 21.
Visual project models, schedules, information about load of resources, operation costs are formed by means of software applications, which are developed by authors and solve the tasks of network optimization, distribution of limited resources as well as schedule cost planning, taking into account the indicators of effectiveness highlighted in fig. 12 and 13.
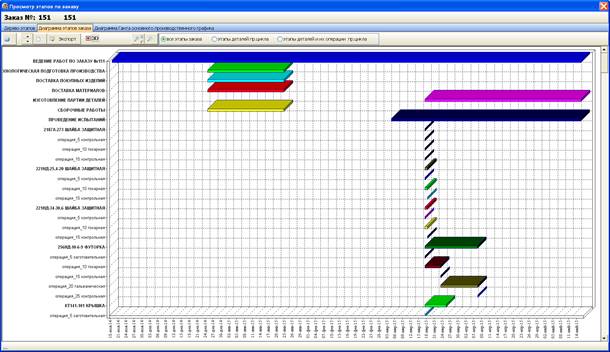
Fig. 21. Visual model of project work package (job order) in the format of linear Gantt diagram
Formation of the complex visual models of products’ life-cycle management enables one to select necessary instruments of visual analysis and to include them into an integrated decision on the automation of enterprises on the basis of modern principles of the project management, business-modelling, optimization and decision making for increasing the effectiveness of creating new technique in the work of R&D (research and development) formats.
6. Conclusion
In this article, visual models are presented, which are used for creation of the integrated production systems aimed at the application of a project-oriented approach to management. Visualization of a product and project’s life-cycles allows one to implement their geometrical combination, highlighting from the point of management essential parameters and characteristics of studied processes. On the basis of the methods of visual analytics, there is an approach to solving the tasks of analyzing the products’ life-cycles according to the temporal, cost and resource parameters as well as considering the structural peculiarities of production work packages. Architecture of integrated decisions in the common information space of an enterprise is created on the basis of visualizing the design process with the application of a project-oriented approach. The tree of production structure, which is created and frequently used at the stage of design-engineering preproduction, is a basis for informational integration of stages of life-cycles. The application of visual models in the format of flat and spatial scenes enables one to organize co-design, to define parameters of manufactured products and to prepare the workflows aimed at automating the preproduction and production.
Getting information about loads of performers and equipment in the format of visual models, the methods of visual analytics are used, enabling one to manage the production, achieving quality of products, taking into account limits on available resources and cost of operations.
References
1. Pilyugin V.V. Komp'juternaja geometrija i vizualizacija [Computer geometry and visualization]. MEPhI, 2005. 120 p. [In Russian]
2. Modjaev A.D., Leonova N.M., Filatov A.S., Shabynin A.A. Metodika vizualizacii polej gamma-izluchenija v pomeshhenii [Methods of gamma imaging of the radiation fields in the room]. Scientific visualization. 2014. no. 3(6). pp. 87-95. [In Russian]
3. Kolychev V.D., Rumjancev V.P. Sistema vizual'nyh modelej upravlenija proektami [Visual system of project management models]. Scientific visualization. 2014. no. 3(6). S. 14-54. [In Russian]
4. Kolychev V.D., Prokhorov I.V. Application of road mapping for hi-tech projects commercialization in corporate innovative entrepreneurship. Ecology Environment & Conservation, 2014, vol. 20(4). pp. 1895-1906.
5. Kolychev V.D., Rumyantsev V.P. Specificity of the product's life-cycle management models. Non-ferrous metals, 2014, vol. 2. pp. 3-7.
6. Kolychev V.D., Prokhorov I.V. Conception, technology and methods of development of university system of innovation projects commercialization based on effectuation. Asian Social Science, 2015, vol. 11 (8). pp. 44-51. (DOI: 10.5539/ass.v11n8p44).
7. Fedorova A.V., Tarasov V.B., Vetrov A.N. Granuljacija informacii pri modelirovanii zhiznennogo cikla slozhnyh tehnicheskih sistem [Granulation information for modeling the life cycle of complex technical systems]. Naukovedenie. 2013. no. 5. pp. 53-57. [In Russian]
8. Kolychev V.D., Rumyantsev V.P. Procedure of Equivalent Enlargement and Aggregation of Product's Life-cycle Network Model. Ecology Environment & Conservation, 2015, vol. 21 (S). pp.87-98.
9. Kolychev V.D. Parametricheskij analiz zhiznennogo cikla izdelija po kriterijam vremja-stoimost' [Parametric Analysis of the product by the criteria of the time, life-cycle costs]. Economy Industry. 2015. No. 1 (25). Pp. 70-76. [In Russian]
10. Kolychev V.D. Programmnaja realizacija vizual'nyh modelej upravlenija proektami [Software implementation of the visual project management models]. Modern problems of science and education. 2014. No. 3. Pp. 56. http://www.science-education.ru/117-13219. [In Russian]
11. Kolychev V.D., Rumjancev V.P. Ob osobennostjah matematicheskih modelej polnogo zhiznennogo cikla innovacionnyh izdelij [On peculiarities of mathematical models of the full life cycle of innovative products]. Integral. 2012. No. 1. Pp. 50-51. [In Russian]
12. Sudov E.V. Integrirovannaja informacionnaja podderzhka zhiznennogo cikla mashinostroitel'noj produkcii. Principy. Tehnologii. Metody. Modeli [Integrated information lifecycle support of engineering products. Principles. Technologies. Methods. Models.]. Publish house MVM, 2003. 264 p. ISBN 5-98136-019-4. [In Russian]
13. Nikiforov A.D., Bakiev A.V. Processy zhiznennogo cikla produkcii v mashinostroenii [Product realization in Mechanical Engineering]. Abris, 2011. 688 p. ISBN 978-5-4372-002-5. [In Russian]
14. Romashov A.V., Baranov V.V. Strategii razvitija nauchno-proizvodstvennyh predprijatij ajerokosmicheskogo kompleksa: Innovacionnyj put' [Strategy of development of scientific and industrial enterprises of aerospace complex: Innovative way]. Al'pina Pablisherz, 2009. 215 p. ISBN 978-5-9614-1077-8 [In Russian]
15. Andreev E.B., Kucevich I.V., Kucevich N.A. MES-sistemy: vzgljad iznutri [MES-systems: the inside story]. Publish house "RTSOFT". 2015. 240 p. ISBN 978-5-903545-21-6/ [In Russian]
16. Reshetnikov I.S., Kozlecov A.P., Medvedeva G.M. MES - teorija i praktika. Vypusk 3 [MES - theory and practice. Issue 3] (2011). Official materials MESA International Association. 2011. 98 p. ISBN 978-5-9902917-1-3. [In Russian]
17. Reshetnikov I.S., Kozlecov A.P., Medvedeva G.M. MES - teorija i praktika. Vypusk 6 [MES - theory and practice. Issue 6] (2013). Official materials MESA International Association. 2013. 112 p. ISBN 978-5-9903747-5-1. [In Russian]
18. Kozlov V.N. Sistemnyj analiz, optimizacija i prinjatie reshenij: uchebnoe posobie [System analysis, optimization and decision-making: a tutorial]. Prospekt, 2016. 176 p. ISBN 978-5-392-20185-3. [In Russian]
19. Potasheva G.A. Upravlenie proektami (proektnyj menedzhment): uchebnoe posobie [Project Management (Project Management): a tutorial]. INFRA-M, 2016. 224 p. http://www.dx.doi.org/10.12737/17508 [In Russian]
20. Pavelek G. Kompleksnoe planirovanie promyshlennyh predprijatij: Bazovye principy, metodika, IT-obespechenie [Integrated planning of the industrial enterprises: Basic principles, methodology, IT Software]. Al'pina publisher, 2015. 366 p. ISBN 978-5-9614-4627-2. [In Russian]
21. Mikoni S.V. Teorija prinjatija upravlencheskih reshenij: Uchebnoe posobie [The theory of management decision-making: A Tutorial]. Publish house "Lan'", 2015. 448 p. ISBN 978-5-8114-1875-6 [In Russian]
22. Prosvetov G.I. Matematicheskie metody i modeli v jekonomike: zadachi i reshenija: uchebno-prakticheskoe posobie [Mathematical methods and models in economics: challenges and solutions: teaching practical manual]. 2nd ed., Rev. Alfa-Press 304 p. ISBN 978-5-94280-664-4. [In Russian]
23. Nabatova D.S. Matematicheskie i instrumental'nye metody podderzhki prinjatija reshenij [Mathematical and instrumental methods of decision support]. Jurajt, 2015. 292 p. ISBN 978-5-9916-5188-2. [In Russian]
24. Kolychev V.D. Planirovanie i analiz innovacionnyh proektov s ispol'zovaniem setevyh modelej s al'ternativnoj strukturoj [Planning and analysis of innovative projects using network models with an alternative structure]. Natural and Technical Sciences. 2012. No. 1. P. 278-284. [In Russian]
25. 12207-2008 - ISO/IEC/IEEE Standard for Systems and Software Engineering - Software Life Cycle Processes. http://ieeexplore.ieee.org/servlet/opac?punumber=4475822 [accessed 02.07.2016].
26. 15288-2008 - Systems and software engineering System life cycle processes. http://ieeexplore.ieee.org/servlet/opac?punumber=6093921 [accessed 02.07.2016].
27. Behrens W., Hawranek P.M. Manual for the preparation of industrial feasibility studies. Newly revised and expanded edition. United Nations Industrial Development organization. Vienna. 1991. Pp. 386.
28. A Guide to the Project Management Body of Knowledge (PMBOK Guide). Fourth Edition USA, Project Management Institute, 2008.
29. Kolychev V.D. Program system for the analysis of innovative product lifecycle. The certificate of registration of the computer program number 2014613572, 28.03.2014. [In Russian]
30. Kolychev V.D. Software system calendar resource planning innovative projects (TSR Planner). The certificate of registration of the computer program number 2014611524, 19.05.2014. [In Russian]
31. Kolychev V.D. The software system analysis and planning projects with an alternative structure. The certificate of registration of the computer program number 2012613420, 11.04.2012. [In Russian]
32. Kolychev V.D. Program system for solving network optimization (NetOptim). The certificate of registration of the computer program number 2011613776, 16.05.2011. [In Russian]
33. Kolychev V.D. Packet analysis and optimization projects on time, cost and resource parameters (Project Optimization Software Tool). The certificate of registration of the computer program number 2011613606, 10.05.2011. [In Russian]
34. Gorohov V.A., Beljakov N.V., Shirtladze A.G. Smith design sites and shops: a textbook. INFRA-M, 2015. 540 p. [In Russian]