A well-known definition of visualization is the mapping of
initial data to a visual representation, which can be perceived and interpreted
by humans. Human senses include not only vision, but also hearing, sense of
touch, smell and others including their combinations.
We discuss in this article multisensory scientific visualization,
in other words scientific visualization extended with sound, haptic and other
sensory stimuli, related fields and concepts such as visualization,
sonification and perceptualization, and geometric modeling using real
functions.
The formalization of the multisensory analysis process and
particularly of establishing correspondences between the initial data and
multiple sensory stimuli (mapping process) is an open research question. In
this article, some generalizations based on using real-valued vector functions
for solving data analysis problems by means of perceptualization in the area of
multisensory mapping are proposed. These generalizations might be considered as
a formalization of the correspondence between the initial data and different
sensory stimuli. A formalization of different sensory stimuli analysis and
interpretation of the results according to initial data is also an open
research issue. In this article, some results were obtained for audio analysis
interpretation of scalar fields, and approaches mainly based on musical theory
and used by musicians for musical composition analysis were proposed for the
case of visual-auditory multidimensional scalar fields analysis.
A special case study of a scalar field analysis using
scientific visualization extended with such sensory stimuli like sound is
presented. Both mapping to sound and further ways of sound analysis by
researchers for this case are described in detail.
Visual analysis of graphical representation of data has
practically become a part of modern scientific research. It should be taken
into consideration that researchers, as all people of creative professions, are
predisposed to spatial creative thinking, so in the process of analysis of
scientific data, they usually readily refer to various spatial and graphic
images. This is one of the reasons, why scientific visualization as a method of
data analysis has proven to be a very efficient tool often used by researchers.
At the early stages, the main function of the visual data
analysis was to obtain a limited number of responses to the posed questions,
but today we very often search for hidden information in big amount of data.
The growing complexity and amount of raw data require expanding the means of
scientific visualization, involving multimedia, virtual and augmented reality,
tactile and haptic devices, 3D printing and other means of information
representation for human perception and analysis. This expansion requires
involving other human senses besides vision.
Visualization informally can be understood as making
invisible visible, but more formally it can be defined as the process of
transforming data into a visual form enabling viewers to observe and analyse
the data [1]. Scientific visualization software tools and techniques are used
in various scientific disciplines to form certain judgments on the basis of the
obtained data. Through applying analytical reasoning facilitated by visual
interfaces, hypotheses about the data can be either confirmed or rejected
leading to a better understanding of the data [3].
A more general definition of visualization is "a
binding (or mapping) of data to a representation that can be perceived" [4]
is used more often nowadays and thus visual analysis is extended to become
multisensory analysis.
Visualization process is the one that is the most well
studied and formalized. The above mentioned paper [3] introduces its formal
description as a process of interconnected mappings from initial data to some
insight, which can be either directly obtained from generated visual
representations or in a combination with automated analysis methods. We have
provided a similar formal description, presented on this slide for the proposed
approach to multidimensional data analysis problem solving by scientific
visualization method on base of FRep approach that will be discussed later.
While [3] mentions a single-step mapping from a data set to
its visual representation within the visual analytics process, [5] goes further
and states that to obtain such a visual representation (or a graphical image),
one needs to put some geometric model (multidimensional in the general case)
into correspondence with the initial data. It means a spatial scene, an
assembly of spatial objects with their geometric and optical descriptions, has
to be first constructed and then a graphical image can be generated using some
rendering procedure for its further visual analysis.
Among the sensory stimuli other than visual, the usage of
sound has been widely investigated since early 80-s [6, 7]. The human auditory
perception is considered most quantitative because of its sensitivity to subtle
changes in the sound characteristics. The technique of data representation
using variable sound characteristics such as pitch, volume, note duration, rythm
and others is called data sonification [8].
Let us look at sonification method characteristics more
closely. Auditory perception has always been the human's early warning system,
which may operate in the background mode. In [9] a small survey was made on the
situations when using audio analysis may be even more effective than visual
perception. The main classes of data that fall in this category are
time-varying data and multidimensional data. The auditory perception brings the
unique advantage to distinguish even small variations in the parameters of the
single sound wave and to compare sound waves. Currently, it is considered that
any person may be trained to develop an ear for music. A musical ear,
traditionally viewed as a set of abilities that allows to fully perceive music
and to adequately judge on all its nuances, but the presence of this ability
allows one to take advantage of the most advanced extended analysis
capabilities as well. In [10] the procedures of time-varying data
representation in the graphical form using a musical accompaniment are
considered. In the paper [11], there are examples of the presentation of
scientific data in the form of musical fragments. The software product MUSE
presented in [11] is the result of a collaboration of researchers and
musicians. This is largely a matter of sensory capabilities of a specific
researcher, but we can say that combining auditory and visual perception allows
one to significantly enhance the ability to conduct analysis more efficiently,
taking advantages of two sensory organs that work differently, and to perceive
the same information in different ways complementing each other.
An extension of visualization through creating additional
perceptual human inputs or more general a combination of several sensory
stimuli for data representation is called data perceptualization [12, 13] (or
data sensualization [14]). The typical combinations are between visual and
auditory stimuli, visual and tactile/haptic stimuli [16], or three of these
stimuli applied together [14]. In this article, we will concentrate on a
visual-auditory data analysis practical case although theoretical
formalizations of establishing correspondences between the initial data and
multiple sensory stimuli for multisensory analysis will be given as well. It is
evident that the problem of formalization of multiple sensory stimuli analysis
and interpretation of analysis results in terms of initial data should be
solved separately for each sensory stimuli. Moreover, the efficiency of this
part of multisensory visualization problem highly depends on researcher’s
spatial creative thinking, in particular on sensory perception (visual,
auditory, etc.), sensory images used in analysis process and other factors.
There are special types of geometrical and optical mappings of multidimensional
scalar fields data and approaches for their visual analysis with well-known
interpretations of results of this analysis (isosurfaces, projection
spreadsheets, etc.). Interpretation of sound characteristics is still an open
research issue. There are still some aspects of sound and some approaches to
its analysis that are studied only in musical theory. They are well-known and
used by musicians in their musical composition analysis work. We believe some
of these formalizations can be used for the generation of appropriate auditory
stimuli and further analysis. As it was noted above, currently it is considered
that any person may be trained to develop an ear for music and judge about some
musical characteristics. We will show that some of these musical
characteristics are more appropriate for analysis as quantitative values can
assigned to them.
We note that to obtain a multisensory representation we need
to create a spatial scene, as it was mentioned above, which is an assembly of
spatial objects with their geometric, optical descriptions, sound and others.
Then corresponding visual, sound and other stimuli can be generated using some
specialized rendering procedures for further multicensory analysis.
Although some efforts have been made on the development of
data perceptualization, a formal framework for establishing correspondences
between data and multiple sensory stimuli has not been yet proposed. We believe
that the concept of multimedia coordinates introduced previously in [17] and
applied in multidimensional shape modeling can be a good framework for
formalization of mapping from a multidimensional geometric model to a
multimedia object that can be treated as a multidimensional object with
Cartesian, visual, audio, haptic and other types of multimedia
coordinates. A space mapping between geometric coordinates and multimedia
coordinates establishes correspondence between the multidimensional shape and
the multimedia object. In this way, a correspondence can be also established
between the given scientific data and a multimedia object, because introducing
a multidimensional geometric model is one of the steps in the visualization
pipeline presented previously.
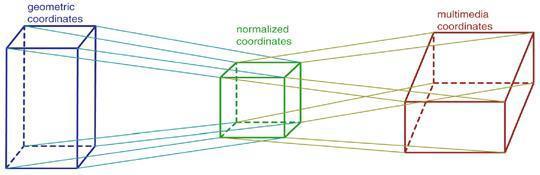
To operate with multimedia coordinates, one can introduce a
system of normalized numerical coordinates (a unit cube) and its one-to-one
correspondence to the multimedia space. By selecting a real normalized value,
one can use the corresponding value of the multimedia coordinate (Fig. 1).
Fig.1. Mapping of geometric coordinates to multimedia
coordinates
Each geometric coordinate variable takes values within a
given interval. On the other hand, multimedia coordinates also have their own
variation intervals. For example, a time interval means life time of the
multimedia object, color varies inside the color space (RGB cube) and so on. To
define the mapping, one has to establish a correspondence between these
intervals through the normalized numerical coordinates.
There are some special ways of dealing with the above
mappings. By assigning a finite set of constant values for some geometric
coordinate, one can first reduce the dimensionality of the introduced geometric
model before establishing some mapping to multimedia coordinates.
It should be noted, that generally methods and approaches
that aim at visual analysis of geometrical objects representing
multidimensional data are called multidimensional visualization methods [21].
These techniques usually suppose not only reducing dimensionality through
application of specific geometric operations, but mapping data to different
photometric characteristics (color, transparency), and includes interactive
techniques as well. Most well-known of these techniques are covered by
different types of multimedia coordinates, introduces in [17], among them are:
·Dynamic coordinates represent continuous coordinates that can be
mapped onto physical time;
·Spreadsheet coordinates take discrete values in the given
bounding box;
·Photometric coordinates include color, transparency, texture and
other parameters of visual appearance of the multimedia object.
Another type of multimedia coordinates, mentioned previously
is audio, which was studied in simple cases in [24]. In this paper, we
propose some generalizations on base multimedia coordinates approaches for
specific type of multidimensional data multisensory analysis - scalar fields,
bringing together some most well-known interactive, photometric and geometrical
techniques and demonstrating how they can be extended by other multisensory
techniques on the example of sound.
Let us look more precisely at the geometric model to be
involved in multisensory visualization. In geometric modeling the necessity of
compact precise models with unlimited complexity have resulted in the
development of the new paradigm of procedural modeling and rendering, where the
geometric shape and properties are evaluated upon request using procedural
rules. One of the approaches to procedural modelling is to evaluate a real
function of point coordinates in general case in multidimensional space
providing the point membership for the shape at the given point along with the
measure of distance to its surface. A constructive approach to the creation of
such function evaluation procedures for geometric shapes is called the Function
Representation (FRep) [20]. FRep was extended in [25] to the constructive
hypervolume model, where the object is represented not by a single function,
but by a vector-function with one component responsible for the object geometry
and other components serving as point attribute functions representing such
object properties as material, color, transparency, and others.
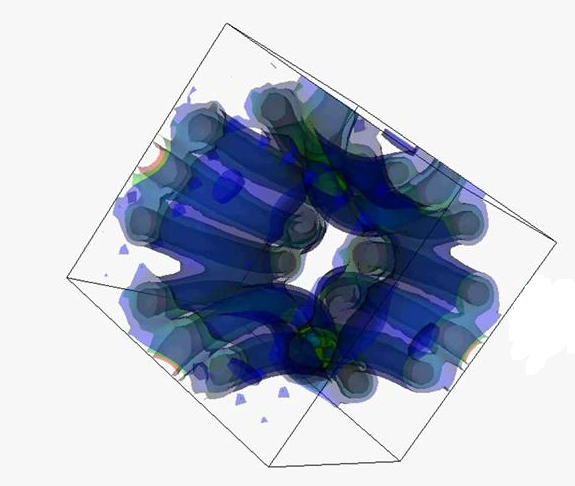
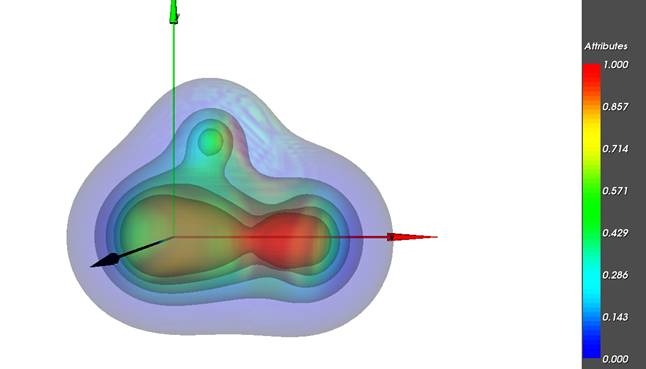
On Fig. 2, examples are presented of scalar field computer
simulation visualization. The studied scalar fields were given as functions of
several variables defined on domains represented as geometric objects that also
could be defined by functions of several variables. A functional description of
the studied physical object was presented in a file in the form of numerical
data that should be analyzed. To obtain these visualization results several
additional file reading based primitives and attribute functions were added to
the HyperFun library[22] and used within the resulting HyperFun model. The
visualization presented was made through the Visualization Toolkit (VTK) based
interface for HyperFun [23].
(a)Visualization of scalar order-parameter field distribution
(b)Visualization of electron dencity and electrostatic potential
field of NCH molecule
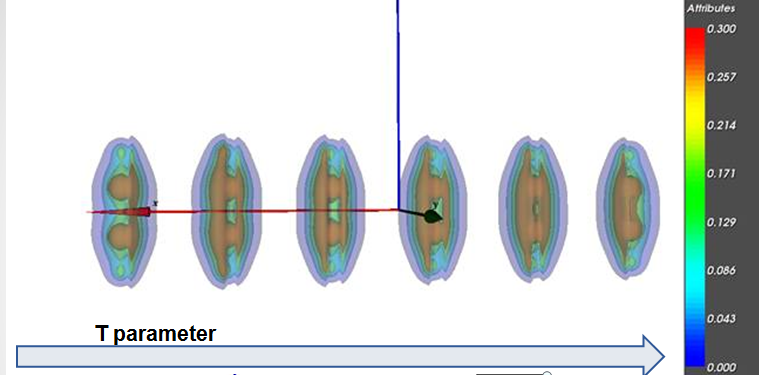
(c) Visualization of dynamic electron dencity field of С2H2
molecule with use of spreadsheet technique
Fig. 2. Examples of static and dynamic scalar fields
visualization
It should be noted that to visualize a function of several
variables (more than three) special methods and geometric modelling techniques
are used. Usually they are:
·use of several semitransparent colored isusurfaces (see example
Fig.1(a)) in case when dimensionality of geometric object is not greater than
4D;
·projections on a subspace [18];
·cross-sections (see example Fig.2(c)).
For more effective analysis, these geometric operations may
be defined interactively, through providing some specialized interactive
widgets (plane, hypercube widgets to define cross-section and etc.). Also some
special types of spatial scene may be introduced to provide special graphical
representations called “matrices of cross-sections” or spreadsheats. An
according type of multimedia coordinates was introduced in [17] and is called
“spreadsheet coordinates”. This type of coordinates allows for spreadsheet-like
spatial organization of elementary images or shapes in the regularly or
irregularly placed 1D, 2D or 3D nodes. In this work we will consider the case
of a 1D node. Let us consider a simple case of 1D spreadsheet on Fig.2 (c) with
the specific types of multimedia coordinates:
·"x", "y" and "z" types correspond
to world coordinates in the Cartesian coordinate system. They are used to
describe a set of 3D isosurfaces f(x,y,z)=c;
·"c" type corresponds to a photometric coordinate,
namely the color.
·"v" type corresponds to 1D spreadsheet coordinates. By
assigning its discrete values we construct a horizontal 1D spreadsheet. Each
section in Fig. 1 represents a 4D geometric object, displayed with 3D
isosurfaces f(x,y,z)=c, where c is as well mapped to a photometric coordinate.
It should be noted that we have to reduce dimensionality not
only to obtain graphical representation, but as well to map our data into sound
and other type of sensory stimuli. So we have to introduce other type on
spreadsheet coordinates, that will be called multisensory spreadsheet
coordinates in general case. We will demonstrate our approach through
introducing some specialized interfaces on the base of interactive techniques
extended with sound.
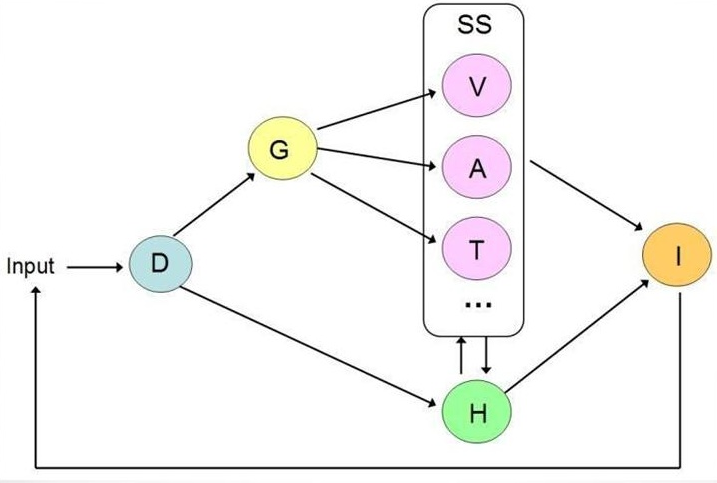
Based on the visual analytics process as presented in [3]
and the idea of an intermediate multidimensional geometric representation of
initial data [5], we propose the following interpretation of the basic
multisensory analysis process.
Fig.3. Multisensory analysis process
In the diagram (Fig. 3), perceptualization process is
presented as a transformation (mapping) M: D -> I from initial data D to
insight I, which is the goal of the entire process. The mapping M is a
superposition of mappings from one set to another in the diagram. Thus, the
initial data undergo geometric interpretation and are mapped to the set G of
multidimensional geometric models. The next step is to generate several sensory
stimuli SS for human perception. The mappings from G to SS are facilitated by
the introduction of a spatial scene, which is an assembly of spatial objects
with their geometric, optical, auditory, tactile and other properties
(multimedia objects). Note that the geometric objects in the spatial scene can
have their dimensionality reduced to 2D and 3D using geometric cross-sections
and projections, which allows for applying well-known graphical rendering
algorithms. When such a spatial scene is constructed, various sensory stimuli
can be generated using corresponding rendering procedures: visual stimuli V (graphical
images), auditory stimuli A (sounds), tactile and haptic
stimuli T, and others. Te final insight I can be
either directly obtained from the generated sensory stimuli through human
perception and analysis, or it is obtained in a combination with generating a
hypothesis H and its analysis including automated methods.
Note that the hypothesis H can be also represented with visual
and other sensory stimuli, which can help to refine or redefine it in the
process of analysis. The entire process has iterative character, which is shown
by the feedback loop in the diagram. The user may tune or redefine not only the
parameters of the data input, but also the introduced geometric models, the
hypothesis, the selection of sensory stimuli and the type and parameters of rendering
procedures.
Applying the presented general approach, the process of data
analysis involving both human vision and hearing, we need to do the following:
1) To obtain a mapping of the given data onto its
representation in the form of images and sound. To obtain a necessary model of
a spatial scene, its geometric and optical models need to be extended by a
sound model. Such a spatial scene augmented with sonification needs to be put
in correspondence to the given data and then sound rendering can be applied
with output to speakers or some other sound output device for further analysis.
2) To analyze the rendered images and sound and to interpret
the results of this analysis in terms of the initial data.
The definition of corresponding sound mappings that can be
concretely analysed and easily interpreted by researchers is also a question
that should be studied. Here we suggest that a researcher in common case should
be trained to interpret some not quite evident sound mappings similar to
musicians training their ears for further music analysis in modern practice. In
our work, we take advantage of musicians’ approach adopting well-known concepts
of music analysis and writing used by musicians from simple properties of sound
analysis (pitch, volume, duration, etc.) to “music” properties analysis (tone,
interval between tones, etc.). These concepts are taken as the base of sound
mapping and accordingly of sound analysis.
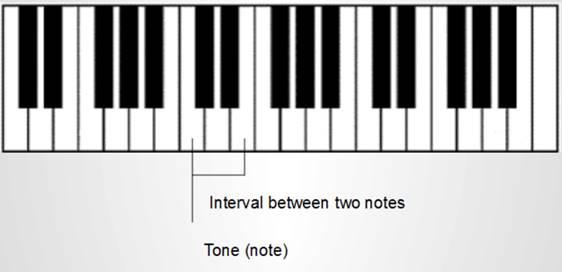
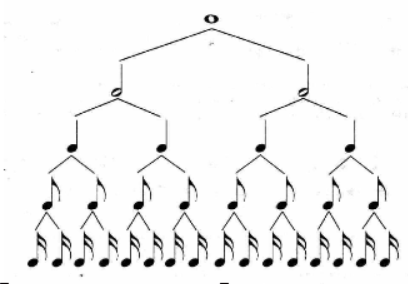
Fig. 4 presents some musical (sound) characteristics that
musicians may distinguish auditory and describe quantitatively: tone, note
duration, interval between two notes are most often used ones.
(a)
(b)
Fig.4 (a) Aurally measure interval between two notes and
determine tone (note itself). For this a musical scale used in musical
composition should be defined first of all (minor, major, based on C,D,F note
and etc.) (b) Measure note duration. The basic rhythm parameters in musical
composition should be defined first of all.
In this article, only simple cases of sound analysis, cases
that for advanced analysis require some musical training (e.g., to determine
interval and note) will be considered.
From authors point of view, a camera, a sound receiver, a
haptic cursor and other similar elements need to be explicitly placed in the
spatial scene as spatial models of the human organs of perception. Thus, a
spatial scene includes spatial objects representing data as well as other
spatial objects representing their influence on human senses. Rendering of the
spatial scene generates information for output devices provided for
consideration by humans, namely a screen, speakers, a haptic device and others.
On the basis of the proposed approach to multisensory
analysis, let us describe the process for solving a high dimensional data
analysis problem involving a hybrid visual-auditory representations. The data
analysis problem can be formulated as follows:
Given - numerical data D describing the
object under consideration;
Required - to obtain an insight I of
interest to the researcher regarding the initial object.
Let us consider the solution of the above stated problem by
reducing this problem to the following two problems solved one after another:
1) the problem of obtaining a multisensory representation
(SS in Fig. 3) of considered data in the hybrid visual-auditory form;
2) the problem of human sensory analysis and interpretation
of the results of the analysis with respect to the original description.
Note that we will deal here only with the upper path in the
diagram (Fig. 3) from the initial data to sensory stimuli, leaving the
hypothesis H formulation, visualization and analysis out of the discussion.
From our experience of participating in scientific research
in nuclear physics, chemistry and other disciplines, it is very often the case
that the initial data can be presented as a set of real functions of several
variables f1(x1,x2,...xk) , f2(x1,x2,...xk) , ... fn(x1,x2,...xk) or scalar
fields in an abstract k-dimensional space describing different characteristics
of a complex object under investigation. There are two alternative ways to
introduce a multidimensional geometric interpretation (set G in Fig. 2) of such
a data. One is quite straightforward as each of the above sets of real
functions can be considered as a definition of a k-dimensional surface in a
k+n-dimensional space. However, this interpretation can turn too abstract for
further multisensory perception and analysis. Alternatively, all the given data
functions can be presented in the form of a vector function
f = (f1, ..., fn),
which then can be interpreted as an FRep based constructive
hypervolume model [25] mentioned earlier. This means the function f1 is
describing some multidimensional geometric object and all other components of
the vector-function represent attributes defined on this multidimensional
geometric shape. The attribute functions f2, ..., fn defined on the obtained
geometry can represent various object properties such as material, color,
emitted sound, rigidity and others that can be directly mapped to sensory
stimuli. Rendering of the spatial scene generates several sensory stimuli as
outputs. This process will be illustrated in more detail by the case study
below.
Let us illustrate the scientific visualization extended with
sound application in a certain class of problems, where given data represent
various scalar fields. A simple scalar field case study using graphical and
audio presentation was described briefly in [24]. Let us consider a more
complex case of two scalar fields analysis.
Problem statement
The objects under study are an electron density field and an
electrostatic potential field of CNH molecule. This two scalar fields are used
to be analyzed together.
Given
The mathematical model consists of the values of two real
functions of three variables f1(x,y,z) and f2 (x,y,z), where (x,y,z) are
coordinates of points in space. The fields are given in the tabular form at the
nodes of a rectangular regular grid in the function's domain
Required
To analyze variations of the functions depending on changes
of independent variables x,y,z.
Geometric model
Let us introduce two interpolation functions Y1(x,y,z) and
Y2(x,y,z) corresponding to the initial tabulated functions. The geometric
interpretation of the functions Y1 and Y2 are the hypersurfaces G14 and G24 in
the Euclidean subspace E4 with coordinates (x, y, z,), where is a function
coordinate. To facilitate further multisensory analysis, we introduce
additional attribute functions:
1) A1=a1(x,y,z) that will correlate with Y1 function values
and will correspond to some visual attribute values. This function defines a
hypersurface A14 in the attribute subspace (x, y, z, a1).
2) A2=a2(x,y,z) that will correspond to some auditory
attribute and will correlate with Y1 function value.
3) A3=a3(x,y,z) that will correspond to some auditory
attribute and will correlate with Y2 function value.
4) A4=a4(x,y,z) that will correlate with Y2 function values
and will correspond to some visual attribute values.
Here the vector-function (Y, A1, A2, A3, A4) can be
considered a constructive hypervolume model with each of its components
representing a 4D hypersurface in 8-dimensional space with coordinates (x, y,
z, gamma, a1, a2, a3, a4).
Spatial scene
The hypersurface G14 can be put into correspondence with a
collection of isosurfaces Cj in the space E3 by selecting level values cj for
the function Y1. We choose a color scale of selected isosurfaces and thus
define the range for the A4 function values and map points (xi,yi,zi) on each
isosurface cj to according values Y2(xi,yi,zi) and assign the corresponding
color. We also map each value Y1 = cj to transparency according to the value of
A1 function within the selected transparency scale. The sound model includes an
introduced point sound source to be used in sound rendering. The location of
the sound source (xs, ys, zs) within the spatial scene defines the selected
point in space and the sound frequency w of the generated sound is defined by
the function A2 value at this point. We define the sound frequency as w =k1*a2
(xs, ys, zs) , where k is a scalar coefficient. Also the sound volume as
v=k2*a3 (xs, ys, zs) is defined by the function A3 and thus we generate complex
sound with those two characteristics pitch and volume analyzed simultaneously.
Thus we form geometrical, optical and sound models.
Schematically the mapping of 4D hypersurfaces in 8-dimensional space with
coordinates (x, y, z, gamma, a1, a2, a3, a4) into corresponding multimedia
coordinates will look like:
{x,y,z} --> world coordinates “x”,“y”,“z”
{a1,a4} --> photometric coordinates of “transparency” and
“color”
{a2,a3} --> audio coordinates of “sound frequency” and
“sound volume”.
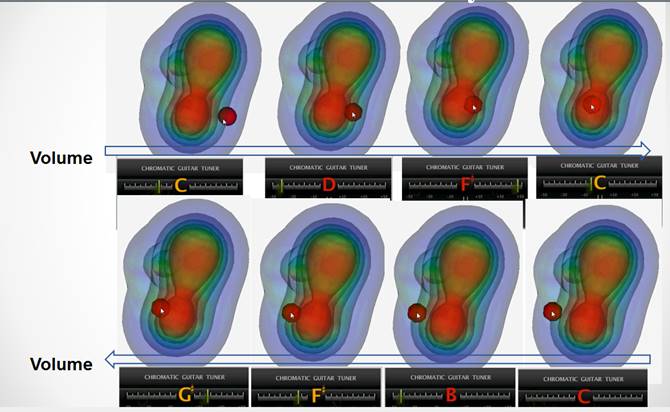
Rendering and analysis
The results of the visual and auditory rendering of the
spatial scene are the following (illustrated by Fig. 5):
- a graphical image of projections of semi-transparent colored
isosurfaces on a graphical terminal;
- the point sound source represented by the red sphere with
the sound source located in its center. Its location is specified interactively
by the user;
- sound wave generated by a sound terminal with the frequency
corresponding to the location of the point sound source and perceived by the
user as a specific sound tone. So here, according to the multimedia coordinates
concept a “musical tone scale” was defined. In this case we consider a simple 2
octaves interval in Cmajor gamma to be such a scale. These intervals and notes
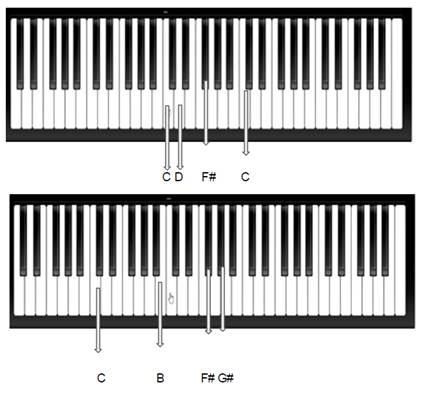
may be presented on piano. Quite often, when musicians aurally analyze a
musical composition, they determine note places on the piano keyboard before
writing corresponding musical sheets. Here we will take the representation of
notes on the piano as our musical scale graphical representation. Each sound
tone generated at the location of the point source is defined on this musical
Cmajor scale (Fig.5). Here we receive following tones presented in Fig 5(a) and
can graphically present their place on musical scale Fig.5 (b). Here a basic
guitar tuner was also used to illustrate the current note value (Fig.5 a).
However, a well-trained musical ear can distinguish intervals between these
notes and determine the current note itself and its place on the piano musical
scale, and judge about quantitative parameters of the scalar field current
value (according to the mapping from the field value to an according tone) and
then change the value (according to the mapping from the change in the filed
value to the interval).
Fig. 5. Exploration of two scalar fields dependency and
change with pitch and volume.
(a) Here we use an interactive “sphere” widget to define
sound frequency w and volume v of the generated sound defined by the functions
A2 and A3 values at fixed values of world coordinates x,y,z.
(b) Presentation of according notes on Cmajor scale (2
octaves) on piano. A researcher with well-trained musical ear and appropriate
«auditory tuning” on Cmajor scale can easily aurally determine these notes and
their place on piano musical scale and judge about how quantitatively sound was
changed.
(c) Explaining video, press right key to open pop-up menu
and choose "play" to play video.
In conclusion it may be said that the formalization of the
mapping between the multidimensional geometric models and the spatial scene
available for rendering multiple sensory stimuli is the still research question
to address. We have shown a possible solution in the case of the initial data
represented by scalar fields (real functions of several variables) and
illustrated this by the case study of the scalar field analysis using
interactive visual-auditory display. Different types of interactive
visual-auditory or auditory widgets together with a general approach as well as
different types of sound mappings should still be studied. Combining audio and
spreadsheet coordinates and their further interpretation is also an open
research issue that should be studied. We are planning to involve the concept
of multimedia coordinates as a way to establish more complex correspondences
between initial data, the introduced multidimensional geometric models and
multiple sensory stimuli.
1.McCormick B., DeFanti T., Brown M. (Eds.). Visualization in scientific
computing. Computer Graphics. Vol. 21. No. 6. 1987.
2.Wong P. C., Thomas J. Visual analytics. IEEE Computer Graphics and
Applications. Vol. 24. No. 5. 2004. Pp. 20–21.
3.Keim D., Mansmann F., Schneidewind J., Thomas J., Ziegler H. Visual
analytics: scope and challenges. Visual Data Mining, Lecture Notes in
Computer Science. Vol. 4404. Springer. 2008. Pp 76-90.
4.Foley J., Ribarsky B. Next-generation data visualization tools.
Scientific Visualization, Advances and Challenges, L. Rosenblum et al. (Eds.),
Academic Press, 1994.
5.Pilyugin V., Malikova E., Adzhiev V., Pasko A. Some theoretical issues
of scientific visualization as a method of data analysis. Transactions on
Computational Science XIX, Lecture Notes in Computer Science. Vol. 7870.
Springer-Verlag. 2013. Pp. 131–142.
6.Yeung E. Pattern recognition by audio representation of multivariate
analytical data. Analytical Chemistry. Vol. 52. No.7. 1980. Pp. 1120–1123.
7.Bly S. Presenting information in sound. Proceedings of the CHI '82
Conference on Human Factors in Computer Systems. ACM. 1982. Pp. 371-375.
8.Kaper H., Wiebel E., Tipei S. Data sonification and sound visualization.
Computing in Science and Engineering. Vol. 1. No.4, 1999, pp.48-58.
9.Scaletti C., Craig Alan B. Using sound to extract meaning from complex
data. In Proceedings SPIE. Vol. 1459. 1991. pp. 207–219.
10.Mezrich J. J., Frysinger S., Slivjanovski R. Dynamic representation of
multivariate. time series data. Journal of the American Statistical
Association. 1984. Vol. 79, N. 385. pp. 34–40.
11.Lodha Suresh K., Beahan J., Heppe T. and etc. MUSE: A Musical Data
Sonification Toolkit. In Proceedings of International Conference on Auditory
Display (ICAD). 1997. pp. 36–40.
12.Grinstein G., Smith S. Perceptualization of scientific data. Proc. SPIE
1259, Extracting Meaning from Complex Data: Processing, Display, Interaction.
1990. Pp. 190-199.
13.Ebert D. Extending visualization to perceptualization: the importance of
perception in effective communication of information. In The Visualization
Handbook, C. Hansen and C. Johnson (Eds.), Academic Press, 2004, pp. 771-780.
14.Ogi T., Hirose M. Multisensory data sensualization based on human
perception. VRAIS '96 Proceedings of the 1996 Virtual Reality Annual
International Symposium, 1996, pp. 66-71.
15.Jovanov E., Starcevic D., Radivojevic V., Samardzic A., Simeunovic V. Perceptualization
of biomedical data. An experimental environment for visualization and
sonification of brain electrical activity. IEEE Engineering in Medicine and
Biology Magazine. Vol. 18. No. 1. 1999. Pp. 50–55.
16.Maciejewski R., Choi S., Ebert D., Tan H. Multi-modal perceptualization
of volumetric data and its application to molecular docking. WHC '05
Proceedings of the First Joint Eurohaptics Conference and Symposium on Haptic
Interfaces for Virtual Environment and Teleoperator Systems, 2005, pp. 511-514.
17.Adzhiev V., Ossipov A., Pasko A. Multidimensional shape modeling in
multimedia applications. MultiMedia Modeling: Modeling Multimedia Information
and Systems, ed. A.Karmouch, World Scientific, 1999, pp. 39-60.
18.Pasko A.A., Savchenko V.V. Projection operation for multidimensional
geometric modeling with real functions. Theory and Practice of Geometric
Modeling, Blaubeuren II conference, W. Strasser (Ed.), October 14-18, 1996,
Tuebingen, Germany.
19.Pasko A., Adzhiev V., Malikova E., Pilyugin V. Some Theoretical Issues
of Scientific Visualization as a Method of Data Analysis. the Lecture Notes in
Computer Science series. 2013. Vol. 7870. Springer. 19 April, 2013
20.Pasko A., Adzhiev V., Sourin A., Savchenko V. Function representation in
geometric modeling: concepts, implementation and applications. The Visual
Computer. Vol. 11. No.8, 1995, pp.429-446.
21.Pak Chung Wong, R. Daniel Bergeron. 30 Years of Multidimensional
Multivariate Visualization, Proceeding Scientific Visualization, Overviews,
Methodologies, and Techniques. EEE Computer Society Washington, DC, USA, 1997,
pp. 3-33 , isbn 0-8186-7777-5
2Национальный исследовательский ядерный
университет МИФИ, Россия
3Национальный центр компьютерной анимации,
Борнмутский университет, Великобритания,
4Uformia AS, Норвегия
Аннотация
Одно из определений научной визуализации - это процесс
получения визуального отображения исходных данных, которое затем может быть
"воспринято" и проанализированно исследователем. Органы чувств
включают в себя не только зрение, но и слух, осязание, обоняние и другие,
возможны их комбинации.
В статье рассматривается метод многосенсорной научной
визуализации, иными словами, расширенной научной визуализации, предполагающей
использование звука тактильных и других органов чувств в процессе анализа.
Формализация многосенсорного анализа и в особенности вопросов установление
соответствий между исходными данными и различными сенсорными стимулами,
является малоисследованной. В данной статье приведены некоторые обобщения в
области получения отображения исходных данных на различные сенсорные
стимулы на базе действительных вектор функций многих переменных при
решении задач средствами многосенсорной визуализации. Формализация процесса
анализа различных сенсорных воздействий и последующая интерпретация результата
анализа по отношению к исходным данным также является открытой для исследования
задачей.
В данной статье отдельно рассмотрен случай
визуально-звукового анализа многомерных скалярных полей, приведены некоторые
обобщения и подходы к процессу анализа и интерпретации звука в основном
основанные на теории музыки и используемые музыкантами при анализе музыкальных произведений.
Приведен пример визуально-звукового анализа скалярного поля
методом многосенсорной научной визуализация. Рассмотрены процессы отображения
исходных данных на различные характеристики звука и методы последующего анализа
звука.