USING VISUALIZATION IN SOLVING DISCRETE MCDA-PROBLEM BY METHODS OF PROMETHEE FAMILY
A.Yu. Yakovlichev, I.E. Milman, V.V. Pilyugin.
National Research Nuclear University MEPhI (Moscow Engineering Physics Institute), Russian Federation.
DrewYak7@ya.ru, igalush@gmail.com, VVPilyugin@mephi.ru
Contents
3. The formal formulation of the problem
3.2. MAUT and outranking approaches
3.3. Statement of the problem in the methods of the family PROMETHEE
4. Visualization in PROMETHEE I and PROMETHEE II methods
4.1. Tabular presentation of the input data in Visual PROMETHEE Academic Program
4.2. Tabular presentation of the input data
4.3. Diagram “PROMETHEE I Partial Ranking”
4.4. Diagram “PROMETHEE II Complete Ranking”
4.5. Diagram “PROMETHEE Diamonds”
4.6. Diagram “PROMETHEE Network”
Abstract
This article contains a short historical review of the establishment of methods of PROMETHEE family. We consider the classification of B. Roy and 2 approach to the formal statement of the discrete MCDA-problem: the approach of multi-attribute utility theory and outranking approach. We formalized the statement of the problem to be solved by the methods of PROMETHEE family. We described the input, intermediate and output data of the discrete MCDA-problem.
We have shown the work with the Visual PROMETHEE Academic software tool on the example of car selection. Particular attention is paid to visualization of intermediate and output data for solving discrete MCDA-problems by PROMETHEE I and PROMETHEE II methods. We consider the diagrams "PROMETHEE I Partial Ranking", "PROMETHEE II Complete Ranking", "PROMETHEE Diamonds", "PROMETHEE Network", "GAIA Plane".
It is mentioned that the diagrams are used for rapidly getting information on the resulting output data and intermediate discrete MCDA-problem solutions. The user refers to the results in tabular form only when the need arises.
Keywords: MCDA-problem, PROMETHEE, visualization, decision theory.
1. Introduction
MCDA-problems can be found in various areas of human activity: multi-criteria decision analysis (MCDA) or multi-criteria decision making (MCDM) deals with the development of methods and approaches that provide support to the decision-maker (DM). Tools and approaches of this discipline are used in various industries: health care [1, 2], power engineering [7], environment [4], water management [5], business and financial management [6], chemistry, logistics, manufacturing [8].
This paper considers the methods of PROMETHEE family, because these methods have a wide application in the areas listed above. Furthermore, in the recent years there has been a significant growth of publications that suggest new methods of this family, usage of visualization, usage of these methods with methods from other families, as well as describe the application of these methods in various fields of human activities.
Methods of PROMETHEE family can be described by the scheme shown in Fig. 1
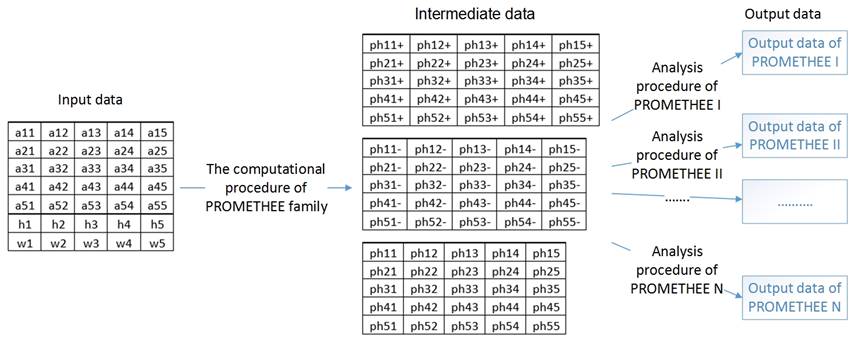
Fig. 1. The scheme of work methods PROMETHEE family.
One can see in this scheme that the structure of the input and intermediate data for all the methods of this family are the same. Different methods analytically process intermediate data according to its own computing procedures. Thus, the output varies in dependence on the method. The input and intermediate data are tabular data, the output data are binary relations between objects. The input, intermediate and output data are described in section 3.3 in more details.
We note that, in general, the decision-maker (DM), and analyst are involved in the process of solving MCDA-tasks. Accordingly, the user of the method can be both DM or analyst. Sometimes one person can be both the decision-maker and the analyst.
2. Historical review
In 1982, Jean-Pierre Bruns presented at the conference, held at the University of Laval (Canada), a new family of methods named PROMETHEE for solving the discrete multicriteria problems [10]. PROMETHEE is an acronym for "Preference Ranking Organization Method for Enrichment Evaluations".
At that time this family included only 2 methods: PROMETHEE I a method for partial ranking of alternatives and PROMETHEE II a method for the complete ranking of alternatives. [8]
Shortly afterwards Bertrand Mareschal began working with Jean-Pierre Brans on new methods of PROMETHEE family. In 1983 two new methods were proposed: PROMETHEE III a method for ranking using intervals and PROMETHEE IV a method for complete or partial ranking of alternatives in the cases where the set of effective solutions is continuous. [9] . In the same year the first computer program that implies some of the methods of PROMETHEE family was created. [11]
An attempt to increase the amount of indifference relations in the final matrix of binary relations in the PROMETHEE III method was committed for more accurate detection of similar alternatives. In the PROMETHEE I and PROMETHEE II methods indifferent relation is established between two alternatives only if their preferences flows are strictly equal. In the PROMETHEE III method an interval is calculated for each alternative instead of a specific value. That interval contains the value of the alternatives flow In this case, if the intervals of two alternatives intersect, then these alternatives established indifference relation.
An important aspect of the historical development of methods PROMETHEE family is the appearance of visualization in the MCDA-problem solving process. In 1988, Bruns and Marechal developed visual interactive module GAIA, which provides methods of the PROMETHEE family user friendly graphical representation. GAIA name is an acronym for "Graphical Analysis for Interactive Aid". As the graphic representation made it possible to visually estimate the flow preferences, so the PROMETHEE III method has not been implemented in the PROMETHEE software. Today GAIA is one of the few effective descriptive methods for solving the discrete multicriteria problems.
In the period from 1984 to 1989 PROMCALC program (for MS-DOS) with the implementation of some of the PROMETHEE methods became available for many users. PROMCALC (later PROMCALC-GAIA) was one of the first truly interactive programs with a strong focus on the user interface, graphical representations and sensitivity analyzes.
In 1992, the same authors had presented PROMETHEE V method for MCDA-problems with constraints [13], and in 1994 - the PROMETHEE VI method [12].
PROMETHEE I and II are suitable for choosing the most preferred alternative from many possible alternatives. However, in some cases it is necessary to allocate not one alternative, but a subset of the alternatives considering a set of constraints. PROMETHEE V method was created to solve these types of problems.
Also, the PROMETHEE GDSS method for collective decision-making has been proposed [14, 15], and two advanced approach to PROMETHEE: PROMETHEE TRI to address the sort problems and PROMETHEE CLUSTER for a nominal classification [16].
It should be noted that nowadays, more than a dozen methods of this family are developed. Methods PROMETHEE I and PROMETHEE II are the most well-known methods of PROMETHEE family today. These methods are also commonly and successfully used in practice.
3. The formal formulation of the problem
Formalization of the MCDA-problem statement evolved for a long time. Different researchers consider MCDA-problem from different points of view, so the formal statement of MCDA-problem may differ from researcher to researcher. One of the earliest attempts to formalize the MCDA-problem was undertaken by B. Roy.
3.1. The Roy Classification
B. Roy proposes to classify every MCDA-problem into one of the classes depending on the purpose of the problem [18, 19]. Roy called these classes “problematics”.
The problematic "alpha" includes such MCDA-problems in which selecting exactly one best object from a finite set of objects is needed. The problematic "beta" includes such MCDA-problems in which each object must be attributed to one of the groups of objects (classes). The problematic "gamma" includes such MCDA-problems in which ranging objects from best to worst is needed. The problematic "delta" includes MCDA-problems that require to describe objects in terms of their efficiency criteria.
3.2. MAUT and outranking approaches
A formal description of the input data of discrete MCDA-problem is given by the (A - A - E) model in MAUT, where the first A is set of alternatives, the second A is the set of attributes and E is the performance table. Outranking approach uses the (A - F - E) model, where A - a set of alternatives and F is the ordered family of criteria (functions defined on A), E - performance table. the (A - A / F - E - M) model is considered in [17], bringing together the approaches of the MAUT and outranking approach, as well as complementing the M input variable, which contains additional information from the decision-makers (e.g., weight criteria). It is remarkable that different methods for solving discrete problems require from the decision-maker (DM) various additional information. In this sense we can say that each method (family of methods) has its own formal statement of the problem.
3.3. Statement of the problem in the methods of the family PROMETHEE
The mentioned above statements are valid for the PROMETHEE methods family. However, in practice, due to the universality and generality of the statement, it is not always convenient to use it in the description of the input data. In this article, we propose to consider the statement of discrete MCDA-problem more strictly - with the usage of terms like: set, tuple, a real number, and specifically for the PROMETHEE methods family.
Let
![]() - a finite set of tuples of length
- a finite set of tuples of length ![]() :
:
![]()
![]()
![]()
![]() - tuple of length
- tuple of length ![]() :
:
![]()
![]()
![]()

![]() - tuple of length
- tuple of length ![]() , elements of which
are functions
, elements of which
are functions
![]()
![]()
Then a tuple (A, W, H) is the input data of the discrete problem to be solved by the family of PROMETHEE methods.
On the basis of the input data intermediate data is
obtained. These intermediate data are common to all the methods of PROMETHEE
family and can be described as three matrices ![]() ,
, ![]() ,
, ![]() .
.
On the output of the method you need to classify every
element of ![]() (Cartesian
product
(Cartesian
product ![]() ). The possible classes are:
). The possible classes are:
· incomparability class;
· indifference class;
· strong preference class;
· strong antipreference class.
In other words, it is needed to divide the Cartesian product
![]() into
4 disjoint classes. However, some classes may be empty. This formed statements
about the class of the elements of
into
4 disjoint classes. However, some classes may be empty. This formed statements
about the class of the elements of ![]() are
the output data of the discrete MCDA-problem solved by the methods of PROMETHEE
family. we will call each of the classes a binary relation on the set
are
the output data of the discrete MCDA-problem solved by the methods of PROMETHEE
family. we will call each of the classes a binary relation on the set ![]() .
.
Now that the input and output data of the discrete problem is determined, let’s turn to the consideration of the visualization issues within the methods of PROMETHEE family.
4. Visualization in PROMETHEE I and PROMETHEE II methods
The input, intermediate and output data of methods from mentioned family are often presented in tabular form. Also there may be a lot of tables. Using visualization allows the user faster analyze the data these tables, making it easier for the user to solve the MCDA-problem.
As mentioned above, the most famous and lighted methods of PROMETHEE family are the PROMETHEE I and PROMETHEE II methods. These methods are commonly and successfully used in practice. These methods will be considered now.
One of the programs for solving the discrete multicriteria problems by methods of PROMETHEE family is the Visual PROMETHEE Academic program, developed in conjunction with the creator of PROMETHEE I and PROMETHEE II methods.
4.1. Tabular presentation of the input data in Visual PROMETHEE Academic Program
We provide an Illustration of the work with that software tool on the example of car choosing.
In this program, the input data (the structure of which, as previously noted, is the same for methods of PROMETHEE family) are tabular data.
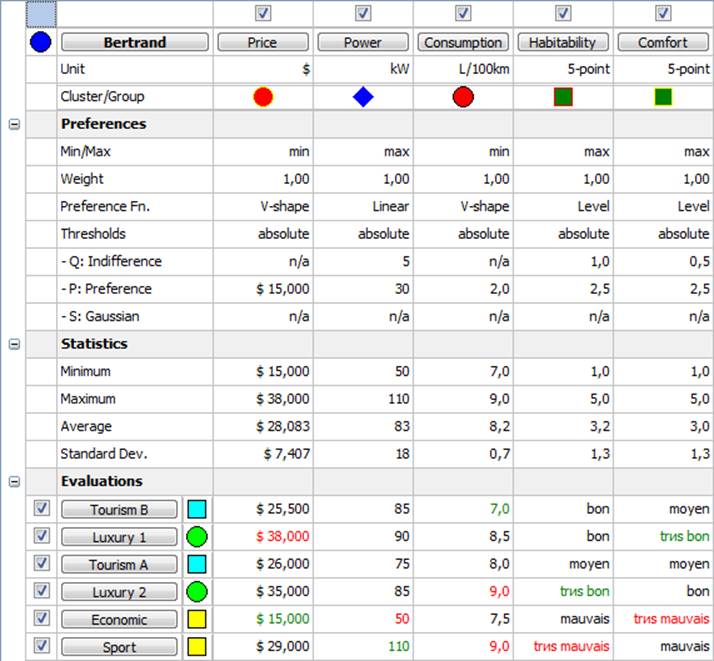
Fig. 2. Presentation of the input data in Visual PROMETHEE Academic Program.
Fig. 2 shows a visualization of tabular input data about 6 cars (Tourism A, Tourism B, Luxury 1, Luxury 2, Sport, Economic), by 5 criteria (Price, Power, Consumption, Habitability, Comfort). This visualization is useful for the control of the input data.
4.2. Tabular presentation of the input data
The user is seeking information on what is the preference order of alternatives. For this purpose, we use tabular presentation (Fig. 3):
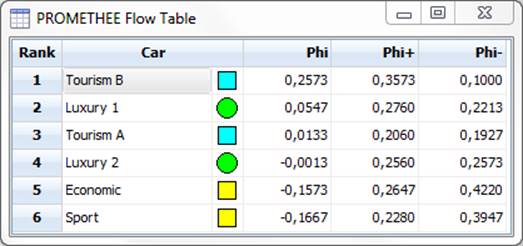
Fig. 3. Tabular presentation of the output data in Visual PROMETHEE Academic program.
The table contains the results of two methods: PROMETHEE I and PROMETHEE II. Working with that table, the analyst is able to make conclusions about what relationship is established between any two alternatives. PROMETHEE I method establishes one of the 4 types of relations between alternatives: the indifference, incomparability, strict preference and strict antipreference. Method of PROMETHEE II - one of the three types of relationships: indifference, strict preference and strict antipreference. The analyst uses the following rules:
1) If the following equation is performed for two alternatives B and C
(Phi+(B) = Phi+(C)) AND (Phi-(C) = Phi-(C)),
then B ~ C ("B and C are indifferent"). That is, the indifference relation is set between the alternatives B and C and tuple (B, C) belongs to the class of indifference.
2) If the following equation is performed for two alternatives B and C
(Phi+(B) > Phi+(C)) AND (Phi-(C) < Phi-(C)) OR
(Phi+(B) > Phi+(C)) AND (Phi-(C) = Phi-(C)) OR
(Phi+(B) = Phi+(C)) AND (Phi-(C) < Phi-(C))
then B > C ( "B is strictly preferably to C"). That is, the strict preference relation is set between the alternatives B and C and the tuple (B, C) belongs to the class of strict preference.
3) If the strict preference relation is set between alternatives B and C: B > C, then the strict antipreference relation is automatically set between C and B alternatives C < B ("C less preferred than B"). In other words, if a tuple (B, C) is an element of the strict preference class, the tuple (C, B) is an element of the strict antipreference class.
4) In all other cases, the incomparability relation is set: B N C ("B and C are incomparable").
Output data (judgments) of the solution of MCDA-problem by PROMETHEE I and PROMETHEE II methods can be represented as a matrix of binary relations (Tables 1 and 2). This matrix one should read by rows. For example, in the second row of Table 1, he results of the PROMETHEE I method are recorded as follows:
Luxury 1 < Tourism B
Luxury 1 ~ Luxury 1
Luxury 1 N Tourism A
Luxury 1 > Luxury 2
Luxury 1 > Economic
Luxury 1 > Sport
Table 1.
|
|
Tourism B |
Luxury 1 |
Tourism A |
Luxury 2 |
Economic |
Sport |
|
Tourism B |
~ |
> |
> |
> |
> |
> |
|
Luxury 1 |
< |
~ |
N |
> |
> |
> |
|
Tourism A |
< |
N |
~ |
N |
N |
N |
|
Luxury 2 |
< |
< |
N |
~ |
N |
> |
|
Economic |
< |
< |
N |
N |
~ |
N |
|
Sport |
< |
< |
N |
< |
N |
~ |
Table 2.
|
|
Tourism B |
Luxury 1 |
Tourism A |
Luxury 2 |
Economic |
Sport |
|
Tourism B |
~ |
> |
> |
> |
> |
> |
|
Luxury 1 |
< |
~ |
> |
> |
> |
> |
|
Tourism A |
< |
< |
~ |
> |
> |
> |
|
Luxury 2 |
< |
< |
< |
~ |
> |
> |
|
Economic |
< |
< |
< |
< |
~ |
> |
|
Sport |
< |
< |
< |
< |
< |
~ |
Same judgments one can obtain working with graphic representations of the intermediate and output data of the MCDA-problem. For this purpose, one can use the following diagrams:
· PROMETHEE I Partial Ranking;
· PROMETHEE II Complete Ranking;
· PROMETHEE Diamonds;
· PROMETHEE Network.
Let us consider each of these in details.
4.3. Diagram “PROMETHEE I Partial Ranking”
On the diagram, shown in Fig. 4, intermediate data visualization is presented. It is used to solve the problem using PROMETHEE I method. Each alternative is illustrated as a line segment. The ends of the segment are on the left and right axis. The left axis is directed upwards and reflects the values of Phi + for each alternative. The right axis is parallel to the left and is faced down. It reflects Ph- values for each alternative. Segments are constructed by connecting the points corresponding to the same alternative (on the left and right axis) .
Segment color reflects the membership of alternatives to different groups. This membership in Visual PROMETHEE Academic program defined by the user before the start of the computational procedure. In this example, three groups of alternatives had been set.
The first group of alternatives is Tourism cars. This group includes alternatives Tourism A and Tourism B. The corresponding to these alternatives segments are painted in turquoise color.
The second group of alternatives is Luxury cars. This group includes Luxury 1 and Luxury 2. The corresponding to these alternatives segments are painted in green color.
And finally, the third group of alternatives is none. This group includes alternatives Sport and Economic. The corresponding to these alternatives segments are painted in yellow color.
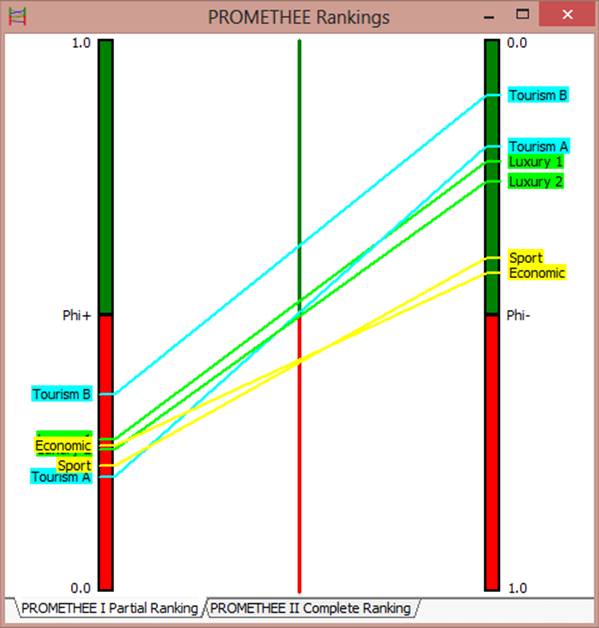
Fig. 4. Diagram “PROMETHEE I Partial Ranking".
We will show an example of how a user (analyst or decision maker) works with this diagram. Let’s take 2 alternatives: Tourism A and Tourism B. The segment corresponding to alternative Tourism B is located above the segment of Tourism A and does not have common interior points with it. This geometric predicate is interpreted as follows: strict preference relation is established between alternatives Tourism B and Tourism A, that is
Tourism B > Tourism A
Tourism A < Tourism B
Then we take another couple of alternatives: Tourism A and Luxury 1. The segments corresponding to these alternatives have a common interior point. It means that incomparable relation is established between alternatives Tourism A and Luxury 1, that is
Tourism A N Luxury 1
Luxury 1 N Tourism A
If there were segments that would be the same, on the diagram, then indifference relation (~) would be established between their respective alternatives.
If 2 segments would have a common end point (right or left), but one of them would place above the other, then the alternative corresponding to the segment, which is located above, would be considered as more preferable.
The matrix of binary relations from the previous section (table 1) and graphical representations in this section (Fig. 4) contain the same information but the form of presentation is different. Due to the pictures uncertainties or uncomfortable choice of colors, the user may have difficulties constructing geometric predicates. Still the graphical representation is more convenient for the user, since it allows him to analyze quickly the results of the solution of discrete MCDA-problems by PROMETHEE family. So the advantage of this visualization and all subsequent visualizations is the higher speed of making judgments about the alternatives.
If the user still has difficulties constructing the geometric predicate (for example, in the case where Phi + and Phi- of one alternative, very slightly differ from Phi + and Phi- of another alternative, so because of the image errors it is not clear if these segments are overlapping, the same, or one of them lies entirely above the other one), it is possible to appeal to the traditional tabular presentation of the intermediate data, where Phi- Phi + are recorded with high precision for each alternative .
Thus, the user can use both graphical and tabular presentation of the results for making the output judgments.
4.4. Diagram “PROMETHEE II Complete Ranking”
On the following diagram, that is shown in Fig. 5, the intermediate data visualization used for solving discrete MCDA-problems by PROMETHEE II is presented. It has only one axis – the Phi value axis. Phi value is calculated for each alternative as the difference between the Phi + and Phi-. Each alternative is associated with a point. There are the name and the value of Phi of the alternatives next to each point. It provides the same accuracy, that is provided by tabular presentation.
Let us remind that the PROMETHEE II method does not establish incomparable relationship between the alternatives. It establishes only the indifference relation, strict preference and strict antipreference between any two alternatives.
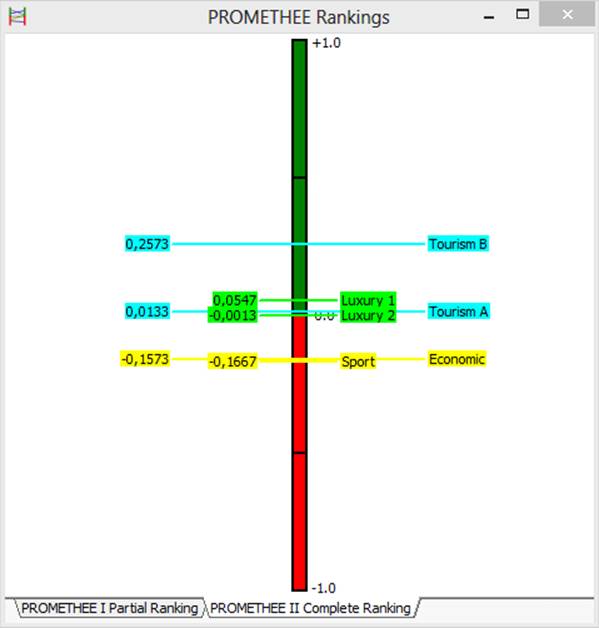
Fig. 5. Diagram "PROMETHEE II Complete Ranking".
If 2 points on Phi axes coincide, then indifference relation is set between these points’ alternatives.
If one of the points is above, then the corresponding alternative is considered as more preferred. In this example, the point corresponding to the alternative Tourism B is located above the point of Luxury 1. It means that strict preference relation is set between the alternatives Tourism B and Luxury 1:
Tourism B > Luxury 1
Luxury 1 < Tourism B
4.5. Diagram “PROMETHEE Diamonds”
On the following diagram, that is shown in Fig. 6, intermediate data visualization used for solving discrete MCDA-problem by PROMETHEE I and PROMETHEE II is presented.
The diagram shows two axes perpendicular to each other.
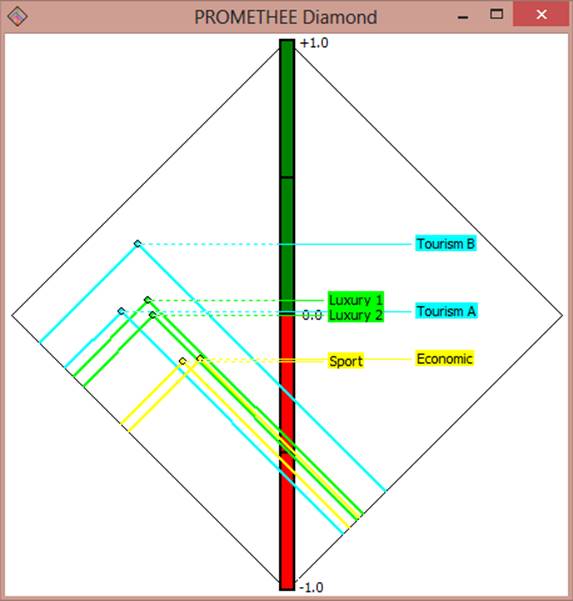
Fig. 6. Diagram "PROMETHEE Diamonds".
The axes in Figure 6 are poorly visible, so we have underlined them clearly in Fig. 7 and 8.
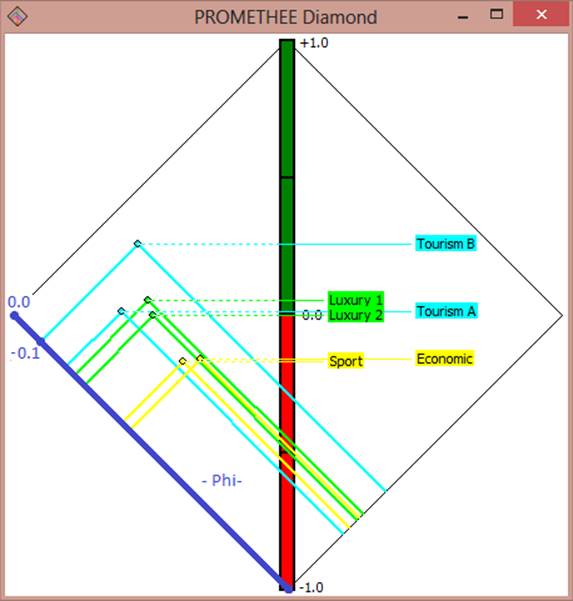
Fig. 7. Axis "- Phi-" in the diagram "PROMETHEE Diamonds".
The axis, that can be called “Phi-” multiplied by “-1”, is hightlighted with blue in Fig. 7. (It is shortly indicated as "- Phi-" in the image) We’ve also note on the axis values "0.0" and "-0.1" with blue color for clarity.
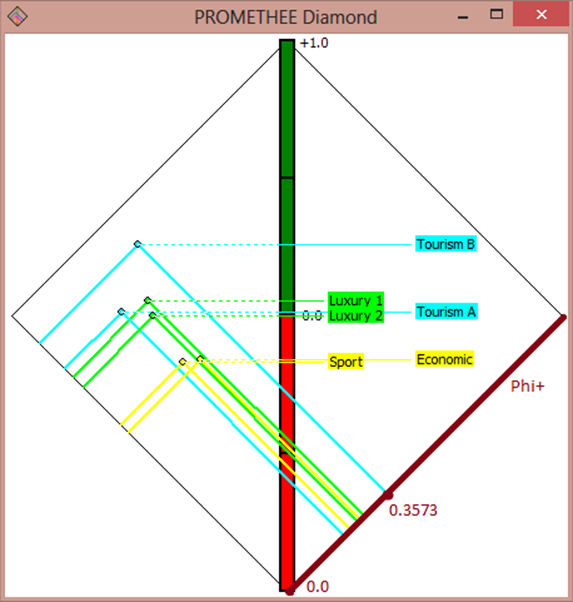
Fig. 8. Axis "Phi +" in the diagram "PROMETHEE Diamonds".
In Fig. 8 we have highlighted axis "Phi +" with magenta color and have marked values "0.0" and "0.3573".
On this diagram, all alternatives are associated with rectangles with a common vertex at the bottom. The second vertex is determined by the values of "Phi+" and "Phi-" for each alternative. The rectangles are constructed with sides parallel to the axes using these two vertices.
The diagram shows the results of both PROMETHEE I and PROMETHEE II methods.
Consider the construction and interpretation of geometric predicates for solving discrete MCDA-problem by PROMETHEE I.
If the rectangles corresponding to two alternatives are the same, then indifference relation is established between these alternatives.
The top vertex of Luxury 1 rectangle is an inner point for the rectangle corresponding to the alternative Tourism B. This means that alternative Luxury 1 is less preferred than alternative Tourism B. That is, antipreference relation is established between these two alternatives:
Luxury 1 < Tourism B
Tourism B > Luxury 1
Rectangles corresponding to alternatives Luxury 1 and Tourism A intersect and share a "lonely" (or discrete) point. It means that incomparability relation is established between alternatives Luxury 1 and Tourism A:
Luxury 1 N Tourism A
Tourism A N Luxury 1
One can note that there is a vertical column (axis) in the diagram. All the points of the rectangles are projected on the column.
If the projections of two points of rectangles are coincide, then indifference relation is established between their alternatives.
The projection of the point of the rectangle corresponding to the alternative Tourism B is located above the projection of the rectangle corresponding to the alternative Luxury 1. This means that relation of strict preference is set between these alternatives by PROMETHEE II :
Tourism B > Luxury 1
Luxury 1 < Tourism B
Since PROMETHEE II method does not establish incomparable relation between the alternatives, there is no geometric predicate, which could be interpreted as incomparability relations between these two alternatives.
4.6. Diagram “PROMETHEE Network”
On this diagram, shown in Fig. 9, the output data (the judgment obtained by the method PROMETHEE I) is shown as a graph.
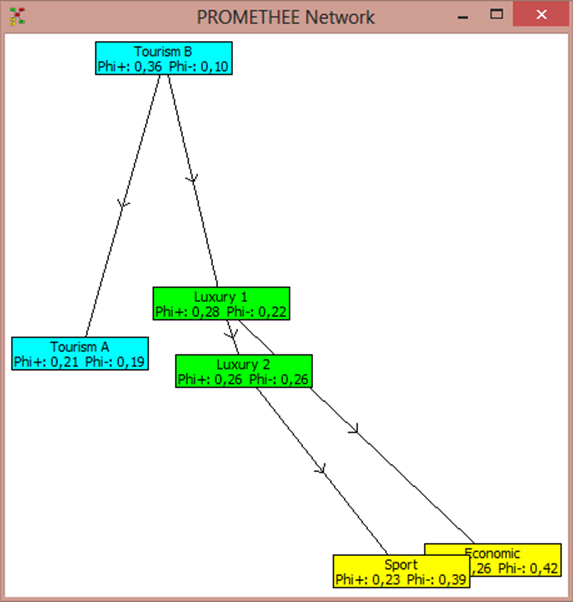
Fig. 9. Diagram "PROMETHEE Network".
Alternatives are reflected as rectangles (graph nodes) and they contain the name of the alternatives and the corresponding value Phi + and Phi-.
Rectangles, corresponding to alternatives Tourism B and Tourism A, are connected by an arrow. And an arrow goes from a rectangle corresponding to the alternative Tourism B to the rectangle corresponding to the alternative Tourism A. This means that strict preference relation is established between alternatives Tourism B and Tourism A:
Tourism B > Tourism A
Tourism A < Tourism B
Rectangles to alternatives Economic and Sport are not connected by an arrow. This means that between them incomparability relation is established:
Economic N Sport
Sport N Economic
4.7. Diagram “GAIA plane”
The most known way of visualization in the PROMETHEE methods family is the "GAIA plane".
Each alternative is described by the tuple of real numbers.
Computational procedures of PROMETHEE methods family convert tuples ![]() in
tuples
in
tuples ![]() .
Then a point of n-dimensional Euclidean space is assigned to each of these
tuples.
.
Then a point of n-dimensional Euclidean space is assigned to each of these
tuples.
Typically, in discrete MCDA-problem ![]() , therefore the
dimension reduction using the method of principal components is used. The
dimension of the space is reduced from n to 2. In this case, of course, only
part of the stored information is reserved.
, therefore the
dimension reduction using the method of principal components is used. The
dimension of the space is reduced from n to 2. In this case, of course, only
part of the stored information is reserved.
The points of n-dimensional space, the axes ![]() and
the vector
and
the vector ![]() (
(![]() -
weight criteria which are defined by the user) are projected on the plane. The
projection of
-
weight criteria which are defined by the user) are projected on the plane. The
projection of ![]() on the plane is denoted by
on the plane is denoted by ![]() , and the projections
of axes
, and the projections
of axes ![]() are
denoted by
are
denoted by ![]() respectively.
respectively.
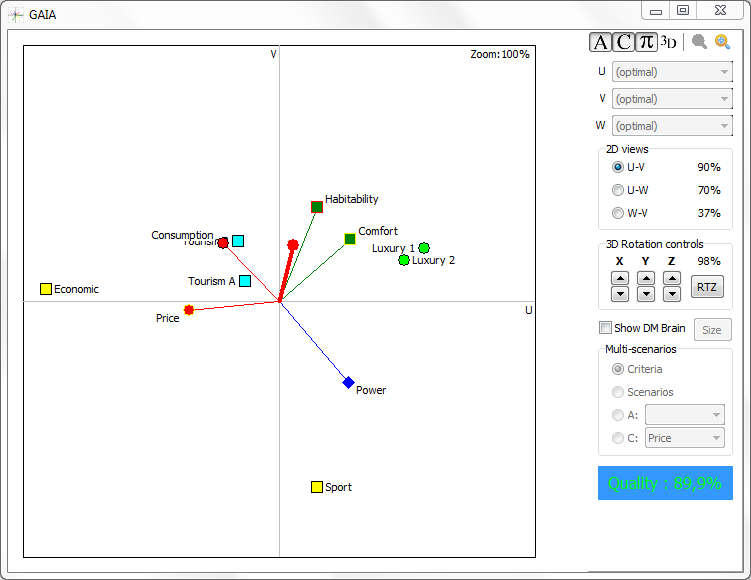
Fig. 10. Diagram "plane GAIA".
On the following diagram, that is shown in Fig. 10, intermediate data visualization used to solve discrete MCDA-problems by PROMETHEE II is presented.
GAIA plane allows the user to carry out an analysis of the conflict criteria significantly faster than working with tables. In addition, the user can identify similar alternatives much faster if he works with a visual representation of the data on the GAIA plane.
Information about the conflicting criteria and similar alternatives can help the user in the process of solving discrete MCDA-problem.
It should be noted that due to the loss of information while reducing the dimensionality of space, one should carefully use this visualization method.
5. Conclusion
In this article, a short historical review of the formation of the PROMETHEE methods family, as well as an overview of different methods of visualization that are used in this family was given.
It is mentioned that one uses the images for fast getting information on the resulting output and intermediate data of discrete MCDA-problem. He refers to the results in tabular form only when the need arises.
Usage of 3-dimenosional spatial scenes in GAIA, i.e. transition from the n-dimensional to 3-dimensional spaces, is proposed as a way of empowering the visualization. It allows preserve more information than during the transition to the two-dimensional space.
It’s advisable to append the traditional tabular input data representation with some supporting visualization with more complicated graphical interpretations. This would allow the analyst to reduce the number of alternatives before the usage of computational procedures of PROMETHEE methods family and to accelerate the further solution of the discrete MCDA-problem due to lower amount alternatives.
References
1. Diaby V., Campbell K., Goeree R. Multi-criteria decision analysis (MCDA) in health care: A bibliometric analysis. Operations Research for Health Care. 2013. 2(1-2). pp.20-24.
2. Adunlin G., Diaby V., Montero A., Xiao H. Multi-Criteria Decision Analysis In Oncology: An Overview. Value in Health. 2014. Vol. 17. No. 3, p. 184.
3. Shmelev S., van den Bergh J. Optimal diversity of renewable energy alternatives under multiple criteria: An application to the UK. Renewable and Sustainable Energy Reviews. 2016. Vol. 60. pp.679-691.
4. Felice F., Petrillo A. Multicriteria approach for process modelling in strategic environmental management planning. IJSPM. 2013. Vol. 8. No. 1. pp. 6.
5. Jaiswal R., Ghosh N., Galkate R., Thomas T. Multi Criteria Decision Analysis (MCDA) for Watershed Prioritization. Aquatic Procedia. 2015. No. 4. pp.1553-1560.
6. De Felice F., Campagiorni F., Petrillo A. Economic and Environmental Evaluation Via an Integrated Method based on LCA and MCDA. Procedia - Social and Behavioral Sciences. 2013. Vol. 99. pp.1-10.
7. Neves L., Dias L., Antunes C., Martins, A. Structuring an MCDA model using SSM: A case study in energy efficiency. European Journal of Operational Research. 2009. Vol. 199. No. 3. pp.834-845.
8. Behzadian M., Kazemzadeh R., Albadvi A., Aghdasi M. PROMETHEE: A comprehensive literature review on methodologies and applications. European Journal of Operational Research. 2010. Vol. 200. No. 1. pp.198-215.
9. Brans J.P., Mareschal B., Vincke Ph. PROMETHEE: a new family of outranking methods in multicriteria analysis. Operational Research, IFORS 84. 1984. Pp. 477–490
10. Brans J., Mareschal B. PROMETHEE methods. Multiple Criteria Decision Analysis: State of the Art Surveys. 2005. Pp. 163-196
11. Promethee-gaia.net. The PROMETHEE-GAIA FAQ. [online] Available at: http://www.promethee-gaia.net/faq-pro/index.php [Accessed 6.05.2016].
12. Brans J., Mareschal B. The PROMETHEE VI procedure: how to differentiate hard from soft multicriteria problems. Journal of Decision Systems. 1995. Vol. 4. No. 3. pp.213-223.
13. Brans J., Mareschal B. Promethee V: Mcdm Problems With Segmentation Constraints. INFOR: Information Systems and Operational Research. 1992. Vol. 30. No. 2. pp.85-96.
14. Macharis C., Brans J., Mareschal B. The GDSS PROMETHEE procedure. Journal of Decision Systems. 1998. Vol. 7. No. 4. pp.283–307.
15. Macharis C., Mareschal B., Waaub J., Milan L. PROMETHEE-GDSS revisited: applications so far and new developments. IJMCDM. 2015. 5(1/2). p.129.
16. Figueira J., Greco S., Ehrgott M. Multiple criteria decision analysis. 2005. New York: Springer.
17. Guitouni A., Martel J. Tentative guidelines to help choosing an appropriate MCDA method. European Journal of Operational Research. 1998. Vol. 109. No. 2. pp.501-521.
18. Zopounidis C., Doumpos M. Multi-criteria decision aid in financial decision making: methodologies and literature review. Journal of Multi-Criteria Decision Analysis. 2002. Vol. 11. No. 4-5. pp.167-186.
19. Roy B. Multicriteria methodology for decision aiding. 1996. Dordrecht, Netherlands: Kluwer Academic Publishers.