IMAGE TEXTURE CHARACTERISTICS VISUALIZATION BASED ON HARALICK MATRIX
A.K. Troitsky
National Research Nuclear University MEPhI (Moscow Engineering Physics Institute), Russian Federation
Contents
2. Texture image characteristics
3. Haralick matrix visualization
Abstract
The article considers scientific visualization method for images with obviously marked texture characteristics. Similar image type particular property is that it is very difficult for a man to give some impartial estimation for them. Metallography, medicine, wood structure and aerial photography image examples are given as texture image patterns. Haralick matrix was chosen as main characteristic for texture image visual estimation. Different algorithm calculation modifications are suggested. They allow to take into consideration the scale and the turning angle for analyzed texture images by pixel location changes. Haralick matrix visualization algorithms were developed. They allow to demonstrate the Haralick matrix at the monitor in visual form. Gamma – correction image enhancement methods are used for more high-quality visual perception of formed images. Texture image characteristic visualization program complex was developed based on simple and modified Haralick matrixes with image quality enhancement possibility. This program complex was tested for real metallography image examples. Received results give chance to assume that visualization method application by the analysis of information, which is difficult to perceive, will be very effective for practical tasks solving in various areas.
Keywords: scientific visualization, texture, image texture characteristics, Haralick matrix, Gamma – correction.
1. Introduction
Usually scientific visualization is understood as graphical representation of information obtained as a result of theoretical or pilot studies. The essence of a method of scientific visualization is that some of the static or dynamic graphic interpretation which is visually analyzed is put in compliance to the basic analyzed data, and results of the analysis of this graphic interpretation (graphic data) are interpreted by the researcher in relation to basic data [1]. In many cases the method of scientific visualization is used when initial information can't be reproduced directly because nobody ever saw it (for example, because of very big or very small sizes). Other situation – abstract character of the displayed information (for example, n-dimensional space). One more option exists by which the person sees initial real information, but because of various reasons can't give it any assessment. Texture images belong to such types of information. As many texture images contain information (texture) which is rather difficult for analyzing for the person, the main objective of the analysis is the stage of identification of texture existence and their characteristics which can be not visible for human eye. Detection of various texture existence on the image also gives an assessment of characteristics of the found textures that is of great importance by the solution of tasks of the image analysis. In metallography – this is identification of metal quality, by aerial photography – parameters of different types of a terrestrial surface, in medicine – disease severity, in the woodworking industry – by wood assessment etc. [2-7]. Examples of texture images are given in the following figures.
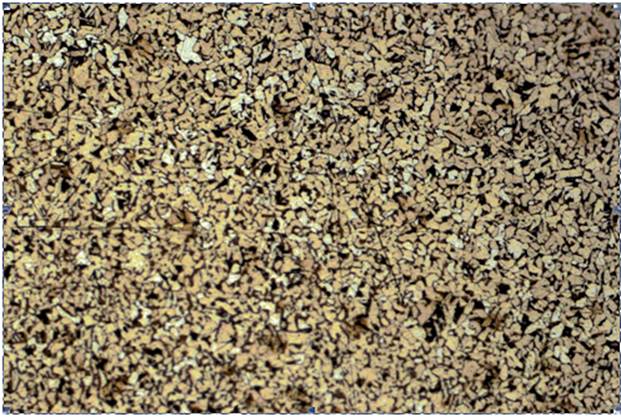
Fig. 1. A steel microstructure at 1000-fold zoom.
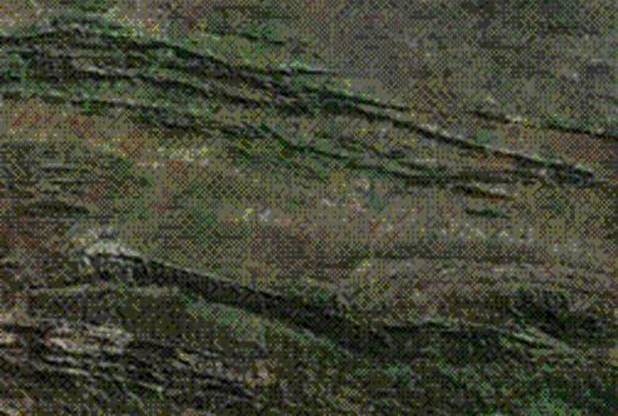
Fig. 2. Fragment of an aerial photograph of the mountain system.
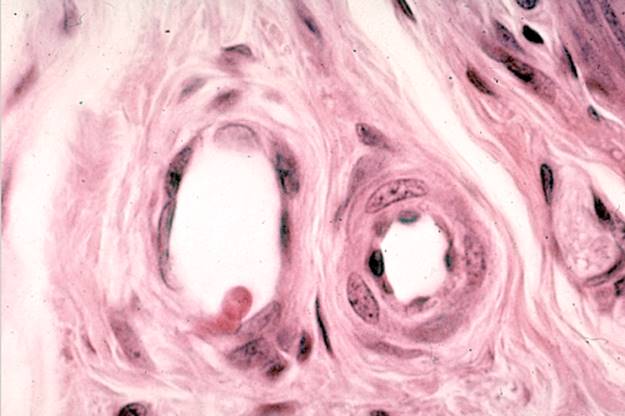
Fig. 3. Image of a histological preparation.
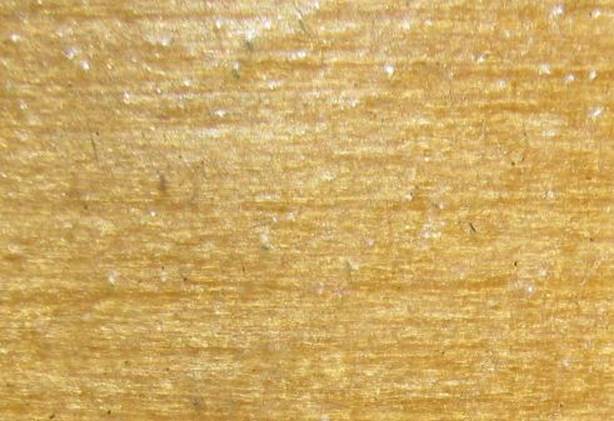
Fig. 4. Texture of wood.
In the simplest case it is possible to divide texture into two types - fine-grained and coarse-grained. For example, the fine-grained texture is formed when there are a large number of distinguishable pixels in small area of the image and their casual location. In that case when the location of pixels is more certain, and certain regularly found elements of the image have the increasing sizes, the coarse-grained texture takes place.
In the analysis of image textures it is possible to allocate the following main approaches:
1) The methods based on Haralick matrix calculation [8].
2) The methods describing textures by lengths of series [7].
3) The methods using measurement of spatial frequency [9].
4) The methods based on calculation of difference number per unit of image area [5].
For methods of the first type with the growth of distance between the estimated points in fine-grained textures the change of brightness distribution takes place quicker, than in coarse-grained ones. For the second one these series are shorter in constant brightness point lines on fine-grained textures, than on coarse-grained. For methods of the third type in coarse-grained textures low spatial frequencies prevail, and in fine-grained textures - high spatial frequencies prevail. For the fourth one on coarse-grained textures this frequency is small, it increases with reduction of granularity of texture.
From the point of view of visual perception of texture images by human eye the most difficult are those which are processed on the basis of Haralick matrix (the 1st method). On the images processed by means of the methods 2-4 a human eye is still capable to distinguish something. For fine-grained texture with location of pixel values on the image almost in a random way a human eye isn't capable to estimate visible information. It can be realized only on the basis of the 1st method.
Now many works for the automatic analysis of textural images are conducted. However, all of them are, as a rule, intended for work in one area – medicine, metallography, processing of aerial photography of certain types of a terrestrial surface, etc. The main problem is that it is a very complex task to consider at the same time possible casual changes of scale, rotation angle and illumination of the image by possible casual changes of geometrical characteristics of the studied objects. At the same time often it isn't obligatory to have exact values for the analysis of such class of images; only approximate estimation of results is enough. For this purpose, it is necessary to make transformation of the image into such form of information in which it will be possible to make the decision by this form.
2. Texture image characteristics
One of the main characteristics of the images containing the spatial and brightness information is the texture which is present practically at all images. Texture is understood as the existence on the image of repetition of certain basic primitives having various orientations in space and not having visible edges. One of the simplest examples is a chessboard. Brightness changes from very dark to very light through certain intervals vertically and horizontally. Real textures are much more difficult: the texture can be broken in any part of the image, the image can be insufficiently clear, besides basic elements of texture are practically never squares, and regularity of their repetition, as a rule, has much more casual character.
One of the main ways of the description of texture is Haralick matrix. It serves as the statistical tool intended for the accounting of cases of emergence in the image of combinations of brightness of a certain configuration [8]. The matrix is formed in the following way. Let there be an analyzed grayscale black-and-white image of any dimension, and the brightness has 256 gradations – from 0 (black) to 255 (white). Haralick matrix has dimension of NxN where N – number of gradation of brightness in the image. In our case the matrix will be 256?256. By creation of a matrix each pixel of the image is processed. At first in the formed Haralick matrix the line with the index equal to brightness of pixel of the analyzed image is fixed. Further all next pixels are considered (next at the left, on the right, from above and from below). For each of them the column is fixed with the index equal to its brightness, and to pixel value standing on crossing of the chosen line and column 1 is added. And this repeats for all next pixels. Further transition to the following pixel of the image is carried out and procedure repeats. Thus, if there are N possible gradation of brightness, then P Haralick matrix will be a matrix of dimension NxN and in each element of Pi,j will be "counter" of amount of values of brightness in the image when the main pixel and pixel which is with the basic one in defined neighbourhood relation have values of brightness of i and j respectively. By the matrixes form of spatial contiguity it can be judged about specificity of the image. So, for a chessboard Haralick matrix will have dimension 2?2 and all elements, other than zero, will be located in the right top and left bottom corner of a matrix since in this case to dark elements adjoin light ones, and light elements adjoin dark ones.
The algorithm of Haralick matrix calculation suggested for the first time assumed the location of the basic and adjacent elements as it is represented in fig. 5 a) where the central element has blue color and adjacent ones – red. Further developers of systems of processing and recognition of texture images used the fixed option of location of adjacent elements, even not next, and the type of texture – fine-grained or coarse-grained was known. It can be explained with the fact that for the automatic analysis of texture images it was possible to organize the identical scale and rotation angle of the studied images and approximate parameters of textures were known in advance. Haralick matrixes received in such conditions were easy compared among themselves. For them various estimated coefficients were calculated which were also easily estimated and compared among themselves, etc. Usually such approach is used in process by assessment of a large number of texture images. At the same time the automatic solution of tasks of an assessment of separate images with textures of a different sort, with a different scale and rotation angle with the scientific purposes, was very complex scientific and technical challenge. However, with the emergence of high-speed computers and the necessity of various scientific information visualization it became meaningful to use also other positions of the next elements for Haralick matrix calculation. In this case the operator -person analyzing texture images with the scientific purposes using the experience by simple search of the variants suggested to him, selects an optimum way of localization of the adjacent elements.
The classical algorithm of Haralick matrix calculation can be modified as follows. Instead of adjacent with central elements it is possible to consider any others as, for example, it is represented in fig. 5.
|
|
|||||
|
a) |
b) |
c) |
d) |
e) |
f) |
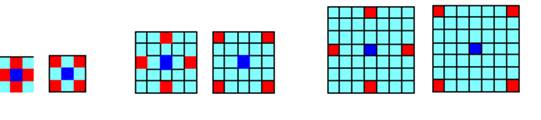
Fig. 5. Options of location of adjacent elements.
In these cases, the modified Haralick matrix will allow to allocate any types of textures having various scales or rotation angle of the image. It is possible to suggest a set of options of location of other elements and each of them can be applied for the solution of any practical task.
3. Haralick matrix visualization
The created Haralick matrix has the following characteristics:
· dimension of the matrix is 256?256 elements (256 – standard number of brightness gradation of monitors);
· range of elements values of the matrix from 0 to ~ (HxWx4), where H – number of lines in the analyzed image, W – number of columns.
It is obvious that it is impossible to display entirely on the monitor such matrix in a numerical presentation to estimate completely all the information of the image. The solution of this problem is output of the matrix in the form of the image, i.e. the image of 256?256 pixel dimension which brightness values will correspond to values of Haralick matrix elements.
The problem will be in this case that brightness values of the monitor can change in the range from 0 to 255 while the maximum values of Haralick matrix elements can have values much bigger. The solution of this problem will be the normalization of values of Haralick matrix elements so that they change in the range from 0 to 255. It is realized in the following way. Among the elements of Haralick matrix one should find such element which has the maximum value. His value is divided on 255. We get K normalization coefficient. Then all the values of Haralick matrix elements are divided to K. As a result, we get the normalized Haralick matrix. All elements of the matrix change in the range from 0 to 255 and can be directly used as brightness values of pixels of the image. The disadvantage of such a way of normalization is the following. It is possible that one element can be much bigger than the others. In the case of presence of one very "strong" texture on the image the value of one element will be much more than 255.In this case the normalized matrix will have only one non zero element. Its value will be equal to 255. It won't give the chance to find “weak” textures on the image. For the elimination of this shortcoming it is necessary to use by the normalization the approach similar to degree method of image improvement (gamma-correction [9]). Its essence is that by normalization of pixel element value of he image decrease not by division or multiplication by one fixed value of K normalization, but by means of raising the values of Haralick matrix elements to the power more, or less than 1. Then it is necessary to make the normalization for the created matrix in the way described above. It allows to see the presence of “weak” textures on the transformed and normalized Haralick matrix presented in the image form.
As a result of the conducted research the program complex is developed for visualization of texture characteristics on Haralick matrix basis.
It is developed in the DELPHI programming environment. Input data are the color images in the .BMP format. It should be noted that in this format the analyzed image should be coded directly after reading of the image. It means that for obtaining the processed image it is impossible to use simple digital cameras because all of them store images in .JPEG format. They can be transformed to the .BMP format by means of any graphical package. However, quality of the image received in such a way will be insufficient to analyze its texture characteristics. For preparation of images for such system it is necessary to use one of two ways. The first is to use for shooting more complex digital cameras allowing to register pictures in formats, similar or close to .BMP (for example, the .RAW format). The second is to use the photos received by means of the film camera and to digitize them by means of the scanner directly in the .BMP format.
Program complex includes the following stages.
1. After start of the program the image of the following type appears on the monitor (fig. 6):
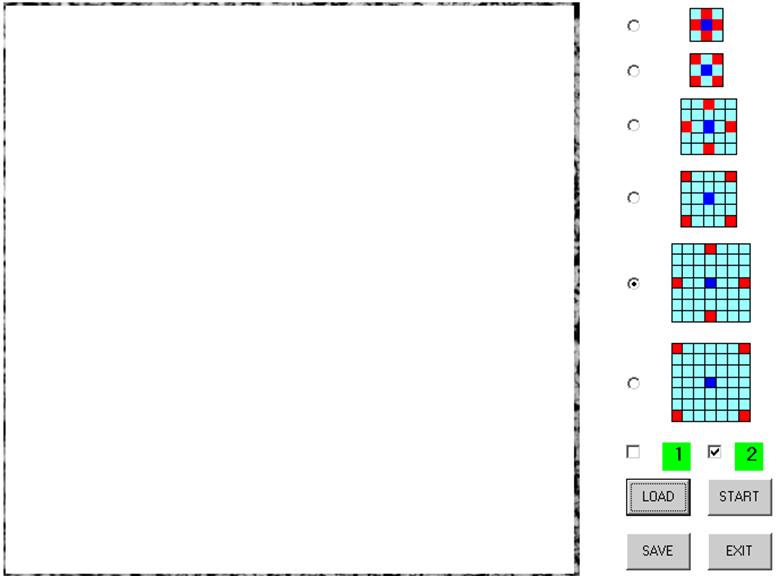
Fig. 6. Initial view of the monitor at the start of the program.
The white field – the area of the image. Color matrixes show the chosen options of contiguity of pixels. The indexes marked green allow to choose option of the brightness correction of the image of Haralick matrix displayed on the monitor.
Standard LOAD, START, SAVE and EXIT control keys are below.
2. By means of the LOAD key the analyzed image which appears on the monitor (fig. 7) is selected from the list of files which has appeared in a window.
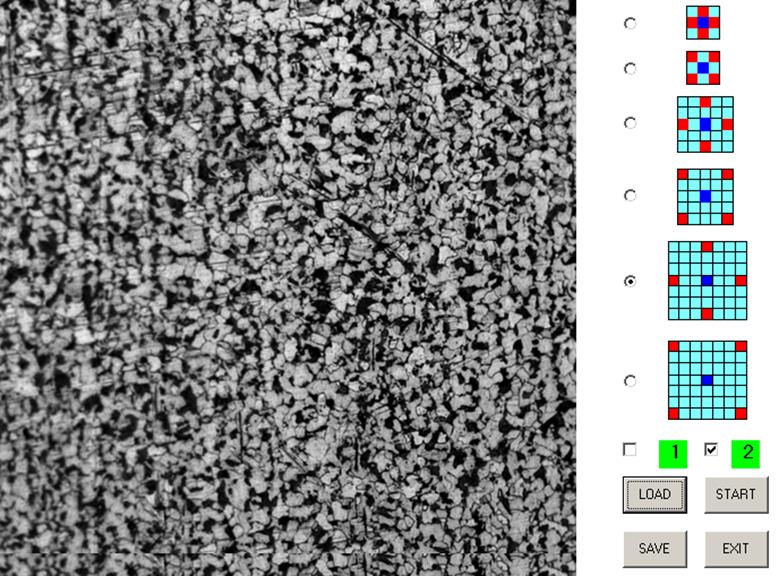
Fig. 7. The analyzed image.
3. On the right on the monitor there are 6 vertical buttons with the corresponding pictograms. They show possible combinations of pixels adjacent. The operator chose the necessary option of Haralick matrix calculation. They give the chance to set necessary initial parameters in the program. The choice of option depends on a type of the analyzed texture (fine-grained or coarse-grained), and also on scale and rotation angle of the image. This choice, as a rule, is based on experience of the operator. Besides, as processing happens almost instantly, in the simplest case the operator can see all options.
4. The lower two horizontal buttons with tags 1 and 2 give the chance to the operator to use gamma-correction by output on the monitor in case of need to improve the image. Here three options are possible. If both fields of indexes are empty, then gamma-correction isn’t applied. If the index with number “1” is marked, then the coefficient of gamma-correction is accepted equal to 0.5. If the index with number “2” is marked, then the coefficient of gamma-correction is accepted equal to 2.
5. At the START command Haralick matrix calculation is made which is displayed on the monitor in the form of the image. The SAVE button allows to save the received result in a graphic form in the case of need. At the EXIT command there is exit from the program. The result of the processing of the image given on fig. 7 is shown on fig. 8.
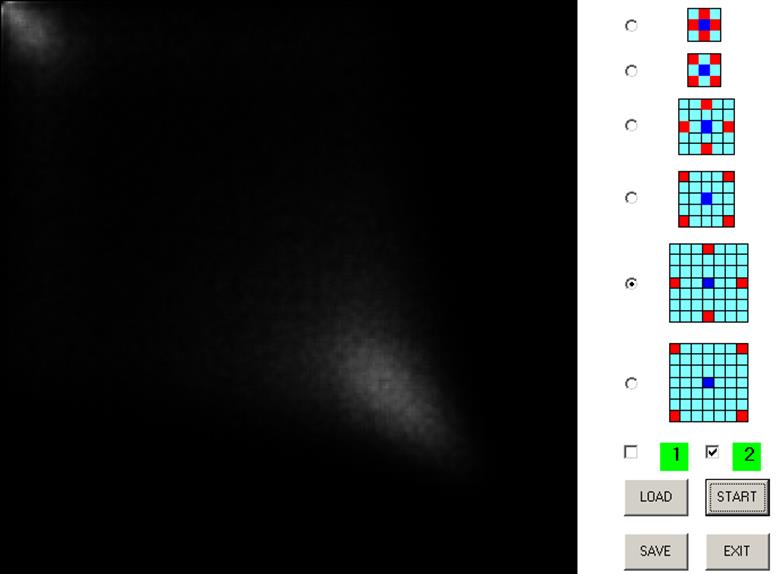
Fig. 8. The visualized Haralick matrix.
The practical value of the developed system was shown on the following example. Two photos containing images of structure of metals at 1000-fold zoom are used as test samples. One of them has the structure of the intact metal, the other – deformed one. By a simple look it is almost impossible to find differences in the images. But, after calculation and visualization of Haralick matrixes for them, it is possible to notice differences without effort and, thus, to find defective metal. The images of the intact and deformed metals are given on fig. 9, 10. Below on fig. 11, 12 the visualized Haralick matrixes corresponding to them are shown.
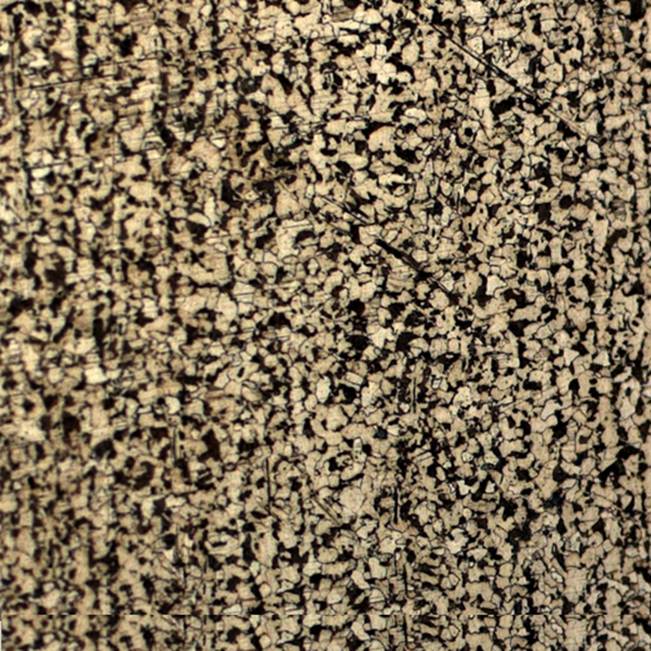
Fig. 9. Intact steel.
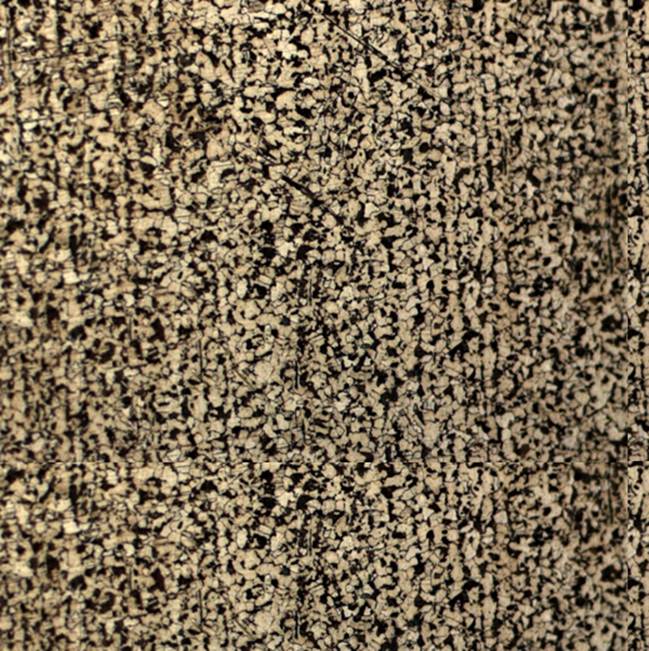
Fig. 10. The deformed steel.
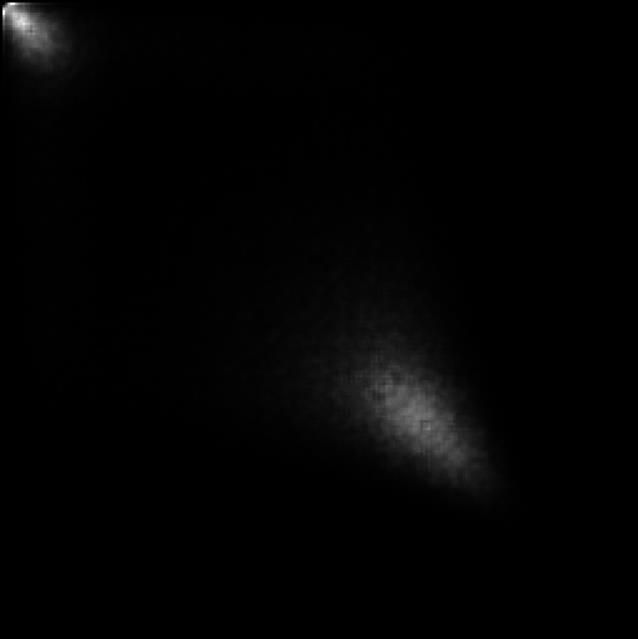
Fig. 11. The visualized Haralick matrix for the intact steel.
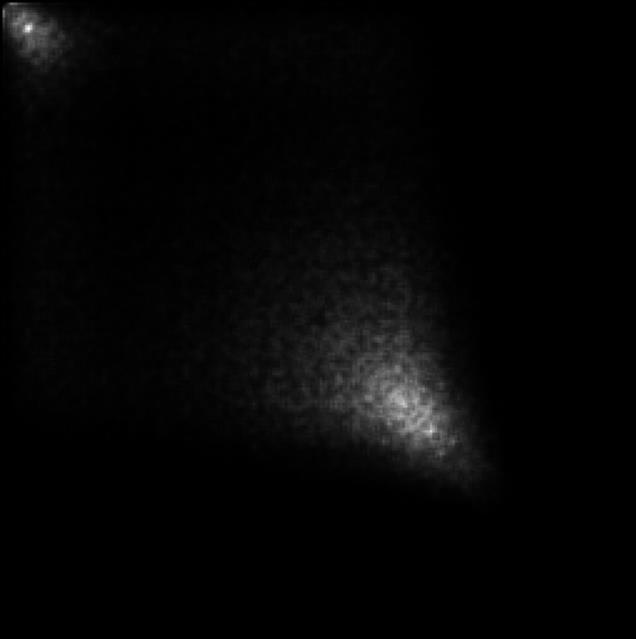
Fig. 12. The visualized Haralick matrix for the deformed steel.
On the images with Haralick matrixes differences are well visible for the intact and deformed steel. By the form initial images, it is clear that they aren't fine-grained. After the implementing all the possible combinations it has been revealed that differences are most well visible for the texture types by the 5th option of the location of adjacent elements and when gamma-correction coefficient is equal to 2, as shown on fig. 8. Therefore, the use of the visualized Haralick matrix allows to carry out the analysis of metallographic images on which it is difficult to find differences in a usual form.
4. Conclusion
Application of scientific visualization methods for the solution of tasks in which the analyzed information is provided in the form difficult for direct visual perception gives the chance to easily carry out the analysis of the studied data and to make necessary decisions. In this work the use of scientific visualization methods was shown for images with obvious texture characteristics.
Various modifications of calculation algorithms for the matrixes similar to Haralick matrix are suggested. The algorithms of Haralick matrix visualization are developed allowing to realize normalization and improvement of images on the basis of gamma-correction.
The program complex is developed for visualization of texture characteristics of images on the basis of Haralick matrix. Testing of the developed program complex on real images of metallographic type is carried out. Tests have confirmed working capacity and practical value of the developed complex. The received results give the chance to assume that the use of visualization methods in the analysis of information which is difficultly perceived by a human will be rather effective by practical use in various areas.
References
1. Strikhanov M.N., Degtyarenko N.N., Pilyugin V.V., Malikova E.E., Matveeva M.N., Adzhiev V.D., Pasko A.A. Computer Visualization of Nanostructures Experience at NRNU "MEPhI". Scientific Visualization, vol. 1, no. 1, 2009, pp. 1–18. [In Russian]
2. Perfilyev D. A. Klassifikatsija segmentov metallograficheskih izobrasheniy deformiruemyh aljuminievyh splavov. [Metallography Image Segment Classification of Deformed Aluminium Alloy]. Reshetnev Siberian State Aerospace University Journal. No.10, Krasnoyarsk, 2006, pp. 16- 78. [In Russian]
3. Bortnikov A.I., Minakova N.N. Teksturno-fraktalny analiz mikroskopicheskih srezov obraztsov kompozitsionnyx materialov, napolnennyh tehnicheskim uglerodom. [Texture-fractal analysis of microscopic section of composites filled with commercial carbon]. Tomsk State University Journal. 2006, vol. 309, no. 6, pp. 64-67. [In Russian]
4. Kirbizhekova I.I., Chimitdorzhiev T.V., Bikov M.E. Otsenka landshafnyh izmeneniy severnyh territoriy na osnove tekstury radarnyh izobrasheniy. [Evaluation of Landscape Change Northern Territories Based on Texture of Radar Images]. Russian Physics Journal. 2013, vol. 56, no. 8/2, pp.196-197. [In Russian]
5. Mitsel A.A., Kolodnikova N.V., Protasov K.T. Neparametricheskiy algoritm teksturnogo analiza aerokosmicheskih snimkov. [Nonparametritic Aerospace Photo Texture Analysis Algorithm]. Tomsk State University Journal. 2005, vol. 308, no. 6, pp. 66-70[In Russian]
6. Kosykih N.E., Smagin S.I., Gostyushkin V.V., Savin S.Z., Litvinov K.A. Sistema avtomatizirovannogo kompjuternogo analiza meditsinskih izobrasheniy. [Automatized Computer Medicine Image Analysis System]. Informational Technologies and Computing Systems. 2011, no 3, pp. 52-60. [In Russian]
7. Kovalev V.A. Analiz tekstury trehmernyh meditsinskih izobrasheniy. [Three-dimensional Medicine Image Texture Analysis]. Minsk: Belarusian science, 2008., 263 pp. [In Russian]
8. Haralic RM. Statisticheskiy i strukturniy podhody k opisaniyu tekstur. [Statistical and Structural Approaches to Texture]. Proceedings of the IEEE. vol.67, 1979, no. 5, pp. 98-120. [In Russian]
9. R. Gonzalez, R. Woods. Tsifrovaya obrabotka izobrasheniy. [Digital Image Processing]. Moscow: Technosphera, 2005, 1072 pp. [In Russian]