THE EXPRESS CASE ANALYSIS RESULTS VISUALIZATION
A.A. Artamonov, G.A. Ananieva, E.S. Tretyakov, B.N. Onykiy, L.V. Pronicheva, K.V. Ionkina, A.S. Suslina
National Research Nuclear University MEPhI (Moscow Engineering Physics Institute), Russian Federation
AAArtamonov@mephi.ru, a_ananieva@bk.ru, EvheniyTretyakov@yandex.ru, BNOnykij@mephi.ru, LVPronicheva@mephi.ru, ionkinakristina@gmail.com, suslinaalena@gmail.com
Contents
3.3. Tools of visualization and graph design
Abstract
This article comprises example of typical analysis of cases that may occur in any scientific or technological area. The submitters for information-analytical researches are various decision-making bodies, project managers, companies’ and corporations’ management, governmental and international organizations. The vast majority of decision-making systems are hierarchically structured. Therefore, the results of case analysis are allocated from the bottom to the top of hierarchy’s levels in relation to the importance and criticality and reach the highest management levels and even government leaders. That forms the indispensable requirements to the analytical reports: brevity, visualization, clarity, conclusiveness. A visual representation of the Express analysis results is both an argumentation framework for decision-making and decision-making process accelerator. The authors form operational group that collectively performs case analysis as part of Multiagent informational and analytical system on scientific and technological areas in the National Research Nuclear University MEPhI. Suggested methodology of express case analysis might be of the interest for experts on system analysis that perform similar kind of studies.
Keywords: agent, multi-agent system, data mining, rapid analysis, situational analysis.
1. Introduction
Nowadays the amount of information resources of scientific and technical directivity in the Internet is increasing rapidly; however, their dispersion across the numerous sources is taking place. Despite the attempts of information resources standardization, the amount of various access systems to this information is increasing.
Under these circumstances traditional conversational access systems are not able to give prompt responses to the not-standardized users’ requests. Such problems solution is possible with the use of agent-based technologies for searching and processing large amounts of information.
Since 2010 Department of Analysis of Competitive Systems of National Researching Nuclear University "MEPhI" has been working on specialized system of natural-scientific and technological disciplines support. The developing system is called "Multiagent-based information-analytical system for natural-scientific and technological disciplines" (MIAS). MIAS is put into experimental-industrial operation in the range of Russian scientific organizations.
At the beginning of elaboration of the system, such regular agent-based techniques as emission of thematic news digests, construction of semantic networks, linking numerous objects of professional interest with different kinds of relation - were automated [1], [2]. However, when operating systems had different tasks that need immediate solutions, the problem of adding the ability to reach the target, user requests with information and analytical support arose consequently.
One of the main goals of information-analytical researches is an object condition or a case analysis. And all the totality of information-analytical tasks, which are to be completed - is called express-analysis. This article reviews a typical procedure of express-analysis, methods to get the initial data, and general approach to solve a problem.
Common requirements to the result of express-analysis are following:
· Report has to be completed within several days, or even several hours.
· It has to be maximally brief and understandable for all the decision-making levels.
Fulfilling the last requirement is possible with the help of results visualization tools mentioned in this paper.
For greater distinctness of express-analysis, one of the real problems of evaluation of the situation in "Laser industry technologies" sphere was selected and described in this paper.
2. Case analysis methodology
Case analysis, like any other activity, can be represented by a sequence of operations. There are a large number of models and software tools that reflect the sequence of operations. The peculiarity of the problem being solved is that in some map you need to provide the following information:
· information resources that will be used in the description and analysis of some case;
· the tools needed to work with selected information resources;
· professionals who are responsible for performing analytical work;
· logical sequence and interpretation of the analysis results.
The pictorial representation that reflects the described above information will be called the operating map. General view of the Operating map is shown in Fig.1.
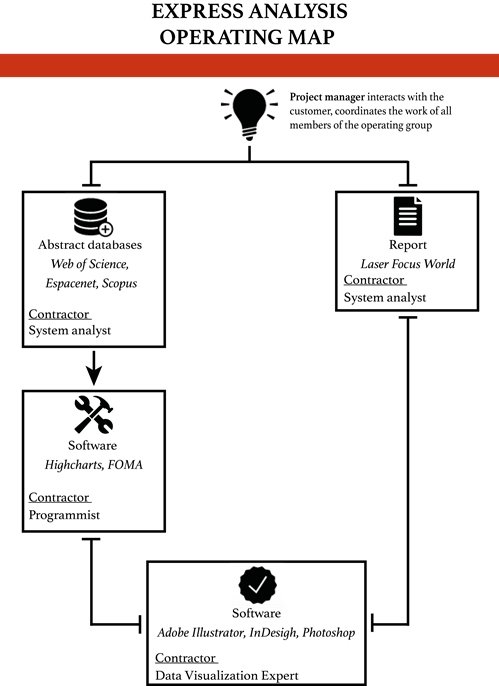
Fig. 1. Express analysis Operating map.
According to Figure 1, for the outcome document successful formation a group of performers is needed, namely, an operating group of four people, with the following responsibilities:
· Project manager interacts with the customer, coordinates the work of all members of the operating group;
· System analyst builds a common communication scheme of all processes required to solve the problem, selects resources and tools for each of them, and further, using the selected means, carries out analytical research;
· Computer Software programmer is involved in development or customizing software tools, providing technical support;
· Data Visualization Expert is responsible for structuring of material, visualization of results and final report.
The operating map shows that it is necessary to cover and analyze scientific and industrial component of modern laser technologies in order to comply with characteristics of the task. These two processes are performed in parallel and explicitly independent from each other. The collected materials are processed by a system analyst with the help of custom instrumentation developed by programmer in order to obtain pertinent information. A summary document is delivered to a data visualization expert in order to build charts, based on the appropriate level of data recognition of decision-making person, for whom it will be submitted.
The aim of case analysis is to search for the answer to the questions the customer is interested in and provide all necessary amount of information in a short time. Use of the operating maps and the formation of a performers team with an appropriate distribution of responsibilities contribute to the automation of processes at all stages of document development.
3. Results and experiments
3.1. Scientific achievements
The ideology of using agent technologies is to maximize the automation of the search and information structuring mechanisms. Basing on the three-level model for structuring scientific and technical information is needed to define a group of information sources, both open and with restricted access, which should adjust agents’ postmen.
In this case, the information sources are: conference materials, scientific journals, specialized websites, patents and others.
Due to the inability of setting the operational system on all organizations working in the thematic direction, it was decided to obtain information from scientific databases such as Web of Science and Scopus [3], [4]. The database Espacenet [5] was selected as an information source for patents searching events.
A significant limitation for the work implementation was the inability of using existing thesaurus for "industrial Laser technology", as it is focused on information support of the determination but not the direction analysis, which is required accordingly to the task.
A representative sample of publications and patents for the period of 2006-2015 in the thematic area of "Laser technologies" (Table 1) was obtained from the above stated sources.
Table 1. Search results for scientific achievements.
|
Year |
Publications number |
Patents number |
|
2006 |
32127 |
39102 |
|
2007 |
34515 |
40898 |
|
2008 |
34879 |
41581 |
|
2009 |
34823 |
41233 |
|
2010 |
36302 |
41690 |
|
2011 |
37416 |
46351 |
|
2012 |
39327 |
51473 |
|
2013 |
40724 |
54179 |
|
2014 |
39741 |
53374 |
|
2015 |
37284 |
25910 |
As a result of analysis and systematization of the collected data a graph reflecting the dynamics of publication and patent activities over the period from 2006 to 2015 was built. The trend line located at the top of the chart reflects the direction of laser technologies development and gives an Outlook for the short period of time (Figure 2).
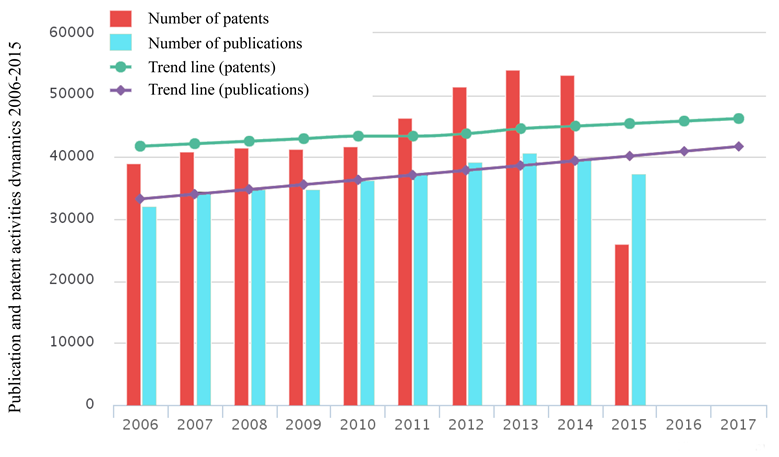
Fig. 2. Publication and patent activities dynamics 2006-2015
It should be noted that the data on scientific papers in abstract databases is published with delay, as each article passes the review process, then significant time is wasted waiting for their turn in the press (from a few months to a year).
The newest information about latest developments can be found in the materials of events held on a given topic - conferences, symposia, etc. -, because in this case the time interval between the date of their appearance to the date of the publication is shorter.
In the MIAS system a representative sample of the 42 largest conferences in the field of "Laser technology" for 2015 was loaded. From the resulting discharge all the keywords were highlighted and an initial cluster that includes more than 9,000 words and phrases was formed. After the analysis of usage frequency of single words in phrases, the most common formed dictionary which was used for further analysis.
Keywords distribution presented in Figure 3 enables to track the major direction of development of laser technologies, based on materials of conferences in 2015. On the basis of this distribution we can make conclusions about the existing trends in the field of "Laser technology" and leading world centers scientific activities. The most popular are the combinations: fiber laser, high power diode laser.
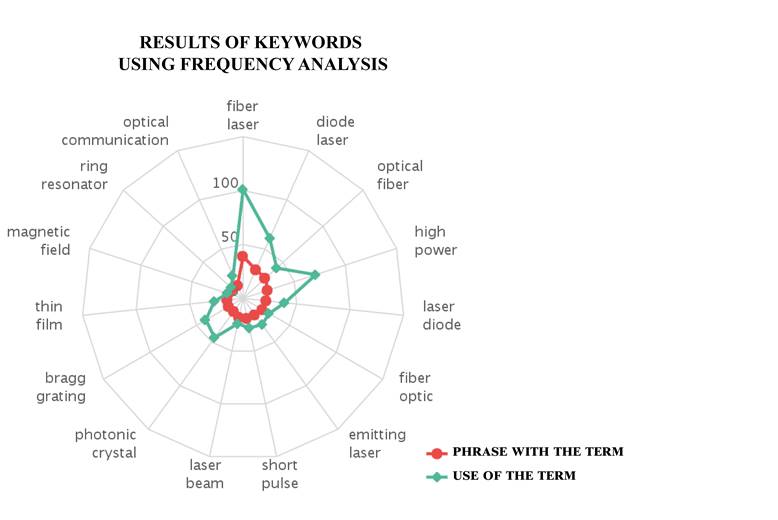
Fig. 3. Results of keywords using frequency analysis.
3.2. Industrial applications
As the industrial applications data source, we used the result of specialized organizations reports monitoring, dealing with the publishing information about researches and current state of laser technologies.
The use of already prepared reports and systematized allows to obtain high-quality material, greatly reducing the time of the search. In this case, the conclusions were taken to the annual report from Laser Focus World [6] – monthly publication focusing on laser technologies, since the frequency of the use of keywords and attributes of the publications was high.
As a result, following prospective directions of development of laser technologies were identified:
1. communication and optical media;
2. processing of materials and lithography;
3. medicine and aesthetics;
4. devices and sensors;
5. special projects;
6. entertainment and displays;
7. images recording and printing.
On the basis of the received information, system analyst has created a short summary and scheduled the graph of funding for each direction. Figure 4 shows an example of graph of the direction "Communication and optical media" funding.
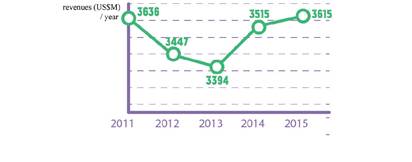
Fig. 4. Graph of the direction "Communication and optical media" funding.
3.3. Tools of visualization and graph design
One of the main goals of express-analysis is to visualize the received data in order to enable specialist of any qualification to use it without extra explanation. This raises the challenge of maintaining accurate information in combination with the simplicity of its perception.
In this report, for the purpose of achieving maximal accuracy of the calculations, Matplotlib [7] - library of Python [8] programming language, which was created for scientific computing, was used.
Graphical representation was carried out through http://www.highcharts.com [9], where all the constructions are implemented with the JavaScript programming language, jQuery [10] module. Adobe Illustrator, Photoshop and InDesign [11] were used for the document design.
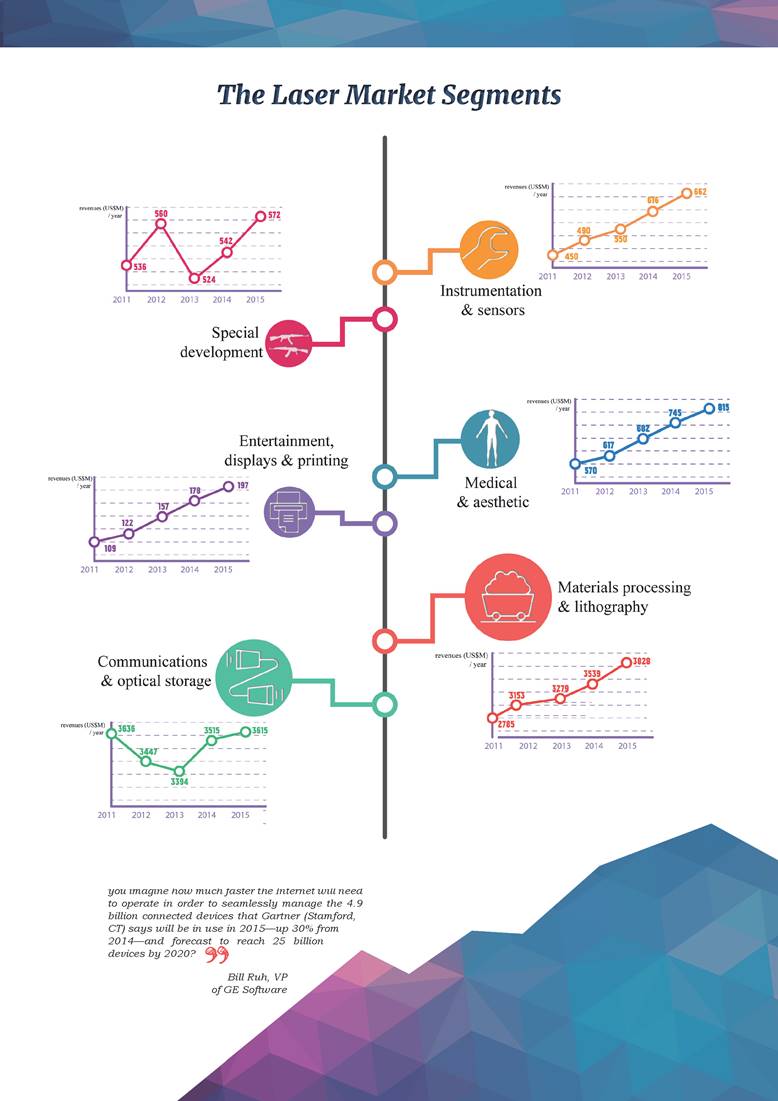
Fig. 5. Shows a fragment of information about most prospective areas in laser industrial technologies graphical visualization.
4. Conclusion
Designed by MIAS automated mechanism allows to obtain a unique type of document – Express Case analysis in scientific and technical areas.
Fast and efficient search agents’ performance, properly selected sources and search tools enabled the development of high-quality, informative report for the shortest possible time. The combination of precision and novelty of data, systematization and visualization makes this document universal for making decisions by any manager and accelerates the decision-making process.
The solution described in this article can be scaled for any subject area in a short time. Due to the use of a large material selection and the lack of expert estimates involvement during the developing of this document it is possible to mention some level objectivity of the analysis.
Gratitude
The authors express their gratitude to the head of the laboratory of "Industrial Laser technology" Petrovsky V. N. – the client and the consultant reviewed the case analysis. This work was supported by the Competitiveness Program of NRNU “MEPhI”.
References
1. Ananieva A.G., Artamonov A.A., Galin I.U., Tretyakov E.S., Kshnyakov D.O. Algoritmizatiom of search operations in multiagent information-analytical systems. Journal of Theoretical and Applied Information Technology. 2015. vol. 81. no. 1. pp. 11-17.
2. Artamonov A.A., Leonov D.V., Nikolaev V.S., Onykiy B.N., Pronicheva L.V., Sokolina K.A., Ushmarov I.A. Visualization of semantic relations in multi-agent systems. Scientific Visualization. 2014. Vol. 6. No. 3. pp 68-76.
3. Abstract database Web of Science URL: https://webofknowledge.com/ (Date of access: 27.06.2016)
4. Abstract database Scopus URL: https://www.scopus.com/ (Date of access: 27.06.2016)
5. Patent database Espacenet URL: https://worldwide.espacenet.com/ (Date of access: 27.06.2016)
6. Materials of Laser Focus World company URL: www.laserfocusworld.com/ (Date of access: 27.06.2016)
7. Library for the Python programming language for data visualization URL: http://matplotlib.org/ (Date of access: 27.06.2016)
8. High-level programming language General purpose URL: https://www.python.org/ (Date of access: 27.06.2016)
9. Software for data visualization URL: http://www.highcharts.com/ (Date of access: 27.06.2016)
10. JavaScript library focused on interaction between JavaScript and HTML URL: https://jquery.com/ (Date of access: 27.06.2016)
11. Software Adobe for imaging information URL: http://www.adobe.com/ (Date of access: 27.06.2016)