VISUALISATION OF DISPLACEMENT AND DEFORMATION BY DIGITAL IMAGE CORRELATION METHOD
A.V. Osintsev, K.Yu. Ochkov.
National Research Nuclear University MEPhI (Moscow Engineering Physics Institute)
AVOsintsev@mephi.ru, Konstantinochkov@gmail.com .
Contents
2.1. Bending of a cantilever beam
2.2. Compression test of hip joint prosthesis
Abstract
In this work, we describe digital image correlation method: basics of the method, advantages over other optical methods and a field of application. Tests were conducted by bending of cantilever and pressure of hip prosthetic. The results of bending of cantilever obtained by the digital image correlation method are compared with the measurements obtained with a micrometer. By results of the hip prosthetic test we can judge about strain field distribution and we can evaluate the most deformed area. The results of experiments were processed by VIC-SNAP and VIC-3D. A field of displacement and field of deformation are presented at digital format. The system of digital image correlation provides a full picture of the distribution of strains in a sample. That allows receiving more data based on the results of standardized experiments (tension, pressure) without resorting to numerical calculations by the finite element method.
Keywords: VIC-3D, displacement, deformation, data visualisation.
1. Introduction
In modern practice high information optical methods that allow registering displacement and deformation fields on all visible body surface under study are wide-spread. The moire-fringe method and coherent optics methods, namely, holographic interferometry and correlation speckle interferometry, belong to a group of the most well known of them [1].
Recently, a relatively new method of experimental mechanics, i.e. the digital images correlation method, has been developed and put into engineering practice at a face pace [2,3]. Researchers uphold theses on the technology use in different fields [4,5]. Along with the above-mentioned ones, this method is aimed at analyzing a deformed state of an object in a continual 2D or 3D format [6]. Sometimes, it can also be used as an optical inspect extensometer. This method helps to monitor displacements of the same physical points on the body surface before and after deformation. This phenomenon can be detected owing to the displacements of system elements chaotically distributed on the body surface and small-sized speckles inseparably connected with it (so called speckle structure). Modern measuring systems allow analyzing both body's responses to static loadings and high-rate processes when dynamic body shape changes are studied by means of high-speed digital cameras (Fig.1).
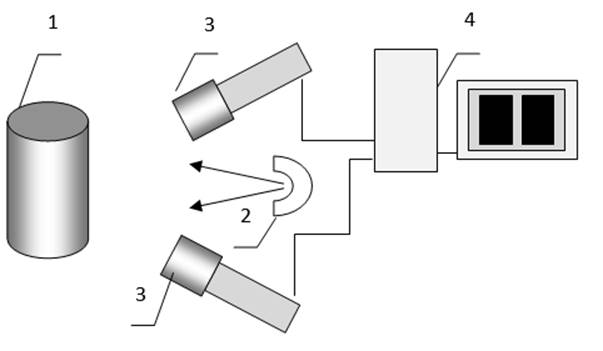
Fig. 1. Schematic diagram of the apparatus for measuring the tangential movements by digital image correlation (in 3D). 1 - object; 2 - Illuminator; 3 - digital video camera; 4 - PC
The procedure for the implementation of the method includes the basic steps:
· preparation of the object;
· setting, guidance and focus cameras on an object;
· calibration of cameras;
· implementation of testing and registration of images;
· image correlation;
· data processing;
Random marks population on deformable object surface patches statistical pair wise processing of varied space distribution represents the basis of digital image correlation method. It's the cause of fact that pretraining essentially consists in metrological information carrier’s data presence support. Speckle structure can be deposited artificially. It can be done within optical means or using dye dispersion. Also it can have native origin.
Minimum two images of test object surface containing speckle structure (native or deposited) are needed for dislocation fields analysis. As a rule, one of these images is recorded in case of zero loading and the other in case of specified loading. Besides, stereo system including two digital video cameras is required for dislocation fields deformations research in three-dimensional space.
In order to calculate the displacement of a random point ?,
a square subdomain ![]() the
size of
the
size of ![]() pixels, centered at a given point, is selected of the digital image of an
object. Within selected area, the distribution of image intensity is described
by random function
pixels, centered at a given point, is selected of the digital image of an
object. Within selected area, the distribution of image intensity is described
by random function![]() . When
considering the image with discrete of 1 pixel, the coordinates
. When
considering the image with discrete of 1 pixel, the coordinates ![]() and
and ![]() acquire
integer values from
acquire
integer values from ![]() to
to ![]() .
.
Let![]() be a
random point of given subdomain. After object deformation it is shifted on
transformed image to a point
be a
random point of given subdomain. After object deformation it is shifted on
transformed image to a point ![]() .
Thus, considering the continuity of displacement field, one can write:
.
Thus, considering the continuity of displacement field, one can write:
![]() (1)
(1)
Increments ![]() and
and ![]() can
be represented by their expansion in a two-dimensional Taylor series with
retention required the number of members.
can
be represented by their expansion in a two-dimensional Taylor series with
retention required the number of members.
According to the simplest approach, it is assumed that the
displacement u and v are different points within a small subdomain can be taken
almost constant (in the speckle structure). In this case, the value of ![]() and
and ![]() and
will have only a zero order, that is
and
will have only a zero order, that is
![]() (2)
(2)
In other words, the entire subdomain ![]() shifts
on a single vector
shifts
on a single vector ![]() , to
be measured. Of course, various selected image subdomain on the body surface
displaced in the general case, various vectors.
, to
be measured. Of course, various selected image subdomain on the body surface
displaced in the general case, various vectors.
Determination of the displacement vector based on the
procedure. The image of the deformed object sought subdomain ![]() , in
which the corresponding spatial intensity distribution
, in
which the corresponding spatial intensity distribution ![]() as
much as possible like the original
as
much as possible like the original ![]() . In a
first approximation, the size and shape corresponding to the same subdomains
rely. The search process is a sequence (from pixel to pixel) changes in
position of the center subdomain comparisons
. In a
first approximation, the size and shape corresponding to the same subdomains
rely. The search process is a sequence (from pixel to pixel) changes in
position of the center subdomain comparisons ![]() within
a search area Ω in the transformed image for each of the coordinates and
the establishment of the its provisions, in which there is the maximum degree
of similarity (Fig.2.).
within
a search area Ω in the transformed image for each of the coordinates and
the establishment of the its provisions, in which there is the maximum degree
of similarity (Fig.2.).
With a view to scaling characteristics can be used a variety of criteria, which essentially boils down to two groups: the criteria of maximum correlation of random functions and criteria of the minimum deviation (discrete intensity values):
![]() (3)
(3)
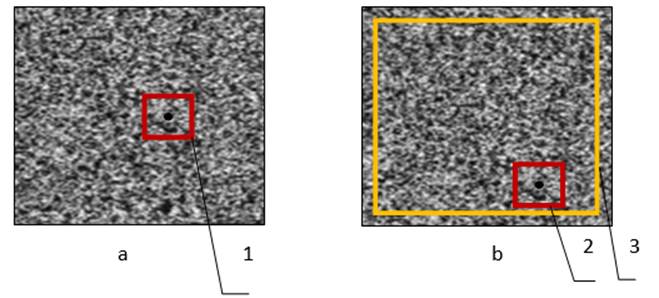
Fig. 2. Displacement of a speckle pattern on an object
during deformation, ? – surface before deformation; b – surface after
deformation; 1 – subarea ![]() ; 2 –
subarea
; 2 –
subarea![]() ; 3 –
search area Ω
; 3 –
search area Ω
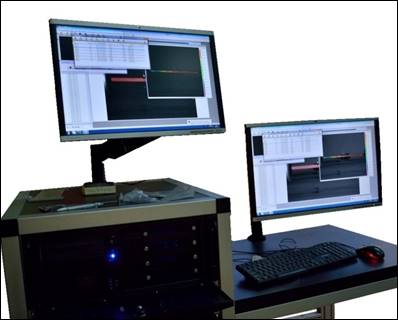
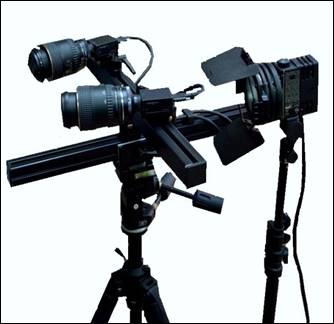
Fig. 3. PC software and a system of two cameras.
2. Results
2.1. Bending of a cantilever beam
Experiment of bending cantilever beam is easy to carry out and at the same time is very clear: it allows to evaluate the magnitude of the deflection and to identify the places with the biggest deformation.
On cantilever beam dial indicator was set with which displacement was fixed. In parallel with him the displacement was measured using a VIC-3D camera system installation. In the course of the study sample movement has been set. Movement was recorder with the dial indicator. Every 50 microns shooting was carried out.
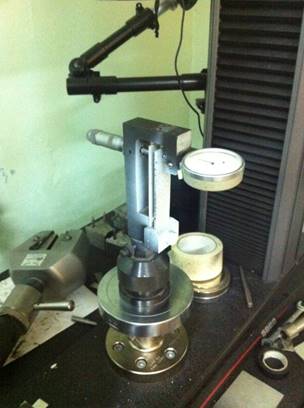
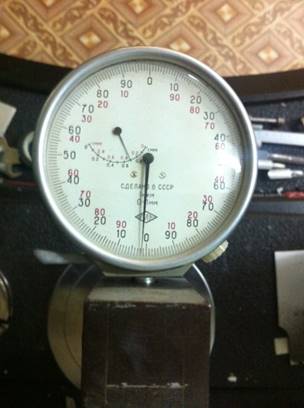
Fig. 4. Cantilever beam and dial indicator
Picture of fields displacement completely corresponds to the expected results. The biggest movement (red colour) are of the order of 0.204 mm, which coincides with the given values.
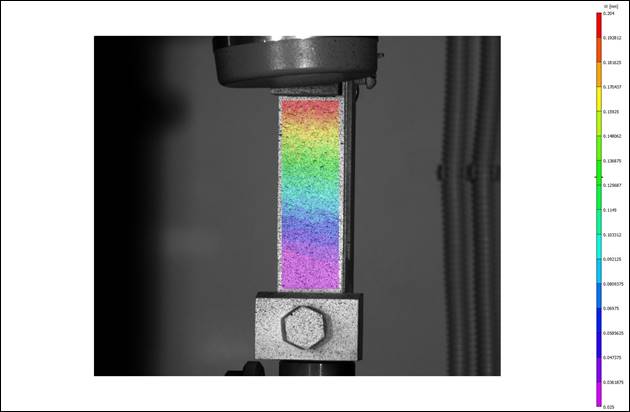
Fig. 5. Displacement visualization
Table 1
|
Loading step |
Dial indicator |
Dial indicator adjusted for the length of the visually accessible beam |
Indications of VIC-3D system |
Accuracy of VIC-3D system |
|
1 |
50 μm |
43,75 μm |
44,63 ??? |
2% |
|
2 |
100 μm |
87,5 μm |
84,03 ??? |
4% |
|
3 |
150 μm |
131,25 μm |
127,31 ??? |
3% |
|
4 |
200 μm |
175 μm |
171,53 ??? |
2% |
|
5 |
250 μm |
218,75 μm |
212,19 ??? |
3% |
In the picture strain fields (Fig. 6) it is noticeable that there is condensation at the bottom of the sample. However, this is explained by the fact that in the part the sample was pre-sawed, thereby cross-sectional area of this portion is smaller than the rest of the sample. As a result, the picture turned out this strain fields
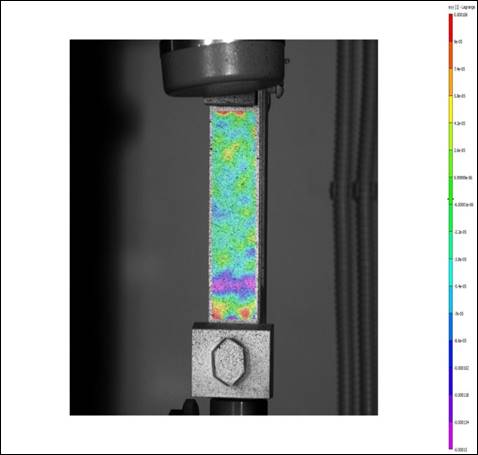
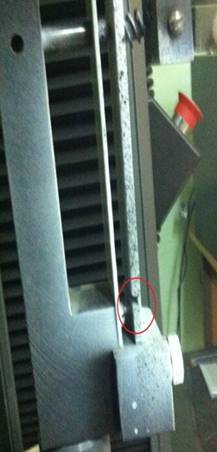
Fig. 6. Deformation in the longitudinal direction
2.2. Compression test of hip joint prosthesis
Within the framework of my work I invesigated the behavior of the hip joint prosthesis. The sample was tested for compression, whereby the system enables VIC-3D show the variation in the field of deformations in the longitudinal direction over time (Fig.7 animation). As can be seen from the annimation, the inner surface undergoes compression (purple colour), external - stretching (red colour).
Fig. 7. Longitudinally deformation.
3. Conclusion
My work describes a method of digital image correlation and some of investigated issues have been studied as well. This method allows to visualize the field of displacements and deformations in the solution of the problem of determining the stress-strain state. These results are highly accurate and have simplicity of presentation. Further processing can be carried out in the mathematical packages.
References
1. Razumovskiy I.A. Interferentsionno-opticheskie metody mehaniki deformiruemogo tverdogo tela [Interference-optical methods of solid mechanics]. ?.: Pub. MGTU. 2007. 240 p. [in Russian]
2. Sutton M.A., Orteu J., Schreier H.W. Image correlation for shape, motion and deformation measurements: basic concepts, theory and applications. Springer. 2009.
3. Pan B., Qian K., Xie Y., Asundi A. Two-dimensional digital image correlation for in-plane displacement and strain measurement: a review. Measurement Science and Technology – 2009. – V.20. – P. 1-17.
4. Apalkov A. A. Issledovanie ostatochnyih napryazheniy v elementah konstruktsiy YaEU metodom sverleniya otverstiy i tsifrovoy spekl interferometrii [Study of residual stresses in structural elements NPP by drilling holes and digital speckle interferometry]: Dissertation of engineering sciences: 05.14.03: ?., 2005 173 p., 61:05-5/3091 [in Russian]
5. Poroykov A.Yu. Metod korrelyatsii fonovyih izobrazheniy dlya analiza smescheniy krupnomasshtabnyih poverhnostey [Correlation Method of background images for the analysis of large-scale displacement surfaces]: Dissertation of engineering sciences: ?., 2012 146 p. [in Russian]
6. Tretiakova T.V., Vildeman V.E. Relay-race deformation mechanism during uniaxial tension of cylindrical samples of carbon steel: using digital image correlation technique. Fracture and Structural Integrity. – 2013. – No. 24. – P. 1–6. Doi: 10.3221/IGF-ESIS.24.01.