MODEL AND TOOLS FOR INTERACTIVE ANALYSIS OF DYNAMICS AND RELATIONS OF SCIENTIFIC INFORMATION PUBLICATIONS FLOWS
E.S. Gorbun, N.V. Maksimov, K.V. Monankov, Sh.U. Nizametdinov
National Research Nuclear University MEPhI (Moscow Engineering Physics Institute), Moscow, Russian Federation
Contents
2. Technologies of forming character descriptions and search time series dependencies
3. The methods of smoothing time series
4. Practical implementation of methods of analysis
6. Research example of connection between these concepts in time
Abstract
This article describes the approaches and methods for the research of the interrelation of subject areas, the development dynamics of which is represented by time series of the scientific publications flows. The method is based on representing the time series in descriptive form, which allows to transform the statistical task to the task of character sequences seek. It presents interactive visual-analytical means for handling the document samples that are used to form the analyzed spaces of documents that reflect the dynamics of individual areas and aspects.
Keywords: information retrieval, time series, small samples, approximation, Irwin’s method, median filter method.
1. Introduction. On some features of the representation of dynamics of scientific directions and search of dependencies.
Methods for analyzing the dynamics of publication activity are versatily and deeply worked in scientometrics and bibliometrics. At the same time, science is interested in identification of existing or potential dependency of directions due to lifecycle stages interconnections, using studies and methods of other areas, arising availability of resources, technology transfer, etc.
An example of research of scientific aspects and terms relationship according to the theme "Investigation of thorium in nuclear power industry" is given from [1]. Three aspects were identified within the theme - PHYSICS, MATHEMATICAL MODELING and EXPERIMENT - and search requests were formed for each of them. Upon request, an iterative retrieval was conducted in a retrospective reference-bibliographic database INIS (IAEA), and a time series publication activity for each of the aspects have been built (Fig. 1).
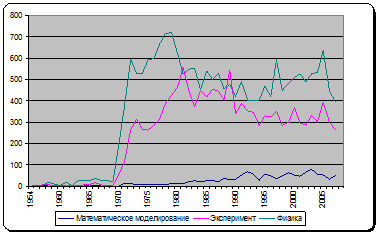
Fig. 1. Time series of aspects of the publication activity.
Features of directions development, characterized by series, shown in Fig. 1, are explained with the following factors:
- Interest in the introduction of thorium in nuclear energetics always arises with predicting of the rapid growth of the number of nuclear power plants in the world and a possible shortage of natural uranium for nuclear fuel (1970s and 2000s). This is reflected most clearly by the dynamics of publishing PHYSICS aspect;
- Aspect EXPERIMENT has a splash in the 1970s, but does not have it in the 2000s (as in the case of PHYSICS aspect) due to the fact that the nuclear data on thorium had already been well studied by this time;
- a splash in the late 1970s - early 1980s (aspects EXPERIMENT and MATHEMATICAL MODELING) is associated with the appearance of computers and the widespread growth of interest in the mathematical modeling of physical processes using special programs.
Related to the single concept TRANSMUTATION time series of publications were constructed for each of the aspects and are shown in Fig. 2.
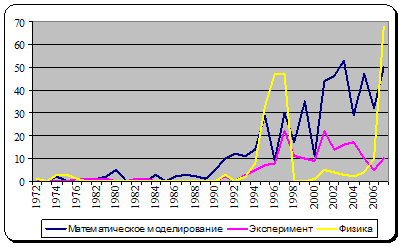
Fig.2. The distribution of publications for term TRANSMUTATION by aspects
The dynamics of the time series indicates that the intensive research of the physical phenomena of transmutation in 1990s affected the dynamics experiments. In the 2000s the development of these aspects occurs with a delay of about a year in comparison with the dynamics, reflected by the term TRANSMUTATION. This is due to the fact that with the rapid research of the phenomenon of transmutation had some time to create new equipment and to prepare for the experiment. That is, the theoretical knowledge influenced the appearance of the practical results with the time shift.
This example illustrates an important feature that should be considered to identify the dependency of directions: the relationship is defined by fragments of series that are not synchronous in time and have different amplitude-frequency response. In other words, the relationship is more event-character, the amplitude and interval fragments, corresponding to related events, may not be comparable in magnitude.
Another peculiarity is that the period of development of scientific fields is quite short and, in addition, characterized by interdisciplinary science. That is, in the analysis we have to deal with small sets and with plenty of time series. As a consequence, the application of well-established traditional methods of mathematical statistics [2] is almost impossible, even though some of them take into account this specificity to a greater or lesser extent, in particular, the wavelet analysis and granular computing. However, the algorithm of the wavelet analysis [3] is computationally time-consuming and granular computing [4] allows to combine objects into granules based on their indistinguishability, equivalence, similarities and proximity, although the union of the objects in the group is ambiguous and difficult process, that requires knowledge of a particular subject area. But most importantly, both, wavelet analysis and granular computing are not focused on the identification of the relationship between the time series.
Another problem is the construction of the time series for a single direction: the direction of science often has no clear boundaries, there are no unified formal methods of identification belonging to the direction of the publications that have an interdisciplinary character. Moreover, the most interesting cases are those in which dependence has not became a fact yet, it is just in a process of forming. These relationships fundamentally cannot be determined by formal methods, but they become evident to the expert who can relatively easy detect dependencies while visualization of distributions, reflecting the dynamics of the aggregate trends by estimating the similarity / difference and logic areas. These distributions can be not only time-series publications, but also, for example, the distribution of subjects and types of documents, distribution of publications of various authors and organizations. Distributions can be either two-dimensional or multidimensional ones. The most convenient for the analysis are two-dimensional and pseudo three-dimensional representations. For example, in three-dimensional representation, in addition to the usual coordinate axes, color differentiation values are used. The distribution of number of documents published in different years by authors having different degrees could be considered as an example of a pseudo three-dimensional representation of search results.
This article proposes a method of finding the relationship between the various scientific fields on the basis of representation in the form of series of symbol sequences, reflecting their "behavioral" characteristics that allow the use of the classical mechanisms documentary descriptive search "by entering".
The article also provides interactive visual-analytical tools to manipulate samples of documents used for the formation of the analyzed spaces, reflecting the dynamics of individual areas and aspects.
2. Technologies of forming character descriptions and search time series dependencies
Taking into account the "event" nature of the correlation directions for the forming of a descriptive representation of the time series in the form of the character sequence we will use the characteristic properties (features) the dynamics of trends of the analyzed subject area. These properties are:
the monotonicity, which means the stability of growth or decay of specific scientific areas;
the periodicity, which appears in the long term period and may be the result of technical reasons (for example, publication of great collectors of articles from conferences, which are held with the same period);
the saw-imagery, which means that the scientific area is constantly significantly changing, or that the flow of information on individual time periods is not complete.
Time series could have zero sections whose origin may be a consequence of the above mentioned reasons.
Thus, a specific number of publications reflect not only the development of actual directions, but also the effect of different factors of technical, organizational and other kind which is not generally possible to precisely identify and exclude from consideration. In addition, if the development of science in general (and on an extended period of time) is characterized by a steady patterns and quantitative indicators, the dynamics of publications of a certain direction is practically unpredictable. This is determined not only by spontaneity, that is natural for cognitive process, but also the above-mentioned conventionalities of attributing publications to specific direction and of the fact of occurrence of it in a particular time and in a particular form.
In order to reduce the influence of such factors in the allocation patterns, there are necessary methods of consolidation and normalization (smoothing).
For the formation of character descriptions, allowing to limit the search to the case of regular expressions, the basic characteristics of the series are explored, the series is smoothed, depending on its characteristics, and then a character sequence, each character of which reflects the type of development (leap, uniformity, etc.) is formed. Every type of plot is encoded by a appropriate symbol:
"0" – the plot with the constant condition;
"+" - the plot with increase;
"−" - the plot with decrease;
"/"- the plot with strong (anomalous) increase;
"\"- the plot with strong (anomalous) descending order.
Thus, the search for "correlating" (partially similar) time series will not be in the parameters and the statistical properties of the time series, it will be carried out according to their character descriptions, which reduces the problem to a symbolic search. The search can be conducted with additional settings, for example, adjusting the overlap of the edges manually during editing the regular expression or using search masking operators with exact or acceptable distances between characteristic fragments correlated series.
3. The methods of smoothing time series
As mentioned previously, there is no adequate statistical processing methods for purposes of analysis and search of time series, built on small or non- stationary samples. Moreover, the technological features of their formation determine the inaccuracy and the incompleteness of mapping the analyzed situation in the subject area (SA). Therefore, based on the matching principle we adopt a strategy of application of the most appropriate mathematical methods under the assumption that the necessary determining information about SA will be provided by the expert. Using visual operating environment and basing on implicit knowledge (personal knowledge about SA that are not represented in the database explicitly) the expert in interactive mode can not only create a really meaningful sample of the documents, but also highlight built in system character description really defining the areas, change the character of the other plots (if he knows the relevant facts), choose the degree of generalization and the features of correlation, etc.
The analysis of the mathematical instruments of smoothing methods showed that for the case under consideration Irwin's method [5] and the method of median filter [6] are the most preferred, because they are independent on time constraints, are sensitive to sudden emissions and allow changes of parameters to take into account the characteristics of the series. Irwin's method allows to diagnose anomalous emissions and to smooth out anomalous outliers. Method of median filter well suppresses the impulse noise and decreases in this case the number of anomalous emissions. For series with zero points and periodic dynamics combined method of smoothing was developed.
Smoothing of time series is carried out depending on their
dynamic properties, determined on the basis of coefficient of variation ![]() allowing
to identify areas of anomaly. The value of
allowing
to identify areas of anomaly. The value of ![]() is calculated for all
points in the time series [5].
is calculated for all
points in the time series [5].
The smoothing is performed according to the following rules:
· sections without peaks (anomalies) are smoothed by the method of median filter;
· the series with an intense sawtooth dynamics and with a large number of bursts are smoothed by Irwin method, which will flatten the abnormal areas of increase and decrease, due to small samples, the monotonous same sections will remain unchanged;
· the series with zero values, the causes of which may be technical, smoothed by a method that evenly distributes publications on zero plots so that the sum of all publications of the series remains unchanged;
· after checking on the periodicity the series with intense dynamics are smoothed by the combined method, and the series with low-level dynamics are smoothed by the method of median filter.
To control the degree of generalization (coarsening may be useful for visual analysis, when the expert can subjectively to neutralize the influence of various factors), one should enter a smoothing coefficient that determines high, medium and low degree of generalization.
For monotone plots without splash for which the value of the coefficient of variation is less than the table value [5], the smoothing is carried out by replacing the values of the points of the time series by the average value of the neighboring points of a time series rounded to the nearest whole number. This allows focusing on a number of areas with intense dynamics.
Using the method of Irwin point values of the time series, for which the value of the coefficient of variation is more than the table value, are replaced by the average of a number of neighboring points taking into account smoothing factor.
Using the method of median filter [6] original values of each points of the time series are replaced with the median value of neighboring points.
In the case where the zero plots appear periodically, smoothing zero plots made based on the length of the zero interval. In the case where there is no periodicity (it is difficult to determine the causes of zero plots), zero plots should be smoothed so that the publications should be distributed across zero plots so that the sum total of a number of publications remains unchanged.
Smoothing by the combined method is performed by comparing three series (original, smoothed by Irwin`s method and smoothed by the method of the median filter). Point of series for which both the estimated values are more or less than the original, is assigned by a value that is closer to the original. Otherwise (the value of the original is in the range between estimated values) – point is assigned the average of three values with the smoothing coefficient.
An example of smoothing time series with character description «+++---+++-+++--/-0+++++--++-+-+--+-000+-+-+++-+++--» is shown in Fig. 3
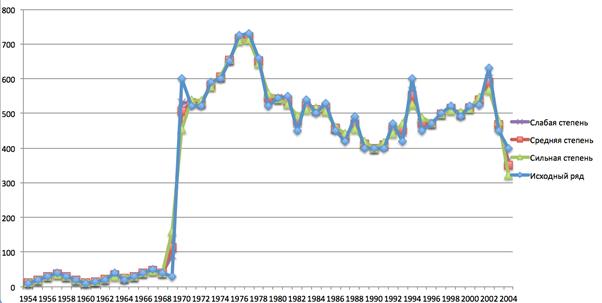
Fig. 3. Example of smoothed time series
The relative error of approximation (smoothing) [7] is used to assess the accuracy of smoothing:
For the example presented in fig. 3, the relative error has the following values respectively for different extents of smoothing
![]()
4. Practical implementation of methods of analysis
Methods for interactive analysis of the dynamics and relations of documentary flows (as a software component having a specialized visual forms) have been implemented as a part of the documentary information analytical system xIRBIS [8], which has developed search engines and interface controls for the interaction of the user with the information space. System's basic functionality and visual solutions organization of space and management processes of information retrieval are presented in [9].
Procedurally analysis module receives data by filtering and granulation elements records - documents, selected as a result of searches in databases. However, it should be noted that the results of analysis not only visualize the distribution, but they are search tool. Firstly, from the point of documents distribution we can go to them (documents) to continue to use the method search analogues. Secondly, for the selected time series we can search time series (and, accordingly, documents), the dynamics of which is correlated with the selected, which provides new opportunities not only for the research of the subject area, but also to identify search trends.
5. Data management
The space of documents for dependency analysis can be formed in various ways. Usually analyzed sets of documents - results of search in the database for thematic queries, grouped and identified (referred to) by the user either at entry sample into analyzing space (hereinafter referred to by analogy with OLAP-technology - hypercube), either directly during analysis using selection operations and forming the slice. A slice is a subset hypercube obtained by fixing the values of one or more document attributes (dimension hypercube). Thus, user creates a personal space of documents to form distributions and search similar time series.
We next consider some of the functions of visual analytical component on the example of the theme "Investigation of thorium in nuclear power" in aspect of MATHEMATICAL MODELING. In the database INIS running IR system xIrbis [8] we formed publications flows using a query:
((NEUTRON* and REACTOR*CORES* and REACTOR*) and ((PROGRAM* or BENCH*) and REACTOR*) or ((NEUTRON*FLUX* or FLUX*DENSITY* or NEUTRON*TRANSPORT* or CROSS*SECTIONS*) and (calculation* or MATHEMATICAL*MODELS or uncertainty*data*values)))
search results are placed in the search protocol (Fig. 4).
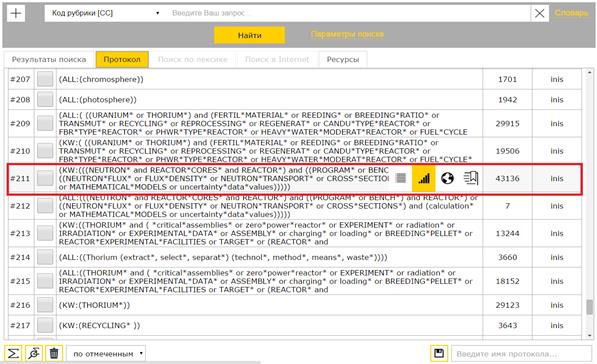
Fig. 4. Protocol of search in retrieval system Irbis
Use icon "Statistics", then go to the functions of the visual analytical component (highlighted in Fig. 4). The current search results form a new hypercube – a new subset of the named space (Fig. 5a), or a subset can be added to the existing hypercube (Fig. 5b).
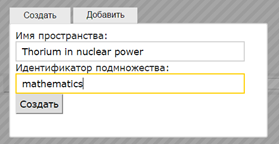
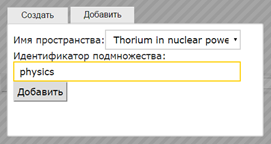
Fig. 5. Union and identification of analyzed subsets
In this way, you might create a few samples (subsets) on various aspects and subject areas for further study of their behavior and establishing relationships. For details or generalization you can use the sampling operation and the formation of slice, and then add those obtained and named subset of documents in the hypercube analyzed subject area.
We create the space of documents by theme and identify subsets of reflecting different aspects - PHYSICS, MATHEMATICAL MODELING and EXPERIMENT. Now we can form a time series of flows of publications of these aspects (see. Fig. 6).
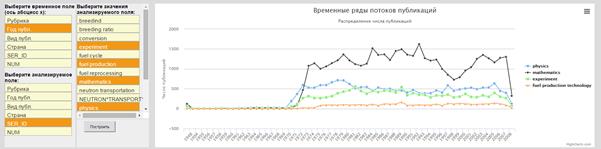
Fig. 6. Time series of aspects by theme "Investigation of thorium in nuclear energy"
For example, using visual tools for interactive analysis we can select documents by year (Fig. 7). Moreover, you might form a slice of the hypercube by fixing one or more attributes, for example, to build the distribution by type of publication to aspects of MATHEMATICAL MODELING (Fig. 8).
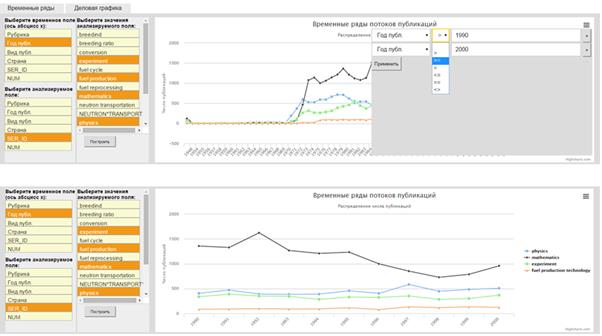
Fig. 7. An example of the operation sample documents by year
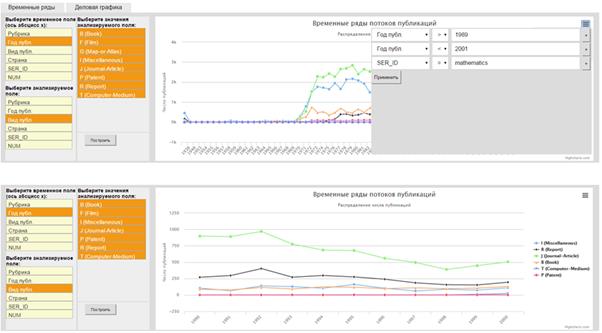
Fig. 8. An example of the operation of forming slice
For now, we can build analytic distribution or search correlating series. Furthermore, the graphic interface allows moving from one point to the documents according to this point, which gives us an opportunity to extend the search process using the functions associated with the form of document scanning. (Fig. 9).
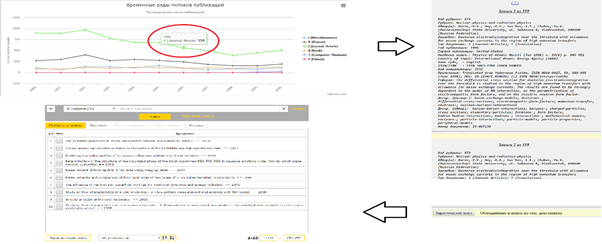
Fig. 9. Activate document viewer and the search from visual statistics
The advantage of this approach is that data management operates interactively by visual tools, without using the compilation of retrieval requests in cooperation with graphical representations.
6. Research example of connection between these concepts in time
Consider publication dynamics of concepts on the theme "The research of sunspots". We searched in the reference-bibliographic database INIS for key words in scientific publications on this subject (total 10 key words) and union the results in a hypercube. Time series of flows of publications containing these terms are constructed and shown in Fig. 10.
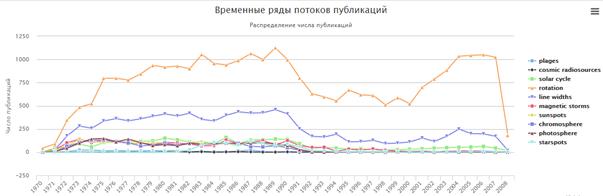
Fig. 10. Time series of flows of publications on the theme "The research of sunspots"
Sequentially for each of the key words character descriptions should be built using function forming of character description, and search similar time series using regular expressions.
For example, for time series of the term «sunspots» was built next character description "++/--+--+--++---+--+-----0+--+-+-++---"and then was search of similar series, the result of which is shown in Fig. 11.
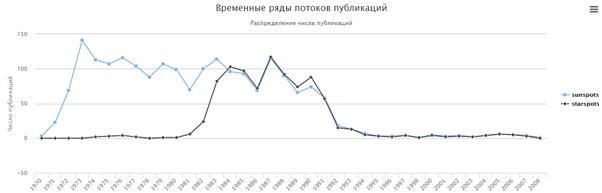
Fig. 11. The result of searching similar time series for term «sunspots»
The distribution shows that in 70-80 years there was a steady interest in the term «sunspots», the term «starspots» was intensively used only in the 80s, and after 1984 the terms «sunspots» and «starspots» developed almost simultaneously. The context changed since the most distant than the Sun stars has been researched. The context of “sunspots” transformed to the context of “starspots”. In other words, in scientific fields studying sunspots, were more likely to identify the sun with other stars expanded the domain of the space of the solar system to the starry space.
The constructed time series for the terms «chromosphere», «photosphere» and «solar cycle» are shown in Fig. 12.
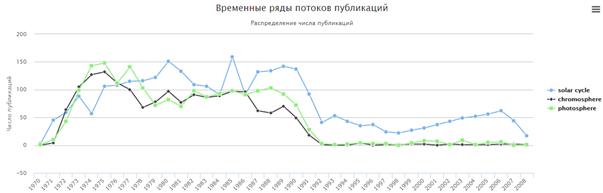
Fig. 12. The results of search similar time series for term «solar cycle»
The terms «chromosphere» and «photosphere» have very similar dynamics, certain differences presumably determined by which scientific observations it easier to produce. There is a causal relationship dynamics terms «chromosphere», «photosphere» and «solar cycle». That is increasing interest in the study of the chromosphere and photosphere led to an increase in knowledge about the solar cycle, which took place with some delay.
7. Conclusion
This research developed the mathematical apparatus of analysis of the dynamics and relationships flows of publications. The mathematical apparatus provides reduction of the time series to the descriptive form that allows one to search similar time series that are not the parameters and properties of time series, but in a sense of their character descriptions. That is the problem of finding time series overlaps with possible shifts in time that are reduced to the classical methods of documentary descriptor search. Search can be carried out with additional settings, such as "established" boundaries or areas for manual editing of the regular expression using search operators masking with exact or allowable distance between the characteristic fragments of correlated series.
Presented examples in the article illustrate the application of methods for the analysis of the publication activity in the scientific field. Of course, the developed methods and tools can be used for analysis any of time series and for analyzing the arbitrary relations when the linkage of distributions may indicate the presence of a root cause of the synchronous behavior of processes in subject area.
Visual interactive interface allows one not only documents viewing, but also to analyze a groups of documents, the relationship between the groups. With the help of interface elements user can substantively select a part of the search results, which he is interested in, for example, by fixing the values of individual attributes, which reduces the dimension of the analyzed space without losing important information for user.
Thus, interactive human-machine procedures in which inaccuracy of mathematical methods (owing to formal inadequacy of their application) is compensated by alternativeness of the selections and representations prepared by system for the expert analysis which in total provided by visual means of a manipulation and management of procedures of their comparison according to the search, that provides overall effectiveness of the analysis.
Reference list
1. Golitsyna O.L., Maksimov N.V., Stroganov V.I., Tikhomirov G.V. Sistemy upravlenija znanijami i sreda informacionnoj podderzhki nauchno-issledovatel'skih i obrazovatel'nyh processov [Knowledge management systems the environment of information support of scientific research and educational processes]. Management systems and information technologies, № 1.1 (43), 2011, pp. 126-134.
2. Walter Enders. Applied econometric time series. - Wiley University of Alabam. DOI: 978-0470-50539-7.
3. T. Subba Rao, S. Subba Rao, C. R. Rao. Handbook of Statistics: Time Series Analysis: Methods and Applications. -Elsevier B. V. 2012, 978-0-444-53858-1.
4. Tarasov V.B., Kaluskaya A.P., Svyatkina M.N. Granuljarnye, nechetkie i lingvisticheskie ontologii dlja obespechenija vzaimoponimanija mezhdu kognitivnymi agentami [Granular, and fuzzy linguistic ontology in order to achieve understanding between cognitive agents]. Moscow: BMSTU, 2012, 278 p.
5. Fedoseyev V.V., Garmash A.N., Dayitbegov D.M., Orlova I.V. Polovnikov V.A. Jekonomiko-matematicheskie metody i prikladnye modeli: Ucheb. posobie dlja vuzov [Economic-mathematical methods and applied models: Educational textbook for Universities] / Under the edition of Vladimir Fedoseyev. Moscow: UNITY, 1999, 392 p.
6. Huang T.S., Eklundh J.-O., T. C. Huang, V. I. Justusson, H. J. Nussbaumer, S. G. Tyan, Zohar S. Two-Dimensional Digital Signal Processing II. Transforms and Median Filters. Berlin-Heidelberg: Springer, 1981. DOI: 10.1007/BFb0057592
7. Karmanov V.S., Time series analysis. Novosibirsk, 2007, 28 p.
8. Maksimov N.V. Dokumental'naja informacionno-analiticheskaja sistema xIRBIS: Programma dlja JeVM [Documentary information-analytical system xIRBIS: Software]. / Golitsyna O.L., Maksimov N.V., Okropishin A.E., etc. // The state registration сertificate of computer programs No. 2014619640 from 17.09.2014.
9. Maksimov N.V., Golitsyna O.L., Usenko A.L. The structure and components of the operational visual space for scientific interactive information retrieval. Scientific visualization, 2014, no. 4, vol. 6, pp. 96 – 106.