VISUAL REPRESENTATION OF FILE CONTENT DURING FORENSIC ANALYSIS TO DETECT FILES WITH PSEUDORANDOM DATA
Matveeva V.S., Epishkina A.V.
National Research Nuclear University «MEPhI»
vesta.matveeva@gmail.com, avepishkina@mephi.ru
2. Prerequisites for creating a new method
3. The Evaluation of the Statistical Properties of a File
4. Visualization of file contents
5. Software implementation of the results
Abstract
Searching for pseudorandom data is an important stage during forensic analysis. Existing approaches are based on verifying statistical properties of file contents by means of test suites for estimation of pseudorandom sequences. Some approaches are not adapted for work with file system and are time/resource consuming. The others have significant type I or II errors. That is why authors have conducted a research in this field and suggest an approach to estimate statistical properties of file contents by means of their visual representation. The approach was used for development of program for searching pseudorandom data. Its testing shows that type I error is reduced to zero and type II error for popular file formats is less than 1%.
Keywords: Pseudorandom data, encrypted data, density of distribution, compressed file formats, wavelet analysis.
1. Introduction
Forensic expertise contains some important steps one of which is searching for pseudorandom data that is conducted for the following tasks:
- detection of encrypted data as a sign of hiding information. During the search malicious encrypted modules, that are hidden in the file system, can be revealed;
- detection of files or areas in the file system that are filled by pseudorandom numbers as a sign of permanent data deletion;
- detection of hidden encrypted areas and file systems as a sign of malware activity or data concealment.
If files with pseudorandom data are hidden in system catalogues, deliberately changed, removed or imitate ordinary files their detection is impossible during usual search by an expert. We need automated search that is based on statistical properties assessment because special test suites for estimation properties of random sequences are created. Examples of test suites that can be used for the task are: NIST [1], DIEHARD [2], Knuth’s tests [3], TestU01 [4], AIS31 Methodology [5]. Other approaches have significant errors in detection of pseudorandom data or are used to assess particular properties of pseudorandom data.
Statistical test suites are not adapted for searching in file system and don’t use features of file formats but can be used for testing individual files as an array of bits or bytes. Their use for the analysis of all the files in the file system is resource- and time-consuming because to minimize errors in detection it is better to use all tests from the suite many of which are based on complex multiple checks with different parameters, therefore the number of controls for one file is increased. After tests one receives results for every test as an integral value that don’t reveal local heterogeneities in assessed distribution that is why it is difficult to interpret them. Estimation of output data is conducted by means of integral characteristic, that doesn’t show the presence or absence of local deviations in byte distribution of file contents.
As for existing automated means of encrypted file search, one has been using the «Passware Forensic Kit» software [6], the modules of which are embedded in forensic tools: Belkasoft Evidence Center [7], EnCase Forensic [8], Oxygen Forensic Kit + Passware Edition [9]. The tools use some statistical tests for pseudorandom sequences and signatures for well-known file formats. In the course of testing the module of encrypted file search it has been revealed a limit on the minimum size for files with no header (> 273 KB) and significant errors in detection of files with pseudorandom data.
Based on this authors suggest a method of visual representation of file contents that can help to assess byte distribution for searching deviations from the distribution that is typical for pseudorandom sequence.
2. Prerequisites for creating a new method
Results of testing [10, 11] have shown that the entropy values for compressed file formats pdf, docx, rar, zip, wmv, jpg, png, mpg, etc. intersect with the values for encrypted files that is why these formats are the main “competitors” of desired files.
According to the definitions in NIST [1] pseudorandom data is defined as having a uniform and independent distribution of the data elements. Test suites mentioned in Introduction aim to verify these properties.
Encryption algorithms, that are used by modern encryption software and by malicious programs, have the following properties:
- good mixing of input data, i.e. when an input is changed slightly (for example, flipping a single bit) the output changes significantly. Full mixing is achieved if every variable of used conversion function is essential. In terms of encryption algorithms change of one symbol of input sequence of open text influences on every output symbol of encrypted text. Such dependence is checked by strict avalanche criterion satisfied by all encryption algorithms that are used by encryption software;
- using combination of substitution and permutation ciphers in realization of encryption algorithms;
- properties of output data satisfy uniformity and independence in distribution of data elements.
Thus statistical properties of input data don’t influence on statistical properties of data encrypted by mentioned algorithms.
No restrictions are imposed on the statistical properties of the compressed data. The main aim of the compression operation is to reduce the size of the compressed data and to provide the ability to recover the original data from the compressed data with or without loss depending on the task: archives use lossless compression, but images, audio, video files – lossy compression. Compression algorithms do not satisfy strict avalanche criterion and depend on properties of data to be compressed.
Compression algorithms don’t satisfy strict avalanche criterion, therefore the properties of compressing data influence on the properties of compressed data.
Lossless compression used for archives is based on probability algorithms that equalize the frequency of occurrence of compressed data elements: common elements are replaced by short code words, rare ones by longer ones. Thus, in the compressed data one equalizes the probability of the occurrence of symbols, which is knowingly equal for various element values in pseudorandom and encrypted data. For example, plain text data is compressed in volume by several times, which does not hold true with regard to the compression of encrypted or pseudorandom data. Using of probability algorithms leads to high entropy for compressed data that, therefore, satisfy tests for uniformity.
Lossy compression used for audio, video files and images is based on revealing of significant components of data and application lossless compression to them [2]. Such transformation leads to high entropy for compressed data that, therefore, satisfy some tests for uniformity.
Other statistic properties of compressed data are based on properties of data being compressed, the presence of certain symbol values in it and combination of compression algorithms that were used.
Mentioned compression algorithms use substitution only: RLE, LPC, DC, MTF, VQ, SEM, Subband Coding, Discrete Wavelet Transform, PPM, Huffman and Shannon-Fano coding, arithmetic and probability coding, etc. [11] Repeated sequences of elements or sequences of elements defined in the codebook are replaced by codes. The codebook can be constructed in the process of coding or specified at the beginning or coding.
However, it should be noted that in order to improve the quality of compression one applies permutation algorithms: BWT, MFT, etc. The purpose of the permutation is a transformation of the compressed sequence which would allow to place elements with the same values together with the possibility of a clear inverse transformation after the permutation. Therefore, during the permutation one achieves a high dependency between the elements, which are subsequently replaced by codes.
The compressed data passes the majority of statistical tests. Uniformity is achieved by aligning the frequency of occurrence of characters, but it is also true in terms of the distribution of the available characters in the compressed data, but can not be achieved in terms of the distribution of all possible values of the characters.
Independence of sequence elements is achieved by requirement of recovering data after compression and by nature of compression. Independence of elements in a block of compressed data and among blocks isn’t provided by compression algorithm as entirely dependent on compressible data itself. Elements values that are next added compressed data without taking into account their mutual dependence. Thus, compression algorithms do not ensure the absence of certain dependencies between blocks of compressed data, however, they can be provided with compressible data.
Thus, even used in combination permutation and replacement algorithms do not provide good mixing properties of compressed data, and does not satisfy all statistical properties to verify the uniform distribution of the elements of the pseudorandom sequence, and independence of the elements together. In this regard, an estimation of their statistical properties can be used for the separation of compressed file formats of files containing pseudorandom data.
For this purpose, it is suggested to use simplified model of estimation that is described in section “The Evaluation of the Statistical Properties of a File”.
3. The Evaluation of the Statistical Properties of a File
Existing approaches which have been described above deal
with numerical sequences, therefore we will represent file f as a finite
sequence of bytes ![]() of length
of length ![]() , where
, where ![]()
![]() . The sequence is usually analyzed byte by byte
or by blocks from left to right in order to set the uniformity and independence
of elements in the sequence relative to each other.
. The sequence is usually analyzed byte by byte
or by blocks from left to right in order to set the uniformity and independence
of elements in the sequence relative to each other.
To solve the stated tasks a statistical hypothesis ![]() is introduced:
"The properties of the sequence similar to those of the pseudorandom
sequence", and an alternative to it
is introduced:
"The properties of the sequence similar to those of the pseudorandom
sequence", and an alternative to it ![]() : "The properties of the sequence are
different from the properties of the pseudorandom sequence."
: "The properties of the sequence are
different from the properties of the pseudorandom sequence."
Authors consider this sequence in a different way. One will
plot the sequence onto the plane, the x-axis of which is plotted with values
from 0 to ![]() , and
the y-axis with those from 0 to 255. One will fill the plane with points
, and
the y-axis with those from 0 to 255. One will fill the plane with points ![]() , such that
, such that ![]() is the number of a
byte in the sequence of bytes of the file, and
is the number of a
byte in the sequence of bytes of the file, and ![]() is the value of the byte.
is the value of the byte.
Authors have introduced a definition.
Definition. Points on the mentioned plane have
uniform distribution if the probability of finding a point in the plane in a
fragment of minimum size: ![]() is the same for any fragment of this size and
is equal to
is the same for any fragment of this size and
is equal to ![]() .
Thus, there are no areas of high and low concentration of points on the plane.
.
Thus, there are no areas of high and low concentration of points on the plane.
It is logical to assume that points will be applied evenly on the plane for the pseudorandom data and the encrypted data. This follows from the fact that the subsequence of the pseudorandom sequence is also subsequent, and thus has a uniform and independent distribution of all its values. Since elements are applied to the plane in accordance with their position in the sequence and the value, they will be arranged evenly on this plane. An example of a fragment of such a plane (hereinafter - the plane of distribution) is shown in figure 1.
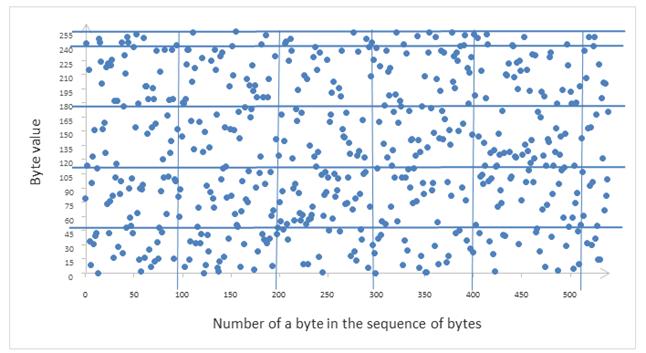
Fig. 1. A fragment of a plane where points are represented by elements of sequence of bytes
The plane is divided into fragments with size WxH, where W and H are set arbitrarily.
If the distribution in the plane is uniform, the density of
element distribution is the same in each fragment and is close to ![]()
For each fragment, the density of points in a fragment is relative to the size of that fragment and is calculated, i.e.:
![]() . (1)
. (1)
Calculating the density of each fragment a sequence of densities is formed, thus a rearrangement is carried out:
![]() (3)
(3)
where ![]() is the number of the resulting fragments as a
result of moving through the contents of the plane using the method of a
sliding window sized
is the number of the resulting fragments as a
result of moving through the contents of the plane using the method of a
sliding window sized ![]() .
.
There is a good reason to carry out the move from fragment to fragment using the sliding window method from left to right, since the accumulation of the values of bytes of one value will be placed horizontally. At vertical motion all the values that are available in the subsequence of length W will be captured, in connection with which a significant surge or drop in the density values will be smoothed.
It is also worth noting that it is advisable to choose the window size based on the size of the sequence (file) being tested, since the aim is to get a larger size of densities vector, which is achieved by reducing the size of the fragment given a small file size.
Density sequences obtained for different file formats will
differ greatly from density sequences for files with encrypted data, due to the
presence of operational information in the files that defines the distribution
of the values of bytes in the file, and the features of file structure. For
pseudorandom data the densities for the fragment of any size should be close to
the ![]() reference
value. While for other file formats operational information expressed in a
cluster of the predetermined range of byte values in the plane will lead to the
presence of surges or drops in density values in the sequence. In this
connection, it is possible to produce the identification of encrypted and
pseudorandom data by means of checking density sequences for the presence of
expressed deviations from the mean density value in the density vector.
Examples are given in the “Visualization of file contents”.
reference
value. While for other file formats operational information expressed in a
cluster of the predetermined range of byte values in the plane will lead to the
presence of surges or drops in density values in the sequence. In this
connection, it is possible to produce the identification of encrypted and
pseudorandom data by means of checking density sequences for the presence of
expressed deviations from the mean density value in the density vector.
Examples are given in the “Visualization of file contents”.
4. Visualization of file contents
One will get a visual representation of dependence between
density and its number in sequence of density for different file formats with
entropy. One will take files sized from 1MB to 10MB, window size: ![]() , and obtain a
sequence of densities for each of them.
, and obtain a
sequence of densities for each of them.
Files of compression formats are chosen for experiment, representatives of which are listed in the table below.
Table 1. The list of files for testing
|
Filename |
Entropy |
Chi-square test value |
Monte Carlo value |
Arithmetic mean |
|
test.jpg |
7.97 |
429711.58 |
3.23 |
124.59 |
|
test.ods |
7.99 |
1956.72 |
3.13 |
126.94 |
|
test.aes |
7.99 |
248.46 |
3.14 |
127.47 |
|
test.wmv |
7.97 |
99963.81 |
3.09 |
126.15 |
|
test.mp3 |
7.94 |
1542810.27 |
3.11 |
125.11 |
|
test.pdf |
7.90 |
218024.01 |
3.14 |
124.79 |
|
test.mpeg |
7.89 |
769440.90 |
3.28 |
116.38 |
|
test.7z |
7.99 |
231.99 |
3.14 |
127.49 |
|
test.zip |
7.99 |
933.50 |
3.16 |
127.48 |
|
test.m4a |
7.87 |
757648.04 |
3.17 |
118.03 |
|
test.mp4 |
7.98 |
244899.91 |
3.04 |
130.73 |
As one can see from the table, all the selected files have high entropy which is characteristic of encrypted files and pseudorandom data. Below in Fig. 2 - 12 fragments of the distribution of densities for different file formats are shown.
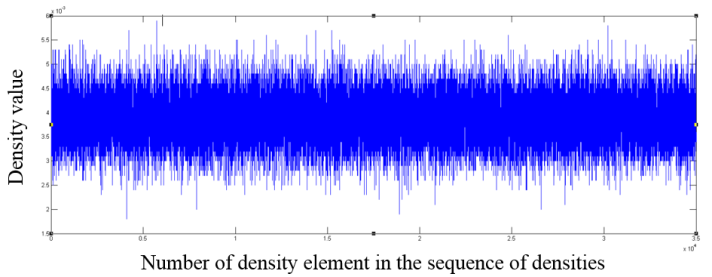
Fig. 2. The fragment of the distribution of density values for a file encrypted with AES algorithm
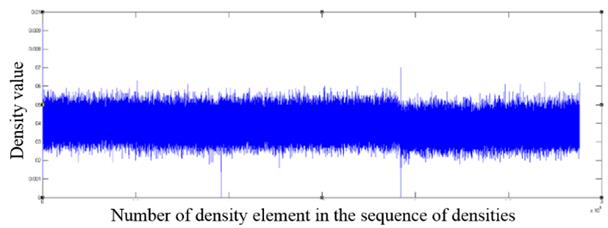
Fig. 3. The fragment of the distribution of density values for a jpg format file
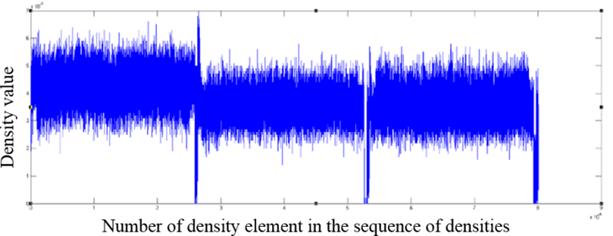
Fig. 4. The fragment of the distribution of density values for a m4a format file
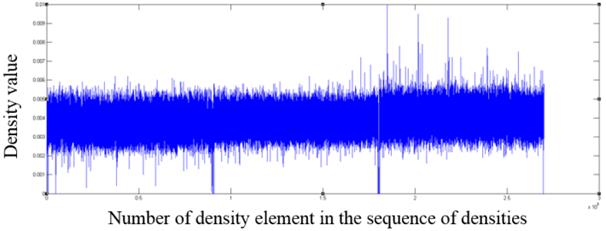
Fig. 5. The fragment of the distribution of density values for a mp4 format file
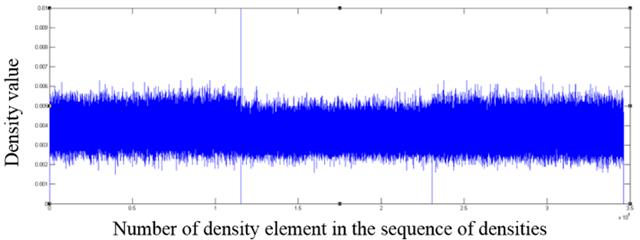
Fig. 6. The fragment of the distribution of density values for a mp3 format file
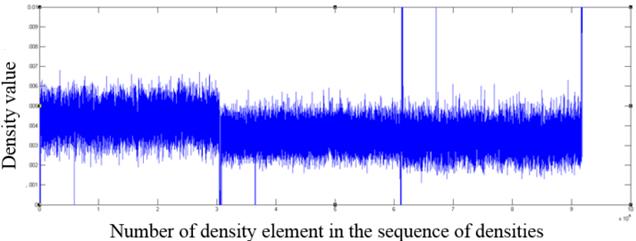
Fig. 7. The fragment of the distribution of density values for a mpeg format file
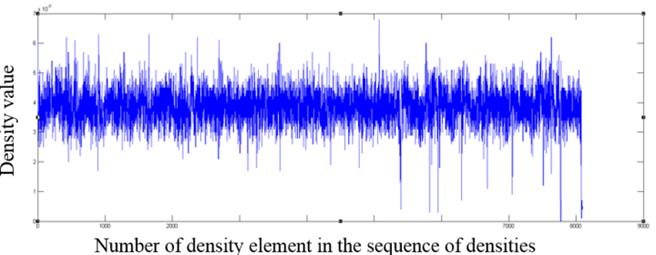
Fig. 8. The fragment of the distribution of density values for an ods format file
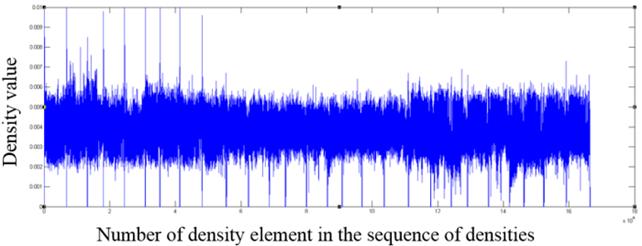
Fig. 9. The fragment of the distribution of density values for an odt format file
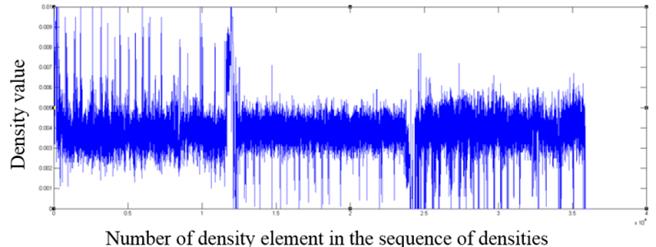
Fig. 10. The fragment of the distribution of density values for a pdf format file
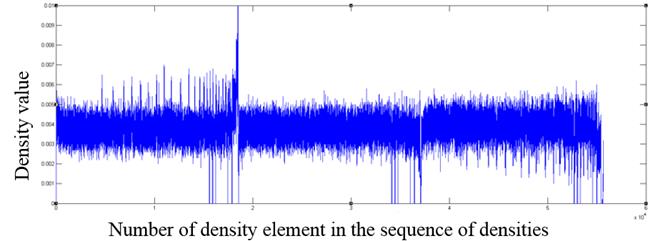
Fig. 11. The fragment of the distribution of density values for a wmv format file
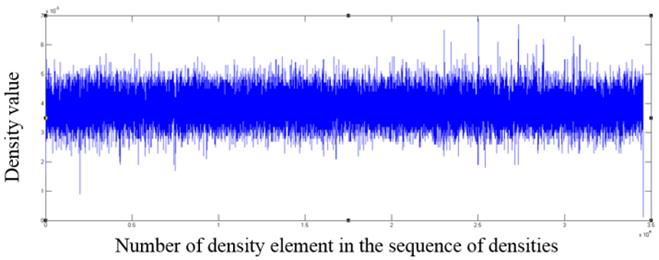
Fig. 12. The fragment of the distribution of density values for a zip format file
As one can see from the graphs, file formats other than the those encrypted with AES algorithm contain in the density distribution visible surges relative to the mean value, which can serve as an indicator of the inhomogeneous distribution of bytes in the file, and consequently of the lack of encryption.
For the compressed formats and pseudorandom data mean
density value fluctuates around the value of ![]() .
.
Constructing such graphs gives an expert a visual representation of the distribution within a file and allows to identify significant local deviations from the mean value in the distribution of densities as a sign of heterogeneity in byte distribution.
5. Software implementation of the results
Based on the described method of visualization of file contents one conducted the research of statistical properties of files with well-known formats in comparison with files with pseudorandom data. As a result the threshold values for arithmetic mean and variance were obtained for file contents as well as wavelet coefficients with Haar mother wavelet. These results allows to develop software, which architecture is shown below on fig. 13.
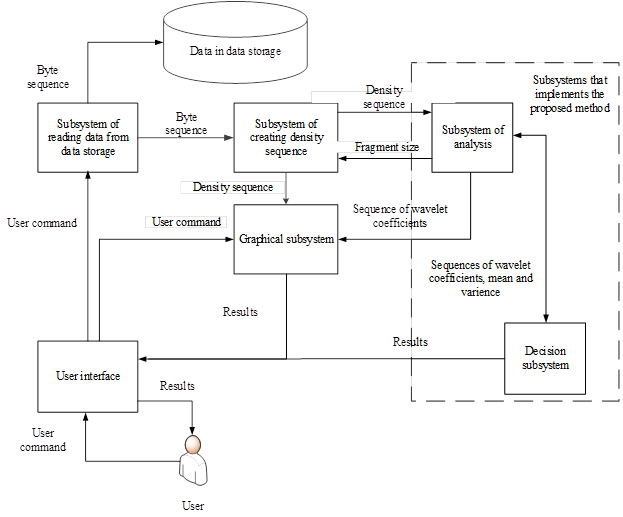
Fig 13. Software architecture
Transmitted data are marked in fig. 13 over the arrows among the subsystems.
Software is written in C# for Microsoft Windows operating systems and file system NTFS.
The results of its testing are given in section “Results and discussion”.
6. Results and discussion
Testing of developed program was performed on collection «filetypes1» [12] that contains files of different formats and files with pseudorandom data. The collection consists 1 793 different files, including 445 files with pseudorandom data for which results in table 2 are listed separately.
The proposed approach was tested using ![]() and
and ![]() window fragments excluding file
headers. Test results are shown in Table 2, Table 3 and are compared with test
results of Chi-square test for uniformity with level of significance 0.01 for
the same collection.
window fragments excluding file
headers. Test results are shown in Table 2, Table 3 and are compared with test
results of Chi-square test for uniformity with level of significance 0.01 for
the same collection.
Table 2 Type I error as a result of the experiment
|
Evaluated Value
Name of the collection |
Number of files |
The proposed method Type I error ( |
The proposed method Type I error ( |
The proposed method Type I error ( and |
Chi-squared test Type I error |
|
filetypes1 (pseudorandom) |
445 |
0% |
0% |
0% |
1,798% |
Table 3. Type II error as a result of the experiment
|
Evaluated Value
Name of the collection |
Number of files |
The proposed method Type II error ( |
The proposed method Type II error ( |
The proposed method Type II error ( and statistics) |
Chi-squared test Type II error |
|
filetypes1 |
1 348 |
9,718% |
8,754 |
7,806% |
7,715% |
Experiment shows that proposed method reduces type I error to zero, type II error is contributed by files of jb2 format that is a graphical one and is not spread widely. Moreover, all existing tests define files of this format as pseudorandom. Excluding this format makes type II error less than 1%. By the way, type I error for Chi-square test for uniformity can be reduced by decreasing the value of significance level but this leads to the considerable increase of type II error.
7. Conclusion
During forensic expertise the searching for pseudorandom data is an important step. Existing approaches are based on statistical tests for assessment of properties of pseudorandom data. Some tests are not adapted for use in file system and don’t take into account file formats specific. Moreover, their use for the analysis of all the files in the file system is resource- and time-consuming because they are used together to overlap errors of each other. Other test have significant type I and II errors.
For the clarity and speed of analysis, authors have suggested a method to visualize the distribution of bytes in a file. The result of this analysis is the graphs of the distribution of densities in which pseudorandom data is characterized by the absence of pronounced deviations from the uniform distribution which definition is introduces in the article.
The article contains examples of graphics for different file formats and the difference between distributions for files with pseudorandom data and files with compressed data is shown. One can also search for distribution deviations in the file / sector / cluster itself on the basis of the proposed method of visualizing the content.
Based on proposed method of visualization a program was developed that performs searching for pseudorandom data in the file system automatically using statistic values and wavelet transform. Program testing shows that type I error is reduced to zero and type II error for files of spread formats is less than 1%.
References
- NIST SP800-22. A Statistical Test Suite for Random and Pseudorandom Number Generators for Cryptographic Applications, NIST, 2010, p. 131.
- Marsaglia G. The Marsaglia random number CDROM including the diehard battery of tests. 1995, URL: http://stat.fsu.edu/pub/diehard/.
- Knuth, D. E. The Art of Computer Programming, Volume 2: Seminumerical Algorithms, 3rd ed., Addison-Wesley Pearson Education, Canada, 1997.
- L’Ecuyer P., Simard R. TestU01: A C library for empirical testing of random number generators. ACM Transactions on Mathematical Software (TOMS), 2007, vol. 33, I. 4, no. 22.
- Killmann W., Schindler W. A proposal for: Functionality classes for random number generators. Tech. Rep. 2. Bundesamtf¨ur Sicherheit in der Informationstechnik (BSI), 2011, p. 133.
- Passware Kit Forensic 2015; http://www.lostpassword.com/kit-forensic.htm (last accessed 03/17/2015)
- Belkasoft Evidence Center 2015; http://ru.belkasoft.com/ru/ec (last accessed 03/17/2015)
- Using Passware Kit Forensic with EnCase; http://www.lostpassword.com/encase.htm (last accessed 03/17/2015)
- Oxygen Forensic Suite; www.oxygen-forensic.com/ (last accessed 03/17/2015)
- Jozwiak I., Kedziora M. and Melinska A. Theoretical and Practical Aspects of Encrypted Сontainers Detection. Digital Forensics Approach, Dependable Computer Systems, Springer Berlin Heidelberg, Berlin, Germany, 2011, pp. 75-85.
- Weston P., Wolthusen S. Forensic Entropy Analysis of Microsoft Windows Storage Volume. Information Security for South Africa, 2013, pp. 1 - 7.
- Digital corpora Filetypes1, 2014, URL: http://digitalcorpora.org/corp/nps/files/filetypes1/