VISUALIZATION AND QUANTITATIVE DIAGNOSTICS OF A DIFFUSE LIQUID LAYER IN THE PRESENCE OF INTERNAL WAVES BY LASER REFRACTION TECHNIQUE
I. L. Raskovskaya, B. S. Rinkevichyus, and A. V. Tolkachev
National Research University “MPEI”, 111250, Moscow, Russian Federation
Rinkevichyus B.S. Email: rinkevbs@mail.ru
Content
3. Experimental setup and measurement results
Abstract
An experimental setup is developed to create, visually observe, and quantitatively investigate internal waves with a view to detecting the effects of alteration of the density distribution parameters in a diffuse layer of a salt-stratified liquid. Based on the application of a new laser refraction method combined with the direct shadowgraph technique, the density distribution parameters of the liquid layer are diagnosed during the course of propagation of solitary waves therein. The effect of pulsation of the thickness and density distribution of the layer during propagation of a soliton developing therein as a result of its initial stepwise perturbation is discovered experimentally.
Keywords: laser beam, optical inhomogeneous medium, refraction, solitary wave, laser diagnostics, physical processes in liquids
The study of density-stratified liquids is one of important areas of modern hydrophysics. The great amount of works along these lines (Djordjevic and Redecopp 1978; Kao et al. 1985; Mowbray 1967; Chashechkin and Mitkin 2001; Raskovskaya et al. 2011; Krikunov et al. 2011) is conditioned by the need to reveal the physical nature of a wide range of phenomena playing important parts in the dynamics of the environment and in modern technological processes. Stable density stratification is typical of natural bodies of water, the ocean included. As a rule, such stratification is due to nonuniform heating of the water mass and also depth-wise distribution of its salinity. Internal waves can develop at the interface of two liquids differing in characteristics, for example, fresh and salt water, for the densities of both media are different.
One of the main methods to study internal waves is laboratory modeling. Studies into solitary waves – solitons– are of separate interest. The main problems encountered in model experiments are associated with the creation of density stratification and the measuring and controlling its characteristics. Salinity stratification is the kind that is usually created in laboratory model experiments. The necessary density distribution here is attained by reducing salt concentration along the vertical.
When studying physical processes occurring in liquids, remote optical techniques allowing high-precision measurements to be taken without perturbing the parameters of the medium under study (Mowbray 1967; Chashechkin and Mitkin 2001; Raskovskaya et al. 2011; Krikunov et al. 2011; Cerisier 2002) have an undoubted advantage over contact methods. In this work, quantitatively to study internal waves, use is made of a new contactless laser refractographic technique (Rinkevichyus et al. 2011; Settles 2011; Raskovskaya 2009; Raskovskaya 2013) that makes it possible to simultaneously investigate in several sections of the liquid layer of interest not only wave parameters, but also changes in the structure of the layer consequent upon propagation therein of a soliton.
The description of internal waves usually proceeds from the well-known equations of the dynamics of a stratified liquid for which equilibrium density distributions and boundary conditions at the surface and bottom are specified (Djordjevic and Redecopp 1978). Solitons of moderate amplitude can exist only in the presence of a relatively thin layer in an experimental cell, when the characteristic scale L of the wave is great by comparison with the depth of the entire water body or some of its isolated layers.
Consider a most simple two-layer model (Djordjevic and Redecopp 1978; Kao et al. 1985) where the depth density dependence has the form of a step at some depth h and remains constant above and below this level. In that case, an internal wave propagating along the horizontal axis x is described by the well-studied Korteweg-de Vries equation (Djordjevic and Redecopp 1978), whose soliton solutions have the following form:
![]() , (1)
, (1)
where η(x,t) is the departure of the interface between the layers from the unperturbed level.
The velocity V of the soliton and its characteristic half-size L are related to the amplitude h0 by the following relations:
![]() ,
, ![]() , (2)
, (2)
where the parameters
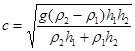 ,
, ![]() , and
, and![]() (3)
(3)
are expressed in terms of the densities of the top and bottom layers, r1 and r2, respectively, and their thicknesses h1 and h2.
In modeling the experiment, we put h1 = 0.05 m, h2 = 0.15 m, r1 = 1000 kg/m3, r2 = 1030 kg/m3, and h0 = –0.03 m. In that case, the theoretical parameters will have the following values: c = 0.104 m/s, a = –2.054 s–1, b = 0.00013 m3/s, and the velocity and characteristic half-size of the soliton will be V = 0.13 m/s and L = 0.15 m, respectively.
Our experimental setup is intended to perform the following two main tasks: to generate internal perturbations in a transition layer between fresh and salt water and to visualize the processes under study, followed by their digital recording with a view to obtaining quantitative information about the parameters of internal waves and deformations of the layer.
To tackle the first task, we made a cell of polished glass 1500 mm long, 302 mm wide, and 302 mm deep (Fig. 1). To obtain a two-layer stratification, the cell was filled with a NaCl solution with a density of r2 = 1030 kg/m3 so as to form a layer with a thickness of h2. Floating interleaves were then placed on the surface of the salt solution and fresh water was slowly poured over their wetted surface to obtain a layer with a thickness of h1. A diffuse transition intermixing layer was thus formed between the NaCl solution and water, whose parameters depended on the concentration of the salt solution, temperature, and volumes of the liquids.
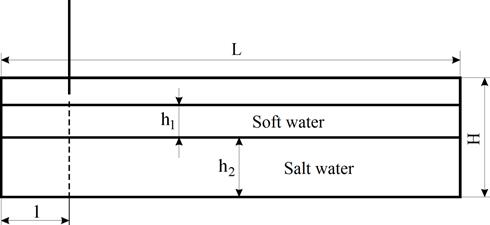
Fig. 1. Geometrical parameters of the experimental cell: length L – 1500 mm, depth H – 302 mm, h1 – thickness of the fresh water layer, h2 – thickness of the salt water layer, l – width of the sluice chamber.
To generate solitons in the two-layer stratification, the cell was provided with a sluice chamber equipped with a sliding gate (the distance l between the gate and side wall of the experimental cell could be varied from 100 to 200 mm). The side faces of the sluice gate closely fitted the inner side surfaces of the cell. A clearance space of z = 20–30 mm was set between bottom face of the gate and the bottom of the cell. Figure 2 presents the appearance of the sluice chamber with its gate partially open.
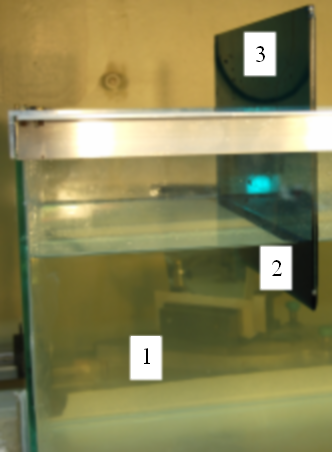
Fig. 2. Appearance of the sluice chamber with its gate partially open: 1 – bottom layer, 2 – water level in sluice chamber, 3 – sliding gate
Extra water was slowly poured on the wetted surface of the floating interleaf in the sluice chamber, the amount of water being determined by the experimental conditions used. As a result, salt solution started to flow through the open sluice gate into the experimental cell, while the diffuse layer in the sluice chamber went down. The total level of the liquids in the cell rose but insignificantly. Thus, a certain level difference h0 set in between the intermixing layers located in the main part of the cell and in the sluice chamber. The generation of an internal soliton in the two-layer stratification took place when the sluice gate was suddenly pulled out. Once formed, the soliton started moving from the sluice chamber along the main part of the experimental cell.
To carry out the second task associated with the visualization of the soliton and determination of its parameters, we suggested and realizeded using the laser refraction method (Rinkevichyus et al. 2011; Settles 2011; Raskovskaya 2009; Raskovskaya 2013) and direct shadowgraph diagnostic techniques concurrently.
Figure 3 presents a block diagram of the experimental setup. Cell 1 with sluice chamber 2 and sliding gate 3 are intended for the generation of solitons. The elements numbered 4 through 10 are intended for implementing the direct shadowgraph technique to visualize solitons and constitute the first measuring laser channel of the setup. The narrow beam of laser 4 (532 nm in wavelength and 100 mW in power) is transformed by means of telescopic system 5 into 100 mm wide beam 6 that is directed by means of external mirror 7 onto ground glass screen 8 fixed on the front wall of the cell. Direct shadowgraph 17 on screen 8 is taken by digital video camera 9 interfaced with personal computer 10 that directly records video images.
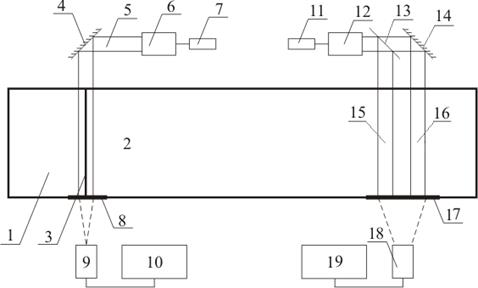
Fig. 3. Block diagram of the experimental setup (top view): 1 – sluice chamber, 2 – operating chamber, 3 – sliding gate, 4 – mirror, 5 – wide laser beam, 6 – optical system for forming the wide laser beam, 7 – laser, 8 – screen No. 1, 9 – digital video camera No. 1, 10 – personal computer No. 1, 11 – semiconductor laser module, 12 – optical system for forming flat laser beam (laser sheet), 13 – semi-reflecting mirror, 14 – mirror, 15 and 16 – probing laser sheet, 17– screen No. 2, 18 – digital video camera No. 2, 19 – personal computer No. 2.
The elements numbered 11 through 16 implement the refractographic diagnostics technique. The computer–laser refractographic channel of the experimental setup includes semiconductor laser module 11 (542 nm in wavelength and 3 mW in power), optical system 12 for transforming the beam of the laser module into 160 mm wide flat beam (laser sheet) 15 inclined at some angle (from 30 to 75 degrees) to the horizontal. Observed on ground glass screen 14 is the image (refractogram) of a section of beam 15, whose shape distortions are due to refraction in the transition layer. The time variations of the shape of the refractogram are recorded with digital video camera 18 interfaced with personal computer 19. The propagation of the soliton along the diffuse layer causes the shape of the direct shadowgraph and refractogram to vary with time. Figure 4 presents the appearance of the experimental setup, and Fig. 5, a sequence of frames, illustrating the generation of a soliton and its propagation in the cell.
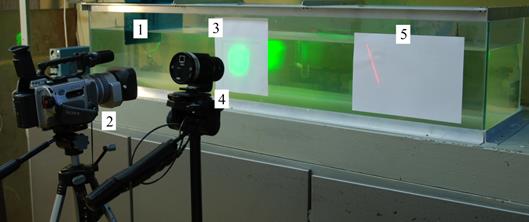
Fig. 4. Appearance of the experimental setup: 1 – sliding sluice gate, 2 – digital video camera for the observation of direct shadographs, 3 – ground glass screen No.1, 4 – digital video camera for the recording of dynamical refractograms, 5 – ground glass screen No.2.
|
|
|
|
c |
|
Fig. 5. Generation of a soliton and its propagation in the experimental cell along the diffuse layer: (a) the sliding gate of the sluice chamber is closed; (b) the gate is withdrawn from the sluice camber; (c) the soliton is generated; (d) propagation of the soliton.
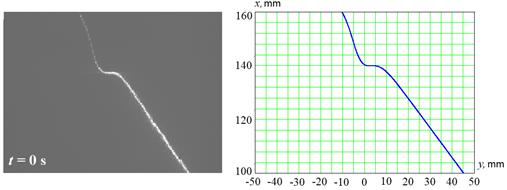
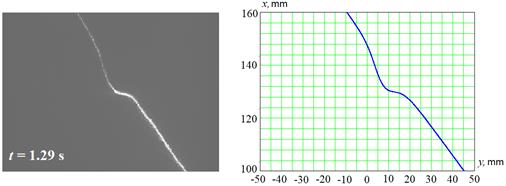
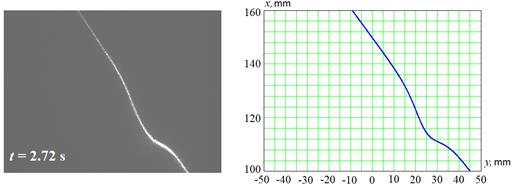
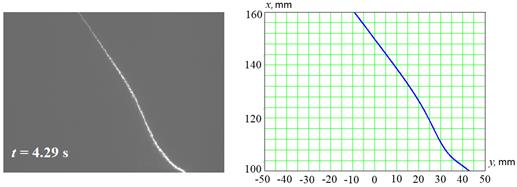
The operation of the refractographic channel of the experimental setup can be illustrated using as an example the recording of refractograms whose shape varies with time as the internal perturbation propagates along the experimental cell.
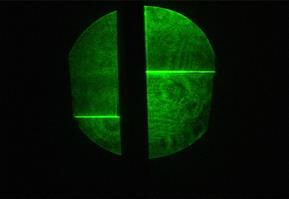
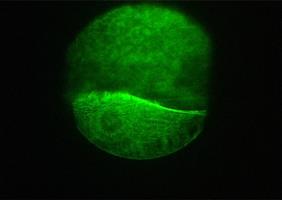
Figure 6 presents experimental video images of refractograms alongside their respective standard theoretical counterparts that reflect the propagation dynamics of a soliton crossing the probe laser beams (laser sheets).
|
a) |
|
b) |
|
c) |
|
d) |
Fig 6. Experimental video images of refractograms and their respective standard theoretical counterparts that reflect the propagation dynamics of a soliton crossing the probe laser beam (laser sheet): (a) unperturbed layer; (b)–(c) intermediate positions; (d) extreme position of the layer.
The standard theoretical refractograms were calculated on the basis of the method, described in (Raskovskaya et al. 2011; Rinkevichyus et al. 2011) for an inhomogeneity of the refractive index in a layer of the form
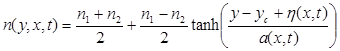 , (4)
, (4)
where the refractive indices of the top an bottom layers, n1 and n2, respectively, were determined on the basis of the empirical formula (Yin 1980)
![]() (5)
(5)
at k = 0.248 cm3/g, r0 = 0.248 g /cm3 (for water temperature of 20 °C).
The quantity yc in relation (4) corresponds to the initial level of the center of the unperturbed layer, h(x, t) is the departure of the center of the layer from the unperturbed level consequent upon the passage of an internal wave, and a(x, t) is the characteristic thickness of the diffuse layer, whose variation during propagation of the soliton causes deformation of the density distribution in the layer.
The processing of the experimental images (Fig. 6) on the basis of the method of minimization of the objective function (in comparing with the standard theoretical images) makes it possible to determine the departure h(x, t) of the center of the layer and its characteristic thickness a(x, t) at the reference instants of time indicated in Fig. 6.
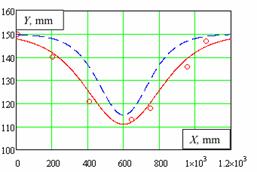
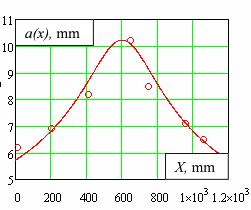
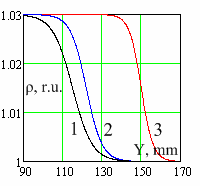
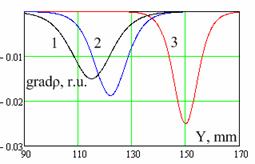
When additionally measuring the velocity of the soliton, it proves possible to reconstruct its profile and characteristic length. The propagation velocity of the perturbation was determined by a special method using probe laser beams spaced at a specified distance of d = 85.1 mm apart (Fig. 7). In that case, we fixed the deviations of the beams that corresponded to the extreme values of h(x, t). With the recording rate known (7 frames per second in the given case), we could find the time Dt it took for the soliton to travel 85.1 mm. In our case, Dt = 0.572 s and the velocity of the soliton is V = 148 mm/s, which corresponds to the theoretical value by formula (2) with an error of less than 10 %. Based on the experimental results obtained, we reconstructed the profile of the soliton (Fig. 8a) and the correspondent variation of the thickness of the layer (Fig. 8b). Figures 8c and d show the density distribution and density gradient, respectively, in three different sections of the layer.
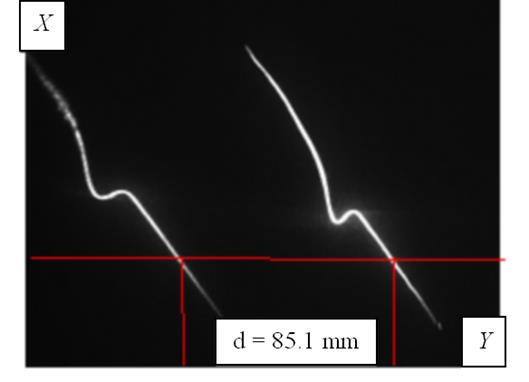
Fig. 7. Propagation of the soliton across two parallel flat laser beams (laser sheets).
|
a |
b |
|
c |
d |
Fig. 8. Results of the quantitative reconstruction of the parameters of the wave disturbance and characteristics of the layer: (a) theoretical (dashed curve) and experimentally obtained (solid curve) profile of the soliton; (b) variation of the characteristic thickness a(x) of the layer as a function of the position of the section (the distance x along the experimental cell); (c) density distribution r(y) in the layer at (1) x = 650 mm, (2) x = 400 mm, and (3) x = 50 mm; (d) density gradient distribution in the layer at (1) x = 650 mm, (2) x = 400 mm, and (3) x = 50 mm.
Figure 9 presents the results of computer visualization of the profile of the soliton, due regard being given to the variation of the density distribution in the layer. The ability to reconstruct the density distribution in a two-dimensional inhomogeneity allows this method of processing measurement results to be classed with tomographic techniques (Raskovskaya 2009).
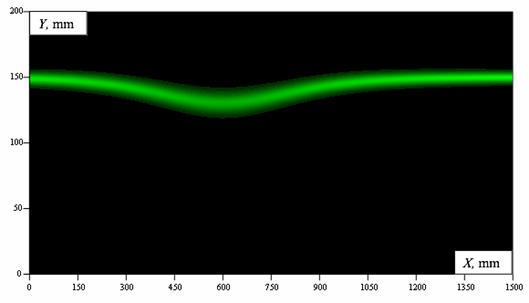
Fig. 9. Computer visualization of the profile of the soliton.
The results of refractographic measurements of density distribution in a layer are of considerable interest. As follows from quantitative data, the layer has the greatest thickness at the extreme point (minimum) of the profile of the soliton, its minimum thickness being under equilibrium conditions. Most simple models of the propagation of solitons in a pycnocline (Djordjevic and Redecopp 1978; Kao et al. 1985) presume the constancy of the characteristic thickness of the layer. The discovery of the variation of the thickness of the layer suggests that shear flows could possibly have taken place in this experiment and caused this effect. The possibility of finding fine effects associated with the structure of the layer is an undoubted merit of the refractographic technique.
In connection with the results obtained, worthy of note is the importance of concurrent visualization of gradient inhomogeneities and particle trajectories in liquid (Djordjevic and Redecopp 1978), which will make it possible to study in detail the mechanism governing the propagation of the perturbation and give adequate interpretation of the dynamical physical processes occurring in the pycnocline.
This work is supported by the Russian Foundation for Basic Research (project No. 14-08-00948a).
Conflict of interest: I. L. Raskovskaya, B. S. Rinkevichyus, and A. V. Tolkachev state that there are no conflicts of interest.
 a
a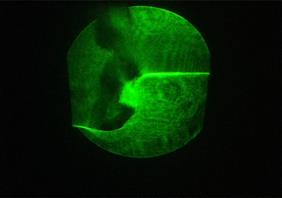 b
b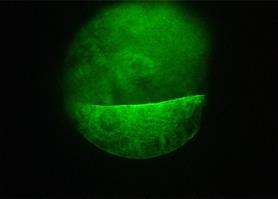
 d
d