TECHNOLOGY AND SYSTEM FOR VISUALIZATION OF HUGE SYNOPTIC DATA AMOUNTS
S.V. Melman1, V.A. Bobkov2
melman.sv@dvfu.ru, bobkov@iacp.dvo.ru
1Far Eastern Federal University, School of Engineering, Vladivostok, Russia;
2Institute of Automation and Control Processes, Vladivostok, Russia
Content
2. Parallel-distributed processing technology
3. Synoptic objects visualization system with parallel-distributed processing
3.1. Processing of input synoptic data and system functionality
3.3. Client front-end application
3.4. Client computer-intensive application
Abstract
Technology of visualization system development for huge synoptic data amounts with the use of distributed and heterogeneous (parallel/hybrid) computing is represented.
Keywords: scientific visualization, distributed computing, client-server, synoptic data
Atmospheric effects and ocean dynamic studies carried out by the meteorologists imply work with huge amounts of spatial data. Therefore, in the course of development of software systems providing for automation of scientific studies in this field, two basic missions – quick processing of huge amounts of information and 3D visualization of data facilitating spatial perception of synoptic data and weather analysis – emerge. Efficiency of the system in whole depends on the results of their solution.
The system for synoptic data visualization pre-developed by the authors was designed for the work on a standard personal computer. The system was represented by the set of software applications and a separate visualization program. Reasonable visualization speed for the results of preprocessing of data saved to the hard disk drive was provided. However, further system development in several directions – expansion of functionality for 3D-objects visual analysis with more advanced interface and the use of several dynamic plug-in modules, multi-dimensional and temporal animation, increased volumes of satellite data – required crucial maximizing of computational power. The new system version is oriented on the use of multiprocessing systems with organization of parallel computing.
The works with the use of hybrid-distributed computing that, as a rule, takes into account specific character of certain subject, appeared with the development of heterogeneous parallelism technologies. For example, the authors of [1] offer using hybrid-distributed approach with application of MPI and multiprocessor-computing architectures for visualization of the results of vector fields math modelling. The matters of simultaneous application of multilevel parallelism with distributed computing and related problems were reviewed in [4, 5]. The work [6] discusses the matters of visualization of physical fields modelling results on the example of acoustic signal propagation modelling.
This paper offers technology and system of visualization of huge data amounts with implementation of multilevel hybrid (GPU+CPU) parallelism and distributed computing. New architecture of software solution is built on the use of client-server technology with centralized database and possibility to connect both personal computers and giant-powered computers as computation nodes. Applied module approach provided for the possibility to expand algorithmic and functional base at the expense of connection of additional modules via plug-in technologies.
Offered technology of parallel distributed processing of huge amounts of data on heterogeneous computing architectures in the context of processing and visualization of satellite synoptic data is based upon the following principles:
These principles are implemented in a new visualization system architecture. The architecture also takes into account the specific character of work with synoptic data. Synoptic data means scalar and vector fields of weather characteristics distribution. Data may be one-dimensional (sensors, fixed radars readings), two-dimensional (weather maps, satellite cloud or ice images, etc.) and spatial (wind, pressure, temperature fields, etc.). Besides, visualization system must work with standard data formats used by the meteorologists. The data may be both static and time-varying, i.e., dynamic.
The offered architecture provides the user with transparent data workflow that covers all stages of work with data from data request from special-purpose databases to visualization as well. Each of described stages of data preparation is carried out with the help of plug-in module that allows considerable adding system functionality in the whole.
Visualization process in the system is carried out as a simple cyclic order: data acquisition, processing, preparation for visualization, and visualization itself. The greatest computing load falls upon the stage of processing and preparation for visualization. It includes modelling, replenishment, filtering, discharging of data. This work is entrusted to distributed system. Visualization itself is carried out totally on user PC equipped with up-to-date powerful graphics accelerators.
Module principle formed the basis of previous system. According to it, all functional blocks were implemented as separate software dynamic modules. Necessary dynamic modules were automatically connected. Such an approach allowed accumulating algorithmic base without changing main application.
Specified solutions largely allowed using previous works, including loading, filtering and visualization modules.
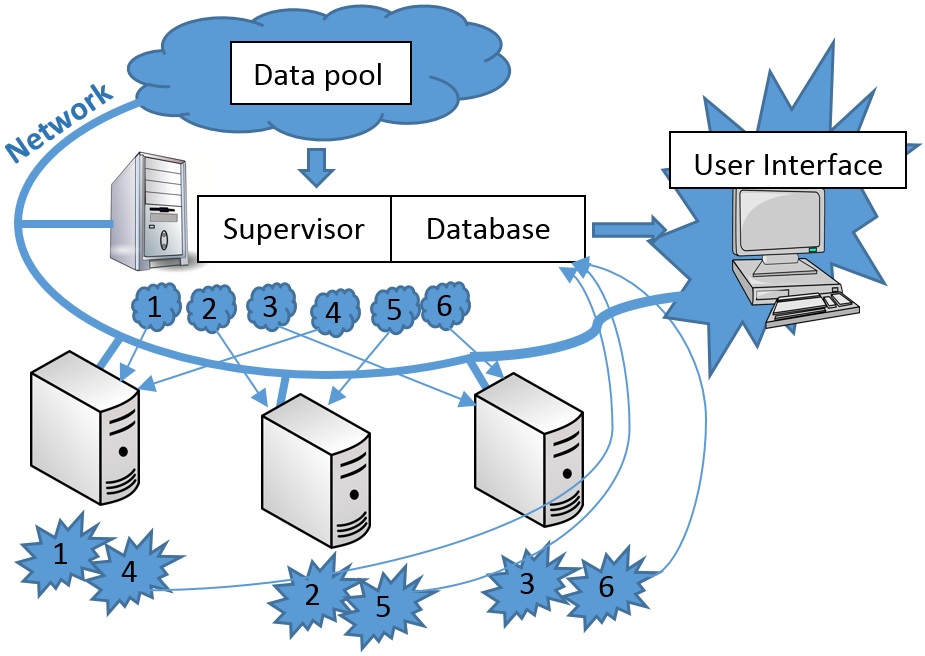
Client-server part of distributed computing (fig. 1) performs the following functions:
Fig. 1. Data processing pipeline
Implemented communications protocols allow launching client computer-intensive applications on the cluster. Both application and computing modules porting into cluster operation system is still necessary.
The process of data processing and visualization is represented in figure 2 in the form of branch pipeline.
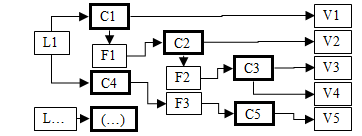
Fig. 2. Data processing pipeline
At the beginning of work with the system, the user is offered a list of modules for work with data (loading module – L). The user may choose several loading modules at a time. One module may work with several data samples preset by the user, which form data containers – С). Data container is a data set with identifier determining data type. Then, if necessary, a set of filters (filters – F), is determined for each container. The result of work of such containers is also a data container. The user is also offered a set of visualization modules (visualization module – V) according to their types. Several visualization modules may be added for one container, and at the stage of selection from the whole set of processing modules only those modules are available for the user, which are designed for the container data type.
In the client’s front-end application the data processing and visualization pipeline is convenient to be represented in the form of tree architecture (fig. 3).
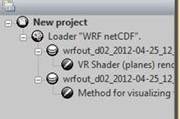
Fig. 3. Tree representation of data processing pipeline in user application
Before visualization, data passes through several stages:
Server part of the system is implemented in the software application combining database and supervisor. The supervisor coordinates work of distributed system, forming task packets for computation nodes and their modules. Database is used for centralized collection and storage of data processing results from computation nodes. Database keeps only the latest data for current pipeline settings. If user changed parameters of any computation module then all data containers that depend on it, shall be cleaned and recalculated again, thereafter they are updated at the side of the client visualization front-end application.
Database communications protocol is TCP protocol that provides lossless data delivery.
Work sequence:
Distributed computing scheme excludes the possibility to request recording of the same data set from different computer-intensive applications as far as the work on data calculation among computation nodes is distributed for different points of time (we mean date/time of data survey). Parallelism within the frames of one moment of time is at the level of computation module. So, it became possible to avoid using the scheme of database blocking and, consequently, acquisition of data from different computer-intensive applications may take place independently in parallel mode.
Only data for chosen time point of dynamic data is considered the latest. Therefore, the work of computation pipeline is necessary for temporal animation at each interval of timescale. In this case, the data communication via LAN will be the bottleneck. The client front-end application makes provision for data cache to avoid deceleration of temporal visualization. During the first pass along the temporal scale all acquired data is kept on the hard drive at the key points. After the first pass, when all data is collected locally in binary form, visualization is carried out at a high speed. The key points are the moments of time when data set was measured. Temporary data grids between the key moments are calculated on the fly at the client side. All temporary files are deleted upon application work completion. The experiments have shown that operating speed of modern CPU and hard drives is enough for smooth temporal animation of data from cache as far as major computation load falls on data processing pipelines.
If the user changes filter parameters or the parameters of other computation modules, then, as stated before, data is recalculated. The procedure of the key-moments calculation takes place not from the earliest to the latest, but into both directions from current location of the temporal slider. It is made for the user to have possibility to continue visual examination of data in the neighborhood of current time.
Functional possibilities and the tools of visual analysis of the client front-end application is described in the earlier works of the authors [2, 3]. The examples of data visualization is represented on fig. 4 and 5.
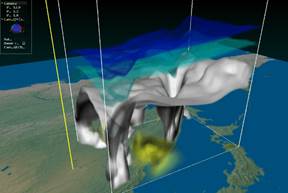
Fig. 4. Visualization of temporal layers received by math mesoscale forecast model WRF-ARW and calculated for weather forecast
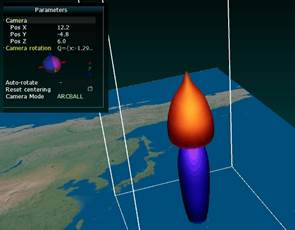
Fig. 5. Visualization of temperature anomalies in the tropical cyclone core
Client computer-intensive application is the interface linking computing modules with distributed database. It provides for cache (copies of only necessary data from the database), is engaged in data communication and updating.
To provide temporal animation the computation pipeline works only for the key moments of time.
Task packet distributed by the dispatcher for computation node contains pipeline description with all parameters of computation modules that specified by the user in the front-end application, number of temporal slices (measurements) and the order number assigned to the node. Having received the packet, each computation node carries out full pass along the pipeline for its own part of data and sends the result to the database. Knowing own order number and the amount of temporal slices the node processes only those for which the reminder on dividing the number of the cut by the number of nodes shall give the order number of this node. The numeration of nodes and slices starts with zero. For example: there are temperature profiles received once a day within 5 days, that is, 5 temporal slices, it is also known that there are 3 computation nodes, then the zero node processes slices 0 and 3, the first node - 1 and 4, the second node processes the 2nd cut. As far as the quantity of slices in a standard task amounts to dozens and the number of nodes are much less, the efficiency of the scheme does not suffer.
Computing experiments were carried out with the data of tropical cyclones and satellite profiles with the application of different visualization algorithms: volume rendering on shaders and 3D textures, isosurfaces visualization by means of marching cubes, visualization of TC center movement. Computation modules for conversion of satellite monitoring profiles into a standard grid, replenishment of missing data and calculation of anomalies in tropical cyclone centers were used.
Automatic data loading about satellite profiles was carried out via FTP-protocol from the satellite-monitoring center in the IACP FEB RAS.
Besides the experiments with the data of forecast WRF model of relevant areas of Primorsky region and period from April 25, 2012 until April 29, 2014 were carried out.
The experiments have proved efficiency of the system built based on the offered technology. Developed visualization system allowed making request in fully automatic mode to cloud storage and visualizing obtained data within the frames of one user interface.
Expansion of number of modules for synoptic data loading from public places (via Internet), creation of highly specialized data visualization modules (weather, ice cover mapping, etc.), development of mechanism for measurement tools expansion with the help of modules via plug-in technology are planned in the future works.
The work is financially supported by RAS Program for science strategic growth priorities “Fundamental problems of mathematical modeling” and the Program “The Far East” (project 15-I-4-025) and published under financial support of the Russian Foundation for Basic Research, grant 15-07-20347.
ТЕХНОЛОГИЯ И СИСТЕМА ВИЗУАЛИЗАЦИИ БОЛЬШИХ ОБЪЕМОВ СИНОПТИЧЕСКИХ ДАННЫХ
С.В. Мельман1, В.А. Бобков2
melman.sv@dvfu.ru, bobkov@iacp.dvo.ru
1Дальневосточный федеральный университет, инженерная школа, Владивосток, Россия;
2Институт автоматики и процессов управления, Владивосток, Россия
Аннотация
Представлена технология создания системы визуализации больших объемов синоптических данных с использованием распределенных и гетерогенных (параллельных/гибридных) вычислений.
Ключевые слова: научная визуализация, распределенных вычислений, клиент-сервер, синоптических данных