NUCLEAR REACTOR RBMK ARCHIVE DATA VISUALIZATION
A.M.Zagrebayev, R.N.Ramazanov
National Research Nuclear University MEPhI (Moscow Engineering Physics Institute), Russia
amzagrebayev@mephi.ru, tem@gmx.com
Contents
Abstract
The described computer program is designed for the analysis of archival data and the visualization of various parameters of the nuclear power RBMK unit. The reactor core includes 1884 channels. Each channel has varying properties and measured parameters. The program allows presenting the archive data about the condition of the unit as cartograms, tracking the history of parameters changes as graphs and writing the required data in a text file. The program also provides opportunities to compare various parameters and to represent the result of the comparison as cartograms or text data allowing identifying the areas for research. For preliminary calculations with archival data, there is a special script editor called Boo. The data to display is taken from the "SKALA-MICRO" system remote storage, text files, burst can detection system database. The input data is stored in the same format in a PostgreSQL database, which supports the remote connection to the archive.
Keywords: data analysis, scientific visualization, nuclear reactor RBMK, "SKALA-MICRO" system, burst can detection system, research, graphic interpretation.
1. Introduction
RBMK is a graphite-moderated nuclear power reactor designed and built by the USSR to produce saturated steam. Coolant is boiling water. In Russia operates 11 power units with RBMK at three nuclear power plants: Leningrad, Kursk and Smolensk. Contribution RBMK in total electricity generation of all Russian nuclear power plants is about 50%.
One of the most important control systems of the RBMK-1000 is a centralized reactor control system "SKALA". This system developed for the first two units of the Leningrad nuclear power plant ("SKALA" stands Control system of the Leningrad nuclear power plant) was subsequently applied to all RBMK-1000 in Russia. Information-measuring system continuously conducts cyclic polling process control sensors and control of equipment. Flow rate, pressure, temperature, steam drum level, the parameters of cooling water in the channel, the gas circuit settings are entered into the system.
Between reactor control systems, there is a local network. Information from different systems at regular intervals enters the general system "SKALA-MICRO". Current information is displayed on the unit control board, and the outdated information is collected in a database. The database here is directory with files containing all the information about the measured and calculated parameters, settings, constants, and other data. The depth of the archive is from six months to a year. However, it is uncomfortable to work with this set of files. In addition, when the hard disk is full, the files with the earliest time of creation are automatically deleted.
Researches related to the operation of nuclear reactors, usually include the problems of the analysis of archive data. For example, employees can analyze the data to adjust the operation of the reactor. Archive data allow you to check the mathematical models describing the physical processes taking place in the reactor core. Statistical analysis allows evaluating various probabilistic characteristics of the field distribution in the core, which can be used, for example, to modify the algorithms of neutron calculations, mathematical methods for the restore of lost records from the control sensors and diagnostic performance core detectors.
To solve the problems of the analysis of data the scientific visualization method is currently widely used. The essence of the method is that the analyzed data is associated in one way or another with some graphic interpretation, which can then be analyzed visually and the results of the analysis of this graphic interpretation are then interpreted in relation to the original data.
Often in studies of processes in nuclear reactors, scientific visualization method is used to represent data modeling, as well as for technical training aids. Examples of such systems are: Scientific-Technical Complex "Nuclear Fuel Cycle", created in the Kharkov Scientific-Technical Institute, an educational system PMT-4, created based on the ENIKAD environment by laboratory training systems MEPhI. These systems, as well as all foreign systems, simulate the core of nuclear reactors VVER. An example of the RBMK reactor core visualization system was developed at VNIIEF as the characteristics visualization module KORAT-3D. However, these systems can render the results of simulation calculations and, while it is often necessary to study the actual archived data from various reactor systems, including RBMK.
Thus, the task of creating is to create such a storage, which can receive information about the parameters of the reactor state during the reactor operation from various process control systems (such as the "SKALA-MICRO" system, burst can detection system etc.) The storage should be able to store large amounts of data. Visual shell should provide data in the form of cartograms, track the history of changes in the parameters of any number of channels in the form of graphs of parameter changes over time, displaying the necessary data to a text file, and compare the various parameters at any moment. The result of the comparison should also be presented visually in the form of cartograms or text files. Such opportunities are needed to simplify the identification of archive sections for research.
2. Database creating
Initially, the RBMK used a "SKALA" system designed for process control equipment and perform calculations. It was later introduced the second generation of information-measuring systems "SKALA M". It is currently used system of the third generation "SKALA-MICRO". The system is a local area network. It is based on a modular microprocessor control means of computer technology and personal computers. Archive of "SKALA-MICRO" system is stored as files on the hard drives. There are two storage formats: Kursk NPP used old storage format, at Smolensk NPP used new storage format (MDX-files).
The database in the old data storage format consists of 4 categories of files:
• constants file with the extension *.INI include settings information, tables of coordinates, magnitude, dimension of measured values and other infrequently changing information;
• the data files with extension *.IZM include the codes of the parameters, setpoints and deviations from setpoints parameters of the reactor;
• "PRISMA" restart files (stands for Program Power Measurement of the nuclear power plant) without the extension include integral parameters and the parameters set by the staff;
• file extensions *.PRZ, *.BDN, *.STG, contain the results of calculations of the "PRISMA" program and the averaged parameters.
In the new storage format restart files and calculations of the "PRISMA" program files (extensions *.PRZ, *.BDN, *.STG or without extensions) are not available, data is stored in a Firebird database. Each table corresponds to a file with *.MDX extension. Some files are present in each "time slice", some store not time-dependent data. Brief description of the tables (and the corresponding files with the extension *.MDX) are presented in table 1, 2.
Table 1. Description of the files that are present in each time slice
|
Type |
The contents of the file |
|
DA |
The measured parameters needed to calculate the "PRISMA" program |
|
NR |
Core fuelling, the calibration factors, dispersion calibration, neutron-physical calculation |
|
CN |
Journal of the constants of the "PRISMA" program and other constants |
|
CL |
The results of calculations by the "PRISMA" program for use in programs and procedures print (update at the end of each calculation) |
|
CI |
Integral parameters calculated in the "PRISMA" program (update with a period of 1 hour) |
|
CG |
Data control flow rate through the channels of the reactor |
|
CH |
The position of the shut-off and control valves of each fuel channel |
Table 2. Description of the files that are missing in the time slices
|
Type |
The contents of the table |
|
CP |
Arrays diagnostic codes indicative of the "PRISMA" program (update at the end of each calculation) |
|
С8 |
The average values of distributed parameters (update once per shift or when authorized by the shutdown "PRISMA") |
|
US |
Setpoints |
|
PL |
The result of calculation by POLARIS |
|
PO |
The result of calculation by POLARIS |
|
CF |
Constants for calculation of POLARIS |
|
PA |
Address sensors |
|
PC |
Currents sensors |
|
PU |
The sequence of control rods extraction |
File ARC_MDX.XLS is attached to data in a new format. It contains detailed descriptions of the tables (files). It is a spreadsheet where each sheet contains a description of the fields in one table (the structure of a single file). In Fig. 1 shows one of the sheets containing the structure of the file SANR.MDX.
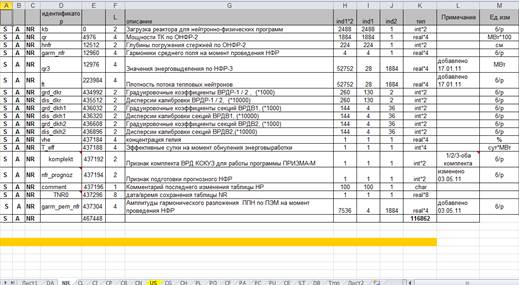
Fig. 1. Description of location data in SANR.MDX
The burst can detection system archive is formed in a MySQL database, which is accessed remotely. However, each set of burst can detection system data is recorded for 30 minutes, and each set of "SKALA-MICRO" system data is recorded for 5 minutes. It is therefore necessary to associate time data from different reactor control systems and convert them into a single format.
A free object-relational database management system PostgreSQL was chosen as storage. It is cross-platform, exists for Linux, Solaris, Windows, Mac OS X, FreeBSD, QNX. The program is written in C# programming language for .NET 2.0 and consist of some projects. Database operations, data conversion and data visualization modules designed as separate projects. The interaction of the modules shown in Fig.2.
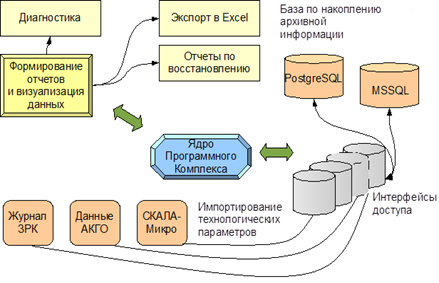
Fig. 2. The interaction of program modules
3. Visual shell creating
To visualize the collected data are the visualization modules. They have flexibility, and if necessary allow you to add a visualizer to extend the set of displayed parameters. To view the archived database from remote workplaces was created a special module was created for visualization of archived data in a user-friendly form. This module is also used for exporting data for analysis and calculations.
The module interface is presented in Fig. 3. In the main
window of the program analyzes the current state of the database is analyzed
and generates a list of available "time slices" is generated. In the
header of the main window displays information about the time of the last
update is presented. On the toolbar There is a button on the toolbar to update
the list of available "time slices" manually. In the center of the
program window displays the cartogram of the parameter selected from the list
is displayed. Periodically (by default every 30 seconds) the program
automatically updates the list of available "time slices".
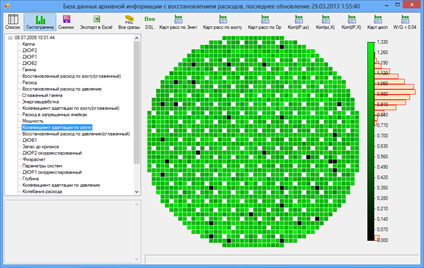
Fig. 3. The window of the visualization module after
selecting the required information
From the "SKALA-MICRO" system get core fuelling, the coolant flow rate in each channel, information about the position of control rods, the readings of the neutron flux sensors and the estimated parameters reactor power, energy-producing of fuel assembly and reactivity margin (see Fig. 4, 5, 6).
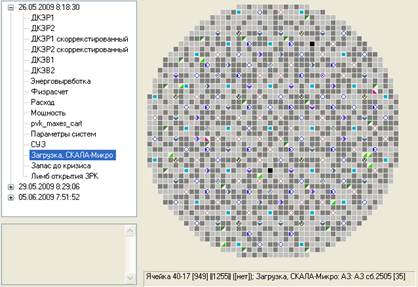
Fig. 4. Core fuelling of RBMK
In the right part of the window displays a histogram of the distribution channels of the selected parameter is displayed. The height corresponds to the number of channels with this parameter value. This method of visualization allows to show the integral characteristics, as well as a visual estimateion of the density distribution of the parameter.
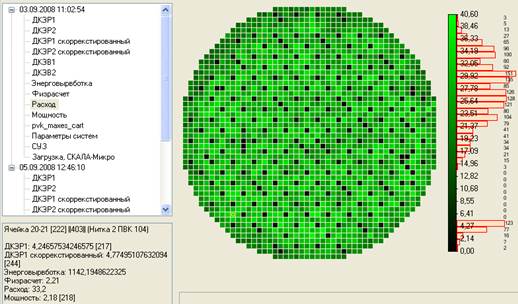
Fig. 5. The coolant flow rate in the RBMK channels
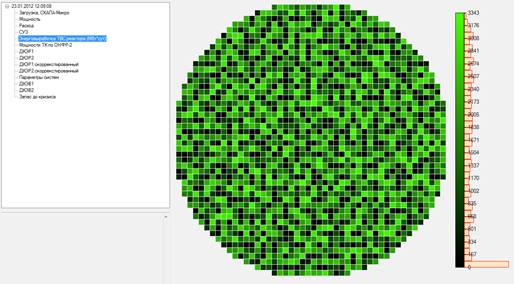
Fig. 6. Energy-producing of RBMK fuel assembly
For characteristics that are not representable in the form of cartograms, one uses the representations in the form of graphs and tables. For example, information from the burst can detection system is displayed in graphs. The graphs evaluated the correctness of the information and errors (stopping the truck with the sensor, zero signal, etc.). After the visual evaluation data associated with the archive "SKALA-MICRO" system or one can cancel or the add data (see Fig. 7).
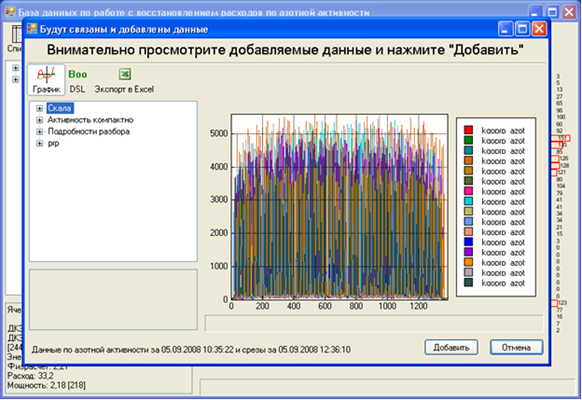
Fig. 7. Adding information from the burst can detection system
The software also allows you us to view history of changes of any parameter at a time from you’ the archive. This can be used to search for transients (see Fig. 8) both local and global.
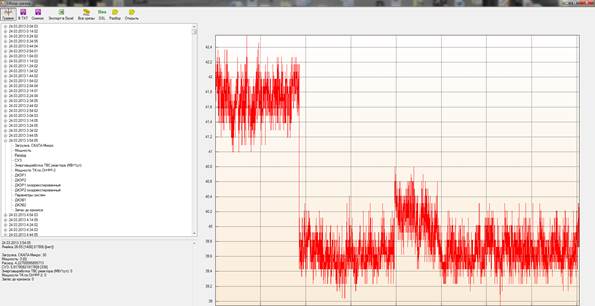
Fig. 8. Visualization of the change of the selected parameter allows to detect
transients
The reactor core is symmetrical, so there are similar channels. A graphical representation of changes in the parameters can be used to search for such channels to find the reactor core clusters for the study.
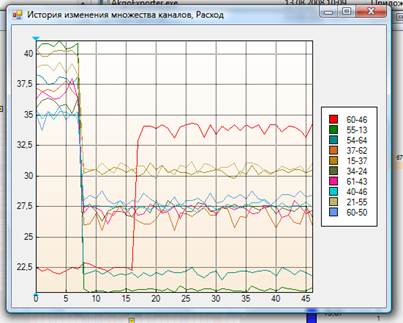
Fig. 9. Change settings for different channels
With the help of the visual shell it is possible to compare the parameters at various time points and to visualize the result of the comparison cartograms. Deviation of the parameters in time is displayed in blue or red, and the color saturation indicates the amplitude of the deviation and the color indicates the sign of the deviation. Channels with unchanged parameters are shown in white (see Fig. 10).
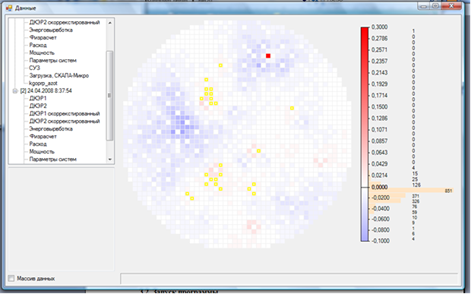
Fig. 10. View difference cartograms
In addition, the visual shell includes a special script editor Boo for preliminary calculations with archival data. The editor interface is presented in Fig. 11.
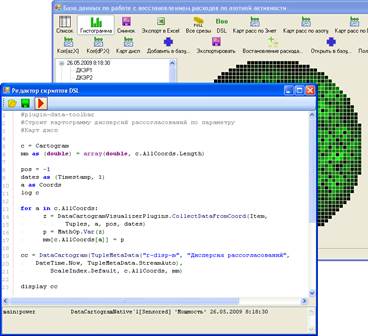
Fig. 11. Script editor for preprocessing information
4. Discussion and conclusions
This article provides a description of the computer program designed for analysis of archival data and visualization of various parameters of the nuclear power RBMK unit.
The program reviewed can be used by plant personnel for management purposes and for scientific research from the archived database. Along with the scientific research, the program can be used in the educational process at MEPhI for teaching students.
In the future, it is planned to expand the set of scientific visualization tools and application programs using the accumulated archive of data and their visual representation for scientific research.
References
1. Nuclear Power Engineering. Problems. Solution / Edited by M.N. Strikhanov. - Part 1. - Social Forecasts and Marketing Center (2011)
2. N. A. Dollezhal' and I. Ya. Emelyanov Kanal'nyj jadernyj jenergeticheskij reaktor [A Channel-Type Nuclear Power Reactor], Atomizdat, Moscow (1980) [in Russian].
3. M. A. Abramov, V. I. Avdeev, E. O. Adamov, et al., in: Kanal'nyj jadernyj jenergeticheskij reaktor RBMK [RBMK Nuclear Channel Power Reactor], Yu. M. Cherkashov (ed.), NIKIET, Moscow (2006) [in Russian].
4. Zagrebaev A. M., Kostanbaev S. V., Ovsyannikova N. V. et al. Flowrate monitoring in an RBMK process channel on the basis of coolant information. ATOMIC ENERGY, Volume 108 Issue: 2 (2010).