Visualization of talant pool evaluation results for key positions promotion
N.I.Ishchenko, G.G.Rekhina
NIIshchenko@mephi.ru, GGRekhina@mephi.ru
National Research Nuclear University MEPhI (Moscow Engineering Physics Institute), Moscow, Russia
Contents
2. Main characteristics of the Assessment center
3. Assessed qualities of candidates
4. Features of the «Reserv» program complex
5. Results visualization of testee`s assessment with application of PC «Reserv»
Annotation
The article covers the experience of current information technologies usage during the assessment of talent pool for key positions in Rosatom. In order to visualize experiments results a special program application «Reserv» was created, capable of processing and presenting results of Assessment center, which was taken as a methodology of evaluation, in a convenient for analysis way.
Keywords: personnel reserves, methodology of Assessmentcenter, results visualization, program complex «Reserv».
1. Introduction
The essential tasks of the modern management are selection, evaluation and training of the human resource for the key positions. Authors of this paper have summarized their years of experience in the evaluation procedure of the human recourse at the SC «Rosatom» Enterprise. A well-established methodology of the assessment center has been used as a method of evaluation (AC).
AC efficiency essentially depends on the quality of processing and visualization of the testing results. A special software package «Reserv» (PC «Reserv») was developed specifically for this purpose. It can process and display the results of the evaluation test in a generalized form, as well as separately by different characteristics assessed. The presentation view may be determined by the decision maker.
A group of 90 employees, enrolled in the talent pool and promotion sound better, participated in the procedure of assessment.
AC technology is widely used in foreign companies practice. In comparison with other methods of appraisal and personnel selection, (such as certification in the form of peer assessment, interactive control over the appraise, interviews), it allows you to get a higher reliability of results during the primary set of can did at assessment. AC complements other forms of personnel assessment, such as "360 degrees diagnosis".
AC software support, which is implemented in the PC «Reserv» can significantly enhance the ability to analyze and interpret the results of the evaluation.
2. Main characteristics of the Assessment center
Assessment center (AC) is one of the comprehensive methods of staff assessment based on complementary techniques. The method is targeted at assessment of employee’s psychological and professional qualities, position compliance, it also allows to identify specialist`s potential. Today AC is one of the most precise methods of employee`s skills assessment. International practice shows that AC allows to manage following tasks with up to 87% precision:
- To select the best candidate for vacant position.
- To reveal potential of a candidate.
- To form the pool of candidates.
- To prepare individual development plan as well as corporate staff training program.
The main technological stages of AC are as follows:
- Participants are observed during business cases simulation. This method resembles business training as different business games and tasks are offered to competitors, however the simulation purpose is not to develop their skills, but to offer a possibility to demonstrate their abilities in simulated environment.
- In each exercise every participant is carefully observed by an expert or group of experts whose main task is to follow participant’s behavior patterns. At the end of the exercise expert classifies the behavior (refers behavior to a corresponding skills set), and then assesses these skills sets.
- One of the essential parts of the method is integration of experts’ assessments from certain exercises into integral assessments by skills sets. It is generally done during joint discussion of results with provision of final assessment rationale. Such team work of experts allows to reduce the obtained assessments subjectivity and to provide higher estimation quality based on these assessments.
Current application of the method is defined in the Russian AC Standards, as well asin the international AC standards and a number of foreign AC standards.
Characteristics that define application of AC in Rosatom Enterprises:
- Originality. The method is adapted by the Russian specialists based on national experience.
- Targeted at evaluation of manager`s potential and skills. This technique is designed for development-oriented companies.
- Years of experience. AC methodology allows to assess a sufficient number of managers representing international companies.
- Application of special techniques, validated and compliant with international standards
- Application of methodology which represents a complex of formalized procedures and software tools, expert and test assessments of candidates in situations simulating real management activity.
In our case a business simulation «Organization image» was developed. This topic was chosen for the following reasons:
- Represents contemporary management problems;
- Relevant for middle and senior management;
- Corresponds to AC general purpose of management potential evaluation, and for this reason it reveals managerial potential as well as experience;
- It is relatively non-specific: every manager has certain “start” ideas independently of existing experience and character of his or her professional activity.
3. Assessed qualities of candidates
The qualities of candidates, which were required to be assessed are listed below. The results of the assessment were to be summarized and displayed by means of visualization tools.
Leadership skills
Possession of personal charismatic features: ability to influence others, to mobilize to achieve desired objectives. Organizational skills: ability to take responsibility.
Innovative orientation and commitment
The sense of belonging to the organization, understanding of its problems and willingness to participate in solving them. Being aimed at innovation, commitment to the the organization development .
General knowledge in the field of management
Understanding of the company’s basic laws and procedures, management functions. Knowledge of modern methods of organization management.
Creative and managerial potential
General intellectual ability. Skills of problems defining, goals and objectives setting. The ability to generate and develop new ideas. Ability to make administrative decisions under time pressure.
Strategic vision of the organization
Presence of comprehensive vision of the organization, ability to evaluate different sides of its activities. Orientation at strategic objectives and planning. Vision of the organization as an open, adaptive, evolving system.
Commitment to professional development
The ability to critically analyze the level of one’s professional competence. Pursuit of getting new knowledge and skills. Focus on high professional achievements. Open-mindedness and curiosity to new experiences. Having interest in new possible ways and means of professional activity.
Communication skills
Establishing rapport with teams and partners, desire to understand and take into account their position. Ability to establish contact and mutual understanding. Developed communication and presentation skills. Ability to use different ways of reasoning. Possession of active listening techniques. Ability to behave in a tense and conflict situations.
Energy potential
High behavioral activity. Constant involvement in the work.
Desire and ability to work in a team
Understanding of the importance of collaboration and team goals. Desire for a common discussion, joint decision-making. Orientation at the team members support, delegation. Ability to play different roles during group work. Ability to take responsibility for the execution of a common decision.
Cultural open-mindedness
Being decentered. The ability to accept cross-cultural values and norms of activities, to adapt to them. Ability to behave in compliance with the new conditions.
In accordance with the AC methodology, the assessment of the candidate is conducted by comparing their performance with a set of samples of behavioral indicators.
The total number of the employees who have been assessed is 92 people.
4. Features of the «Reserv» program complex
For processing and visualization of the evaluation results software package «Reserv» (PK «Reserv») was developed. It has the following modes:
- Input, correction of employees personal data.
- Keeping evaluations of employees archive.
- Receiving of employees standard staff-forms.
- Receiving of standard reports on there serves of the enterprise.
- Receiving of arbitrary profile of personnel in formation using a generator of arbitrary queries.
- Getting visualized profile of personnel information (different types of diagrams) containing both individual and group data.
5. Results visualization of testee`s assessment with application of PC «Reserv»
As a rule, social and economic objects are characterized by a large number of parameters forming multidimensional spaces, where tasks of interconnections study between components of this space are essential in social and economic research. These interconnections are necessary to be revealed on the basis of limited number of multidimensional observations.
To analyze multidimensional observations results the techniques of multidimensional data analysis are used.
The aim of the multidimensional analysis is to reveal correlations between analyzed components by defining ways of connections among many (generally 3 and more) features (not only obvious, but also hidden), which allows to explain observed processes, which is impossible to do with traditional one-dimensional techniques.
The fundamental distinction between multidimensional and one-dimensional data analysis is that a quantity of observed objects and features (as well as hypotheses, distribution laws and changes of their values in space and time) in this case are unknown but are to be found, which is the essence of the research itself.
Diversity of observed objects and features, non-obviousness of interconnections between them are defined by multidimensional nature of observed phenomena, forming complex multitudes of different objects and complex features which are impossible to reveal to study with ordinary one-dimensional techniques. Therefore it is necessary to apply multidimensional techniques of data analysis, and success of their application depends on knowledge of observed objects, their dimensions and different forms of multidimensional connections.
There are many techniques of multidimensional analysis, but they are disconnected and cannot be put together. The diversity of these techniques is defined by diversity of observed phenomena which should be reflected and measured by mentioned techniques. Their value is defined by the level of their conformity to the studied subjects, by the level of confidence and completeness of their revealing and explaining hidden cause-effect relationships of features, which cannot be traced by ordinary calculations and primitive digital illustrations.
In practice a certain limit has to be applied to existing diversity of multidimensional analysis techniques. Finally, only those of them can be used which adequately approximate well-known laws and hypothesis of data`s distribution and which can be widely applied in statistics.
Among these techniques special attention should be paid to the following methods: technique of correlated connections study, technique of component, factorial, discriminative and cluster analysis, modeling and data comparison.
In the present article the technique of multidimensional space reduction was chosen as a primary one. The idea of this technique is to express a big number of initial object-measured factors through a smaller number of more full and informative internal object characteristics that cannot be observed. The aim of such technique is to examine internal structure of observed random variables system, “compression” of this system without significant loss of information by revealing a number of factors which explain variability and interconnections of initial random variables.
Practical task here was the results visualization of expert assessments of candidates potential for key positions by means of conformance to certain criteria inspection (age, work experience in industry, work experience in current position) with purpose of correlation research of experts’ assessment and objective data of tests.
Here we are going to show the most significant results of the tests, data processing and visualization, which were carried out with the PC «Reserv».
The overall results of the test groups «reservists» are shown in Tab.1.
Table1 1.
|
Evaluation |
Number of tests |
|
Highly successful |
15 |
|
Rather successful |
29 |
|
Likely to be successful |
43 |
|
Unsuccessful |
5 |
|
Total |
92 |
Distribution of tests by categories, based on the assessment, are as follows (Fig. 1).
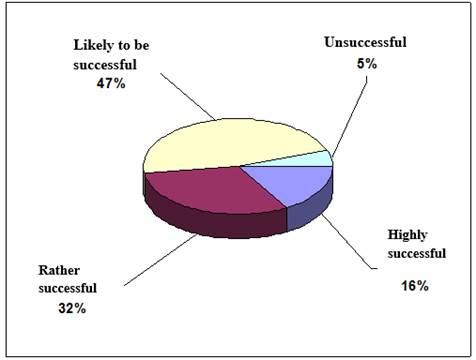
Fig.1. Distribution of tests by categories
The "spider" chart for different groups of subjects is shown below (Figure 2 - Figure 6), where axes represent the total value of feature assessments in compliance with the AC methodology.
Generalized diagram showing the entire spectrum of the investigated characteristics of all subjects is shown in Fig.2.
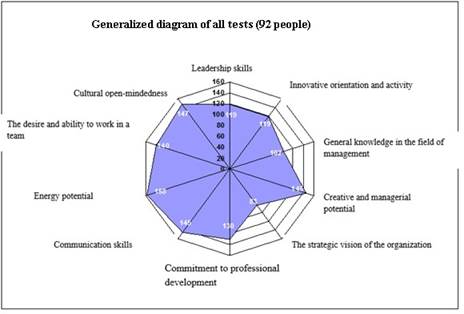
Fig.2. Generalized diagram for all tests (92 people)
Distribution of personal qualities for the category «highly successful» is shown in Fig.3.
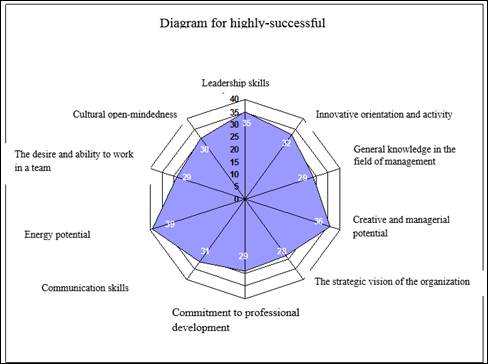
Fig.3.Generalized diagram of the test category «highly successful»
For the category «rather successful», the distribution of the personal qualities value is shown in Fig.4.
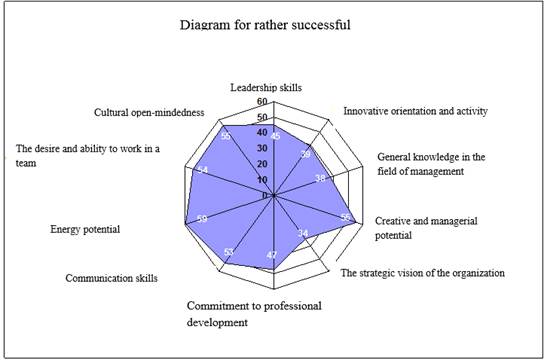
Fig.4. Generalized diagram of the test in the category «rather successful»
For the category of «likely to be successful» distribution of scores is shown in Fig.5.
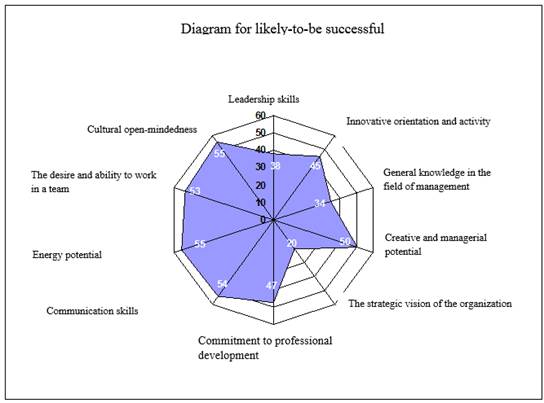
Fig.5. Generalized diagram of the test in the category «likely to be successful»
For the category of «unsuccessful» personal qualities are shown below in Fig.6.
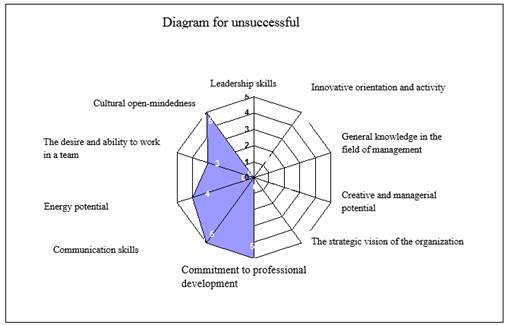
Fig.6. Generalized diagram of the test in the category «unsuccessful»
Based on the chart given above, it is possible to draw conclusions about the directions of further training and training to be carried out for each of the categories of specialists in the personnel reserve.
Analysis of test success dependence on various factors was conducted.
The graphs below (Fig.7 - 9) show the comparison of two variables: the resulting total score and one of the personnel reserve factors (age, length of service in the industry, in the present position). This allows to visually analyze the results of the research.
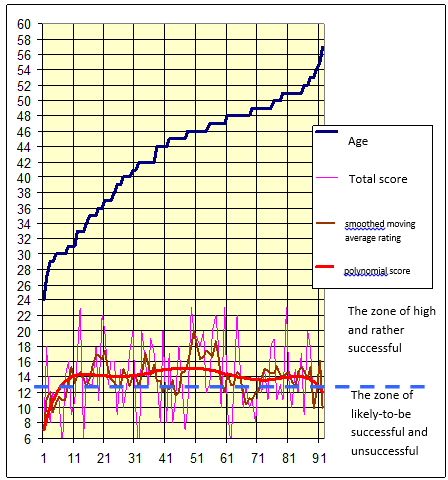
Fig.7. Comparison of the obtained score and the age of the tests
The diagram shows that, in accordance with the assessment, the tests at the age from 30 to 48 can be considered the most successful. According to experts, this age is the most productive, but it is usually vulnerable to so-called «middle-age crisis». The diagram also shows the reduction of the success rate for the 36 to 41 year-olds. A similar decline was also observed during the assessment in the enterprises of other companies [4]. Experts believe that the cause of the «middle-age crisis» is the difference between the «dreams» and the real situation.
Dependence of the success on the estimated length of service in the industry is presented below.
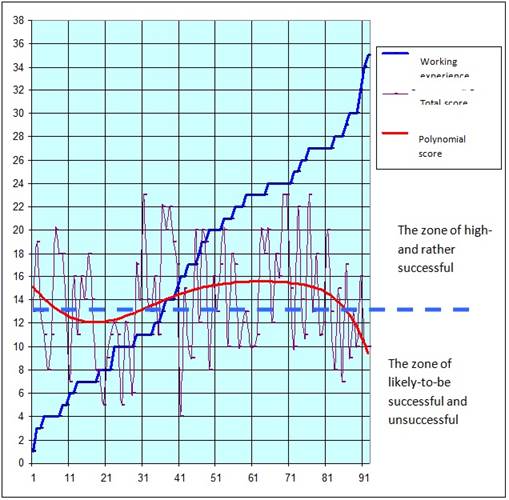
Fig.8. Comparison of the obtained points by tests by the experience, received in the industry
The chart shows that, in accordance with the assessment, the most successful are employees, who have worked at industry enterprises for 14-27 years. During the first 10-14 years the experience needed for high performance in such high-technology and socially responsible industry as nuclear is accumulated, then comes the effective period. With 1 to 4years length of service, the rise is explained by young age andoptimism, which is natural for this age. Dependence of tests’ success on the length of service on the currently occupied positions are shown below (Figure 9).
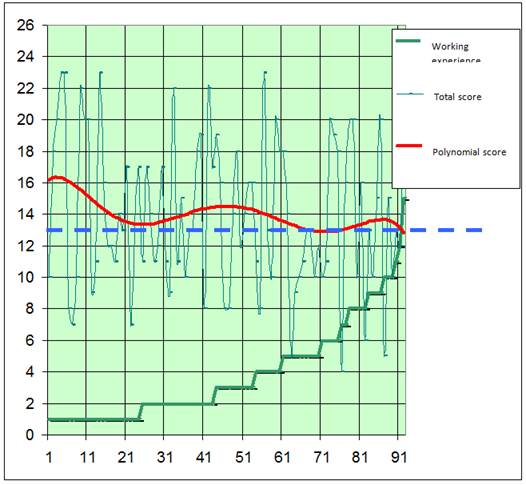
Fig.9. Comparison of the obtained tests cores and work experience in the currently occupied positions
The diagram shows that, in accordance with the assessment, the best and optimal work experience at one manager position ranges from 2 to 6 years. The decline after 6 years in the position, is explained by the "loss of faith" in their careers.
6. Conclusion
Our experience in participation in the AC and the results of such studies presentation has shown that the considered way of the results of the AC visualization is quite effective because:
1. It is compliant with the essential requirements of results presentation, such as:
-expressiveness and clarity,
-naturalness and relevance,
-concentration on the essentials,
-understanding of the basic gradients directions,
-the absence of unreasonable results,
-simplicity.
2. Visualization allows to show the test results to those of different back grounds, because it has a graphical display of quantitative and qualitative characteristics in easy to understand and match form.
3. Software implementation of the present method of visualization can display summarized results, in the form of arbitrary "cuts", including personal characteristics of the candidates in the talent pool and promotion sound better for enterprises of SC "Rosatom" in the dynamics.
References
1. http://abmgroup.ru/assessment-center (Available as of March, 2, 2015)
2. Federation of performance appraisal. 1. 2014. Russian standard of the Appraisal center.
3. Ballantajn I., Pova N. Assessment-centr. Full management (2 publication) – M.: GIPPO, 2008.
4. Kibanov A., Kashtanova E. Assessment-centr. Polnoe rukovodstvo [Management of business career, office and professional advance and personnel reserves. Manual.] –M.: GUU. Prospekt 2013.
5. Ishhenko N.I., Rekhina G.G Nekotorye podhody k ocenke kadrovogo potenciala rabotnikov organizacii. [Some approaches to personnel potential assessment of employees.] New industrial technologies №4, M., 2010.
6. Simchera V.M. . Metody mnogomernogo analiza statisticheskih dannyh. [Methods of the multidimensional analysis of statistical data. Manual.] –М.: Finance and statistics. 2008.
7. Kalinina V.N., Solovev V.I. Vvedenie v mnogomernyj statisticheskij analiz: Uchebnoe posobie. [Introduction to the multidimensional statistical analysis: Manual]. GUU. – М., 2003
8. Ishhenko N.I. Voprosy organizacii sistemnyh issledovanij kadrovogo potenciala jaderno-jenergeticheskogo kompleksa. [Organizational aspect of systematic research and analyses of human resources (hr) potential in the nuclear industry]. Scientifically practical magazine «Open education» №1, 2013.
9. http://www.buscon.ru/aboutus/article0060.php (Available as of March, 2, 2015)
10. http://www.hr-portal.ru/tags/assessment-centr (Available as of March, 2, 2015)