VISUALIZATION AND ANALYSIS OF THE RESULTS OF MOLECULAR-DYNAMIC MODELING OF INTENSIVE EVAPORATION OF LIQUID IN THE NEAR-CRITICAL REGION.
V.I. Mazhukin1,2, A.V. Shapranov1,2, A.A. Samokhin3, A.V. Mazhukin1,2, O.N. Koroleva1,2
1M.V. Keldysh Institute of Applied Mathematics, RAS, Moscow, Russia
2 National Research Nuclear University MEPhI (Moscow Engineering Physics Institute)
3A.M. Prokhorov General Physics Institute, RAS, Moscow, Russia
Contents
3.1 Differential approximation
3.2 Calculation of macroscopic values
4.1 Slow heating (stationary regime)
4.3 Rapid heating and near-critical expansion regime
4.4 Rapid heating – regime of supercritical expansion
Abstract
In the framework of molecular dynamics the behavior of thin liquid film during its rapid homogeneous heating with heat input rate 2-100 K/ps is studied. The initial film thickness through the z axis is 48 nm. The overall number of particles is 96 000 and the length of calculation area is 268 nm. In the film plane periodic boundary conditions were used with the main dimension 8x8 nm. The calculation results are presented in a form of distributions of temperature, density and particle velocity in the calculation area averaged over the film plane and also in the form of two-dimension particle density distributions in the zx plane in the range of heating time from 0 to 800 ps. Visualization and analysis of the obtained results suggest the existence of four different regimes of film behavior depending on the heating rate: quasi-stationary regime with surface evaporation, explosive (volume) boiling, spinodal decomposition and overcritical expansion.
Keywords: molecular dynamics, thin film, volume heating, surface evaporation, explosive (volume) boiling, spinodal decomposition, visualization.
1. Introduction
A special place in the equations of state for various materials, which are actively explored for the past many years [1], is occupied by the critical region of the liquid-vapor phase transition. Under the equilibrium conditions, this region is characterized, in particular, by an increase in fluctuations and divergence of the specific heat, which is confirmed by numerous experiments for materials with relatively small values of the critical parameters [2-4]. However, for many substances, implementation of research in stationary equilibrium conditions is not possible because of the large values of the critical temperature Tc and pressure Pc, which, therefore, remain poorly defined. When using different pulse techniques, the condition of the investigated substance usually turns out to be non-equilibrium, in particular, in the region of two-phase metastable states [5]. There is a number of unsolved problems in this area, concerning the behavior of non-equilibrium states, in particular, the behavior of superheated liquid phase when the temperature reaches the limit of overheating. In such circumstances, even the question of whether, how and in what experiments the near-critical peculiarities under the near-critical unsteady nonequilibrium conditions may occur remains an open question. Theoretical analysis of these issues can now be carried out with the help of mathematical modeling in the framework of molecular - the dynamic approach, which describes the behavior of matter using atomistic models.
Atomistic models allow
us to conduct research in condensed, gas and plasma environments at the level
of elementary processes and are used in particular for the construction of the
kinetic theory of homogeneous melting and evaporation. The main difficulty of
the atomistic approach, along with the choice interparticle potential, is huge
dimension of the models, the number of equations being determined by the number
of the considered particles. For example, during the molecular-dynamic modeling
of the processes in the cubic domain of aluminum with the edge of L=0.1 ![]() (face-centered lattice
constant a = 0,405 nm), it is necessary to calculate the trajectories of a huge
number of particles estimated as
(face-centered lattice
constant a = 0,405 nm), it is necessary to calculate the trajectories of a huge
number of particles estimated as ![]() . Such a large number of equations on the one
hand is the main limitation of the spatial - temporal scale of the application
of the molecular-dynamic models (the current level of research operates with a
number of equations of the order of
. Such a large number of equations on the one
hand is the main limitation of the spatial - temporal scale of the application
of the molecular-dynamic models (the current level of research operates with a
number of equations of the order of ![]() ), on the other hand - there is an acute problem
of visualization of the modeling results.
), on the other hand - there is an acute problem
of visualization of the modeling results.
A huge amount of information and the need of space-time imaging of strongly unstable regimes of phase transformations of the type of phase explosion, spinodal decomposition of overheated metastable states, and so on, lead to the fact that the value of the obtained information in the molecular-dynamic problems to such a large extent depends on the method of visualization that it begins to act no longer as function display (construction) of images, but rather transforms into a full-fledged component of scientific research.
Molecular-dynamic approach is used in many papers, in particular, during the analysis of action of intense laser radiation on condensed matter [6-11]. However in these papers the role of surface evaporation was not investigated with necessary completeness. It should be emphasized that the process of non-equilibrium phase transition considerably depends on the conditions of its realization.
In this paper the behavior of a thin liquid film during its rapid homogeneous heating with the rate 2-100 K/ps is studied in the sub-nanosecond temporal range using molecular dynamics in order to find out the effect of surface evaporation on the peculiarities of the process of explosive disintegration of a strongly overheated film. Visualization of modeling results allows performing a detailed analysis of the behavior of unstable metastable states in the regions of their extreme nonequilibrium and subsequent disintegration.
2. Statement of the problem
As the object of investigation, we chose a liquid dielectric film with the thickness of 48 nm along the Z axis with the overall size of the region of calculation of 268 nm along that axis. The vapor particles were removed from the calculation upon reaching the boundaries of this area (reflectionless permeable border). The dimensions of the calculation area along the X, Y axes were equal to 8 nm with periodic boundary conditions. The total number of particles at the initial moment of time was 96000. The mass of the particles corresponded to the mass of the aluminum atom. The presence of the electron subsystem was not explicitly taken into account, and the thermal conductivity of the system was determined by the interaction of heavy particles. The critical parameters for this system were: Tc = 7600 K, Pc = 1.4 kbar, ρs = 0.48 g/cm3.
2.1. Mathematical model
The molecular dynamics approach (MD) is based on a model concept about the many-body (atomic and molecular) system, in which all particles are material points, the movement of which is described in the classic case by the Newton's equations.
The mathematical model consists of a system of differential
equations, the number of which is equal to twice the number 2N of the
particles, the interatomic interaction potential ![]() , the specifically defined initial and boundary
conditions:
, the specifically defined initial and boundary
conditions:
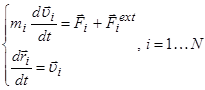 ,
(1)
,
(1)
where ![]() are
the mass, radius-vector and velocity correspondingly; the potential energy of
interaction of a system of
are
the mass, radius-vector and velocity correspondingly; the potential energy of
interaction of a system of ![]() particles
particles ![]() ;
; ![]() - the interaction force,
- the interaction force, ![]() - the external forces.
- the external forces.
2.2. Initial conditions
To solve the system of equations (1), it is necessary to
know the coordinates and velocities ![]() of all
of all ![]() particles at the initial time t = 0.
During the simulation of the processes in condensed matter, the medium under
consideration at the initial time can be a crystal, polycrystalline or, as in
this study, liquid.
particles at the initial time t = 0.
During the simulation of the processes in condensed matter, the medium under
consideration at the initial time can be a crystal, polycrystalline or, as in
this study, liquid.
To set the initial values of the macroscopic parameters more accurately, as well as to provide a steady state in the system, we carry out a relaxation of the modeled object after setting the coordinates and velocities. To simulate liquid, it may be difficult to define the positions and velocities of the particles perfectly balanced by the kinetic and potential energies. This leads to undesired acoustic vibration. For their effective suppression, the original system of equations (1) is added by a friction term:
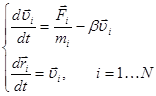 .
(2)
.
(2)
The combined use of friction and thermostat that returns the energy to the stochastic component of the particle motion to hold the desired temperature, allows us to quickly bring the system to a steady state.
Furthermore, the pressure (tension) in the system during the relaxation may also be set to a desired level for the further simulation using a barostat.
2.3. Boundary conditions
The system (2) is a system of ordinary differential equations. Only the initial conditions are required to solve the problem. The boundary conditions are absent. However, during modeling of objects formed by a system of particles, there are often additional requirements that can be met by imposition of conditions on the boundaries of the object.
Thus, when considering the processes in a thin film with
thickness H and infinite in the directions X and Y,
modeling is performed in a finite computational region with dimensions ![]() along the axes, which
comprises a portion of the plate
along the axes, which
comprises a portion of the plate![]() . To simulate the interaction with the part that
is not included in the computational domain, periodic boundary conditions are
used along the axes X and Y with the periods
. To simulate the interaction with the part that
is not included in the computational domain, periodic boundary conditions are
used along the axes X and Y with the periods![]() ,
,![]() respectively.
respectively.
Periodic boundary conditions in x imply that the particles
with the coordinate x in the range![]() reproduce the particles within
reproduce the particles within ![]() for any integer
for any integer![]() . That is, the particle leaving the
computational domain through the upper boundary is replaced by a particle with
the same velocity value, but entering the computational domain through the
lower boundary.
. That is, the particle leaving the
computational domain through the upper boundary is replaced by a particle with
the same velocity value, but entering the computational domain through the
lower boundary.
The second important aspect of periodic boundary conditions
describes the force and the potential energy of interaction of particles from
the boundary areas6 ![]() ,
,![]() where
where ![]() is the cutoff radius of the potential (it is
assumed that the forces acting at the distances
is the cutoff radius of the potential (it is
assumed that the forces acting at the distances![]() can be ignored). Interaction of the particle i,
with the coordinate
can be ignored). Interaction of the particle i,
with the coordinate ![]() being
in the range of
being
in the range of ![]() with
the particles outside the computational domain,
with
the particles outside the computational domain, ![]() , is modeled using the particles from the range
of
, is modeled using the particles from the range
of ![]() from the
computational domain, which radius-vectors are corrected in the following way
during the computation of the force
from the
computational domain, which radius-vectors are corrected in the following way
during the computation of the force ![]() :
:
![]() ,
,
where ![]() is
the unit vector of the axis X.
is
the unit vector of the axis X.
Obviously, all above is equally applied to the periodic boundary conditions along the coordinate axis Y.
The question of the error introduced by the periodic boundary conditions is associated with the distortion introduced in the damping of the phonon modes in the crystal. Obviously, increasing the distance between the boundaries reduces the effect on the spectrum of the phonon modes.
2.4 Interaction potential
As the interaction potential we used the potential of the “embedded atom” (Embedded Atom Model - EAM) [12, 13], which made a good account of itself for the materials with a metallic bond. The contribution to the energy of randomly arranged nuclei from the interaction with the electrons, according to the quantum mechanical density functional theory, can be written as a unique functional of the total electron density (embedded functional). In this case, the total electron density in the metal is a linear superposition of the contributions of individual atoms, and the electron density that is created by a single atom is spherically symmetric. Thus, the total energy of the system consists of two components - the energy of the pair interaction of atoms and the interaction energy of each atom with an electron density produced by other atoms:
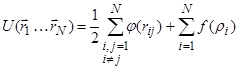 ,
,
where ![]() is
the pair potential,
is
the pair potential, ![]() is
the embedded functional of i-th atom,
is
the embedded functional of i-th atom, ![]() is the total electron density for the i-th
atom, produced by spherically-symmetric functions of single electron density
is the total electron density for the i-th
atom, produced by spherically-symmetric functions of single electron density ![]() of other atoms.
of other atoms.
In this problem, we used as the potential one of the semi-empirical “embedded-atom” potentials given in [14]. A polynomial relationship was used in [14] as the pair part:
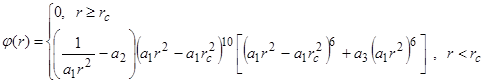
Analytical expressions were used for the embedded function and single-electron density:
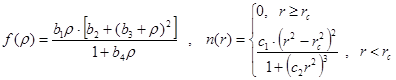
where ![]() nm
is the cut-off radius of the potential,
nm
is the cut-off radius of the potential, ![]() -
- ![]() ,
, ![]() -
- ![]() ,
, ![]() -
- ![]() are the fitting constants.
are the fitting constants.
The parametrization of the potential was carried out based on mechanical characteristics of aluminum. To estimate its applicability to the solution of thermal problems, the calculation results obtained with it, were compared with the actual thermal characteristics, such as melting point, specific heat of fusion, heat capacity, thermal expansion coefficient [15].
3. Computational algorithm
3.1 Differential approximation
As the best compromise between the computational efficiency and requirements of accuracy and stability, Verlet algorithm [16] is widely used in molecular dynamics simulation12 in its most convenient, so-called velocity form. The further proposed its modification comprises, unlike the original, additional friction. For the system of equations (2) with viscosity one can write the following finite-difference approximation:
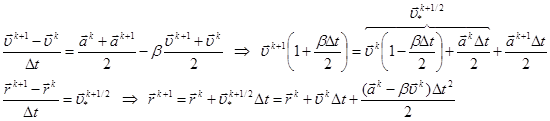
Here upper index k is the number of time step, ![]() is the acceleration,
index i (part number) is omitted. Determination of intermediate velocity
in the half-integer moment of time:
is the acceleration,
index i (part number) is omitted. Determination of intermediate velocity
in the half-integer moment of time:
![]()
is equivalent to the differential approximation:
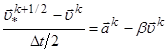 .
.
As a result, the computational algorithm of Verlet in the
velocity form for the system (2) with the viscosity is formulated as follows. Assuming
that all the relevant values are known at the time![]() , the transition to the next point in time
, the transition to the next point in time ![]() is calculated as:
is calculated as:
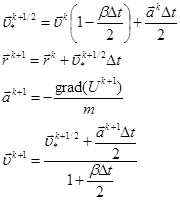 (3)
(3)
The scheme of Verlet is not conservative in the sense of the exact realization of the law of conservation of energy in the differential form. However, statistically, for a particle system this law holds quite well.
3.2 Calculation of macroscopic values
Local thermodynamic equilibrium is quickly established during the molecular dynamics modeling of condensed matter. Thus, the typical time of the local equilibrium distribution of aluminum in the crystal is a few picoseconds. Accordingly, by using the averaging procedure6 we determine the basic thermodynamic quantities - the pressure (stress in the crystal) and temperature as well as the velocity and density. For the purpose of the spatial averaging, the entire set of atoms under consideration was divided into cells, where the averaging of stochastic components was performed.
We note that this formulation of the problem for the study of the evaporation process of the dielectric liquid (water) film was used in [17], but in the absence of volume (explosive) boiling.
The methods of calculation used in this paper are described in detail in [15]. The initial state of the film before its heating corresponded to equilibrium with saturated vapor at the temperature of 6400 K. The expansion of vapor was limited to a pair of impermeable reflecting walls, which were set at the distance of 22 nm from the left and right surfaces of the film. At t ≥ 0, the film was subjected to heating at the rate of 2-100 K / ps, which was carried out by a corresponding increase in the kinetic energy of the particles [18].
4. Results and discussion
4.1 Slow heating (stationary regime)
It is obvious that at a sufficiently slow heating the film can evolve from the initial state to a stationary evaporation regime with the balance between of supplied energy and the evaporation energy loss that depends in particular on the film dimensions.
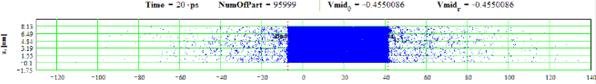
For such a regime with the heating rate 2 K/ps the calculation results are presented in Fig. 1-8. In Fig. 1a-1b the initial distributions of temperature, density and particle velocity at the t = 0 when the film is in equilibrium with its saturated vapor at temperature 6400 K are presented. It is clearly seen from Fig. 1 that the density value of saturated vapor is approximately 0.04 g/cm3 as compared with film density 1.3 g/cm3. The initial film thickness was 48 nm, the length of the area with saturated vapor was 22 nm from each side.
After the boundaries are opened and heating is started at t > 0 the vapor density and its temperature decrease and become non-homogeneous due to expansion (Fig. 2, t = 10 ps) and the film surface temperature also begins to decrease due to evaporation (Fig. 2, 5-6).
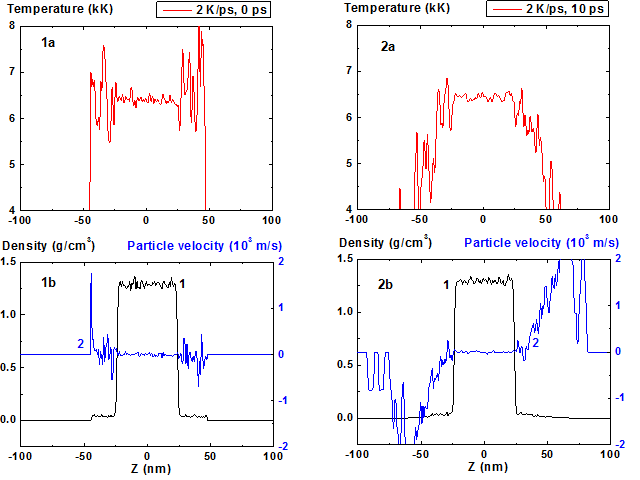
Figures 1-2: Spatial distributions of temperature (1a-2a), density (1b-2b, curve 1) and particle velocity (1b-2b, curve 2) through the film at moments 0, 10 ps during heating with 2 K/ps rate.
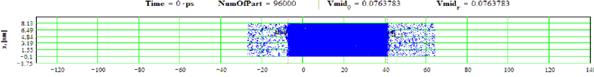
Figures 3-4: Spatial distributions of film particles at time moments 0, 10 ps during heating with 2 K/ps rate
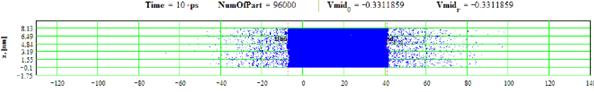
Figures 5-6: Spatial distributions of temperature (5a-6a),
density (5b-6b, curve 1) and particle velocity (5b-6b, curve 2) through the
film at moments 310, 800 ps during heating with 2 K/ps rate. Animation 2 K/ps ![]()

Figures 7-8: Spatial distributions of film particles at time moments 310, 800 ps during heating with 2 K/ps rate
At first, a small decrease of bulk temperature is observed which is seemingly induced by additional film expansion due to decrease of external pressure that becomes lower than the saturation pressure for given surface temperature. Vapor particles velocity at the film boundary initially has the low value that corresponds to the regime of expansion of initial layer of saturated vapor. With time the particle velocity amplitude at the film surface increases that is typical for beginning of intense evaporation.
As a result a quasi-stationary convex temperature profile and corresponding (according to equation of state) concave density profile are formed (Fig. 5-6).
Film temperature maximum at the time moment t > 200 ps sets up at level ~ 6800 K ~ 0.9 Tc, where TC ~ 7600 K – critical temperature, and practically does not change through subsequent 500 ps as it is seen from Figure 5a-6a.
Fluctuations of density and temperature in the condensed phase are relatively small. It should be mentioned that the energy transfer to the particles is realized only when the density is greater than 0.3 of current spatial maximum density.
Parameters of such quasi-stationary regime of evaporation in the simplest approximation can be analytically determined supposing quadratic distribution of temperature over the film with maximum in the central part. Results of such analytical estimation will be presented elsewhere.
The considered case of quasi-stationary state has limited existence time not only due to the limited film thickness and its evaporation. The film is in an overheated metastable state which temperature is greater than the temperature of phase equilibrium (binodal) for given pressure and density is lower than equilibrium value. In such state there is a finite possibility of formation of growing hetero-phase fluctuations that emerge due to spontaneous homogeneous nucleation of new (vapor) phase seeds. The waiting time of such fluctuations rapidly decreases when Tm approaches the temperature of ultimate overheating (spinodal)13.
4.2 Explosive boiling regime
At the heating rate of 4 K/ps from the same initial state up to the time moment t = 240 ps (Fig. 9, 11) the film behavior differs but slightly from the previous case and the achieved temperature maximum is about 7000 K that is ~ 200 K higher than the previous value.
Than, however, instead of continuation of quasi-stationary regime the process of explosive boiling i.e. rapid local decrease of density and formation of vapor cavity inside the film localized near the maximum of temperature profile (Figure 10, 12, 13-16) starts. The cavity formation process is accompanied by local decrease of temperature at the area of its previous maximum.
The maximum temperature value at which the process of explosive boiling starts exceeds its value in quasi-stationary regime only by a small amount T ~ 10-2 Tc that indicates sharp enough temperature limit of the start of the explosive boiling process in nanosecond range of its anticipation13.
The sharp temperature dependence of explosion anticipation time is already known for a long time (V.P. Skripov). In the framework of molecular dynamics with usage of NPT ensemble this dependence was studied for example in14. However such approach doesn’t give the possibility to observe the peculiarities of the decomposition process connected with the existence of surface evaporation which plays a considerable role in this case.
The increase of density fluctuations in comparison with previous regime is seen even at Fig. 9 (t = 240 ps) and at the time moment t = 300 ps (Fig. 13) the minimum value of density in the film center approaches the critical value of density 0.47 g/cm3. At the same time the temperature decrease in the area of temperature maximum due to beginning of process of evaporation into the cavity is already seen. It should be noted that this local minimum can be connected with the relative increase of heat capacity of condensed phase Cp when temperature approaches the limit of ultimate overheating.
The further cavity growth and fragments movement are determined by the vapor pressure difference between the fragments and outside them. The vapor density inside the cavity is noticeably higher than the density outside the fragments as it is seen at the density distribution curve at Fig. 14.
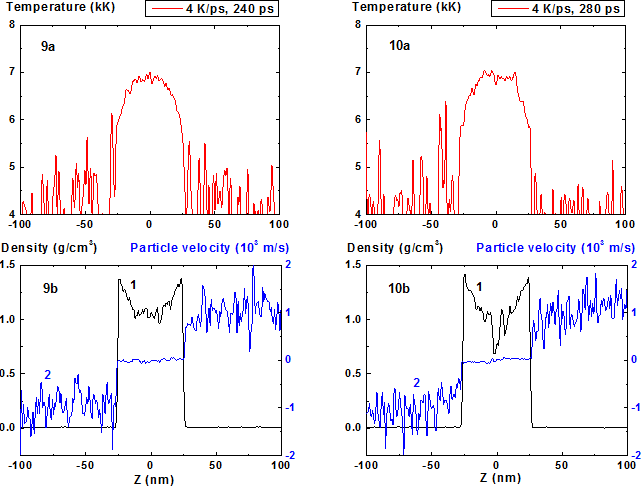
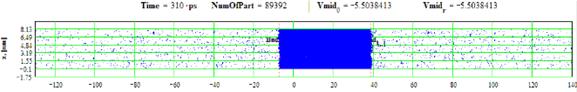
Figures 9-10: Spatial distributions of temperature (9a-10a), density (9b-10b, curve 1) and particle velocity (9b-10b, curve 2) through the film at moments 240, 280 ps during heating with 4 K/ps rate.
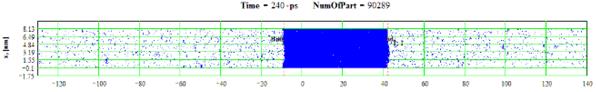

Figures 11-12: Spatial distributions of film particles at time moments 240, 280 ps during heating with 4 K/ps rate
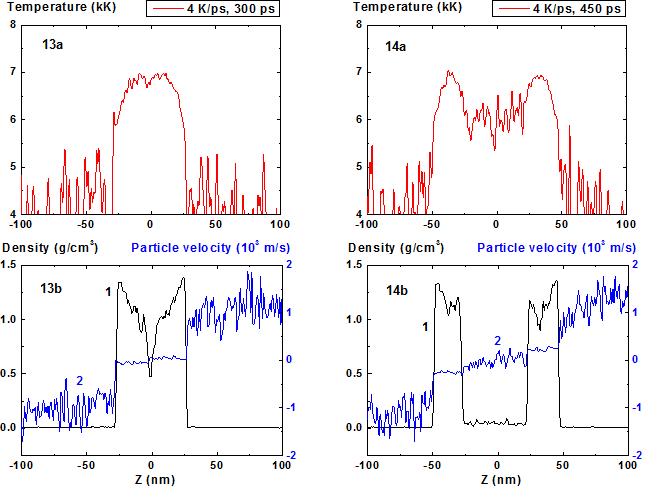
Figures: 13-14 Spatial distributions of temperature
(13a-14a), density (13b-14b, curve 1) and particle velocity (13b-14b, curve 2)
through the film at moments 300, 450 ps during heating with 4 K/ps rate. 4 K/ps ![]()
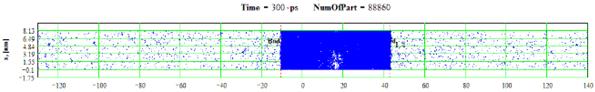
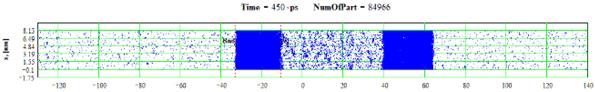
Figures 15-16: Spatial distributions of film particles at time moments 300, 450 ps during heating with 4 K/ps rate
|
Figure 17: Velocity vs time for right (1) and left (2) fragments of the expanding film for hearting rate 4K/ps |
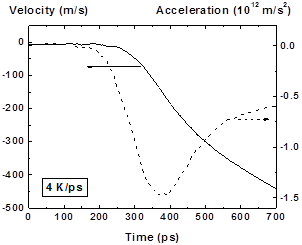
Figure 18: Velocity (solid line) and acceleration (dashed line) vs time of left (2) fragment at hearting rate 4K/ps |
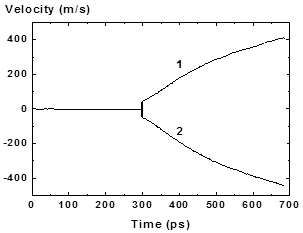
The temporal dependence of fragments velocity after t = 300 ps is shown in Fig. 17. The fragments velocities differ slightly due to difference in its mass (or thickness h). More massive right fragment with thickness h2 = 25 (at t = 450 ps) nm moves slowly than left with h1 = 21 nm (at t = 450 ps). According to the momentum conservation law the values of velocities and fragments thicknesses are related by v1h1 = v2h2 in the center mass system which coincides with the laboratory system.
The behavior of fragments velocity (acceleration) at the initial moment of cavity formation contains information about value of pressure that develops in this explosive boiling process. According to the Newton’s law there is relation between the fragment acceleration and the resulting pressure P acting on it which is equal to the pressure difference between the inner and outer fragment’s border P = aρh, where a, ρ, h – fragment acceleration, thickness, and density correspondingly. The quantitative determination of initial (maximal) acceleration using numerical data on fragments movement is difficult due to low precision of such procedure.
In Fig. 18 the behavior of displacement, velocity and acceleration of outer boundary of left fragment are shown. The maximum absolute value of acceleration is ~ 1.5∙1012 m/s2 that corresponds to the maximum pressure Pm = aρh + P0 ~ 500 atm, where ρ = 1.2 g/cm3, h = 23 nm, P0 ~ 100 atm – pressure at the outer boarder of the fragment. The pressure value obtained in MD calculation also leads to significant space-temporal fluctuations of this value and its averaged value is also about 500 atm that is ~ 0.35 Pc, where Pc ~ 1420 atm – critical pressure. The saturation pressure for the film temperature T = 7000 K is about 840 atm that is greater than the obtained maximum pressure value.
Acceleration rise time (~ 100 ps) is determined by the pressure growth in the forming cavity due to phase explosion. This cavity formation process in the given time range is shown in 2D in Fig. 15-16. It should be noted that the pressure rise time during phase explosion is not much greater than the time of the sound round-trip over the fragment, i.e. hyper-sound vibrations can be induced in the expanding fragments as a result of such process.
Explosive boiling is a strong non-equilibrium process when fluctuations rapidly grow in metastable (non-equilibrium) state of overheated liquid. This process is stochastical in nature and its behavior is not determined only by average values of thermo-dynamical parameters. According to this fact for the same heating rate 4 K/ps due to fluctuation differences in initial state not one but two cavities can be formed as a result of phase explosion divided approximately in the middle by a thin (~ 5 nm) film of condensed phase. This difference is seen at 2D images of density distribution (Fig. 19-20)
Figures 19-20: Spatial distributions of film particles at time moments 300, 450 ps during heating with 4 K/ps rate (another ititial conditions)
4.3 Rapid heating and near-critical expansion regime
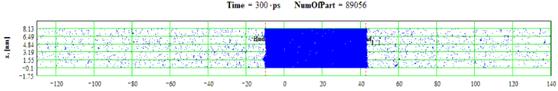
Increase of the heating rate up to 8 K/ps leads to a more complex multiply connected density distribution in the expanding film (Fig. 21-30). The moment of the start of film disintegration (180 ps) at T = 7000 K when fluctuated density approaches value 0.7 g/cm3 is shifted to more earlier times in comparison with the start of the film decomposition onto two fragments (300 ps for the heating rate 4 K/ps).
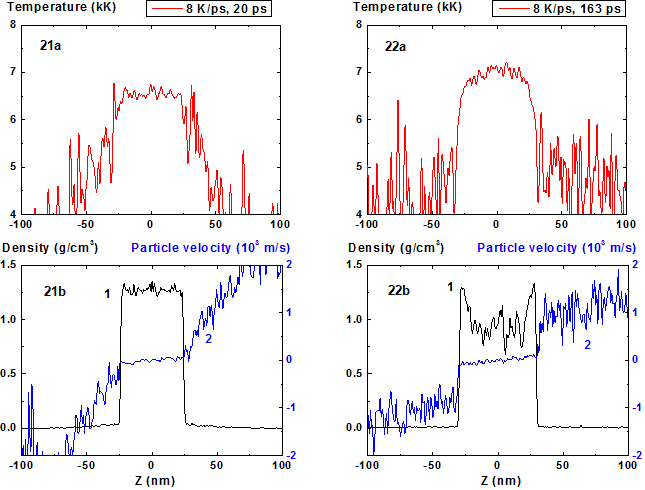
Figures 21-22: Spatial distributions of temperature
(21a-22a), density (21b-22b, curve 1) and particle velocity (21b-22b, curve 2)
through the film at moments 20, 163 ps during heating with 8 K/ps rate. 8 K/ps ![]()
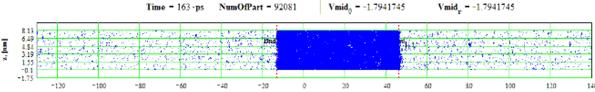
Figures 23-24: Spatial distributions of film particles at time moments 20, 163 ps during heating with 8 K/ps rate
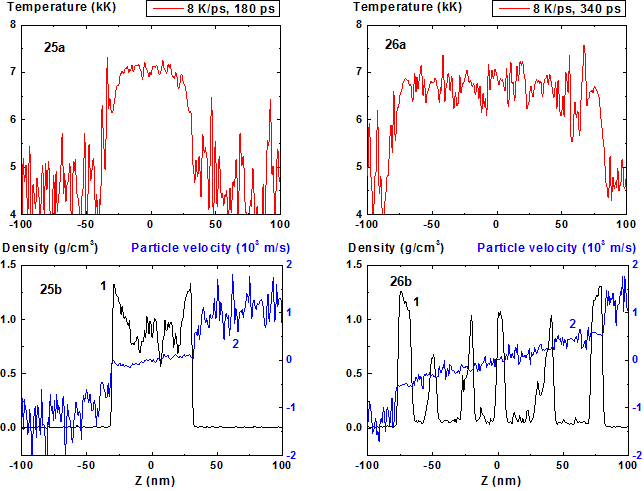
Figures 25-26: Spatial distributions of temperature
(25a-26a), density (25b-26b, curve 1) and particle velocity (25b-26b, curve 2)
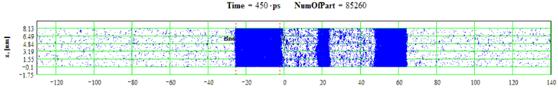
through the film at moments 180, 340 ps during heating with 8 K/ps rate. 8 K/ps ![]()
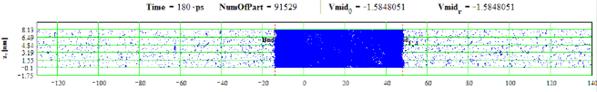
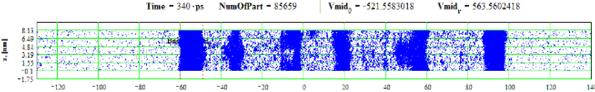
Figures 27-28: Spatial distributions of film particles at time moments 180, 340 ps during heating with 8 K/ps rate
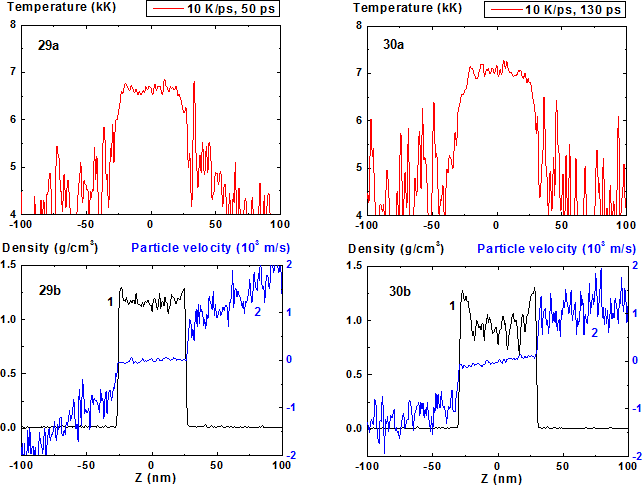
Figures 29-30: Spatial distributions of temperature (29a-30a), density (29b-30b, curve 1) and particle velocity (29b-30b, curve 2) through the film at moments 50, 130 ps during heating with 10 K/ps rate.
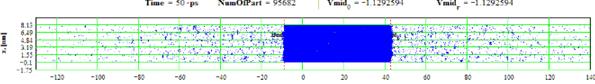

Figures 31-32: Spatial distributions of film particles at time moments 50, 130 ps during heating with 10 K/ps rate
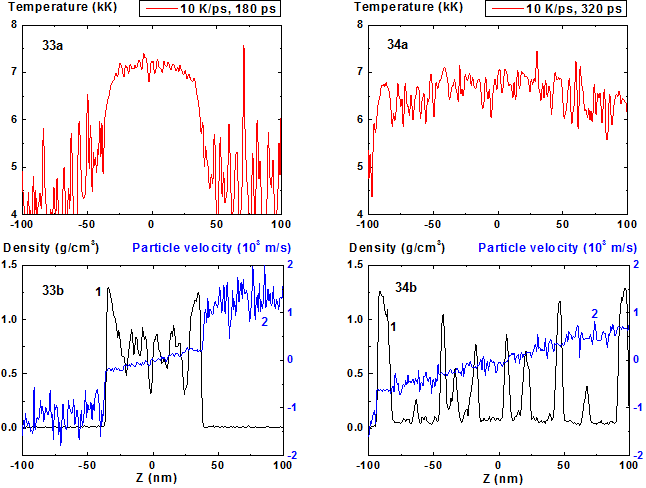
Figures 33-34: Spatial distributions of temperature (33a-34a),
density (33b-34b, curve 1) and particle velocity(33b-34b, curve 2) through the
film at moments 180, 320 ps during heating with 10 K/ps rate. 10 K/ps ![]()
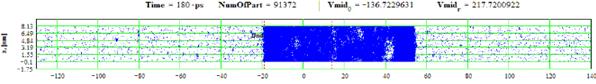
Figures 35-36: Spatial distributions of film particles at time moments 180, 320 ps during heating with 10 K/ps rate
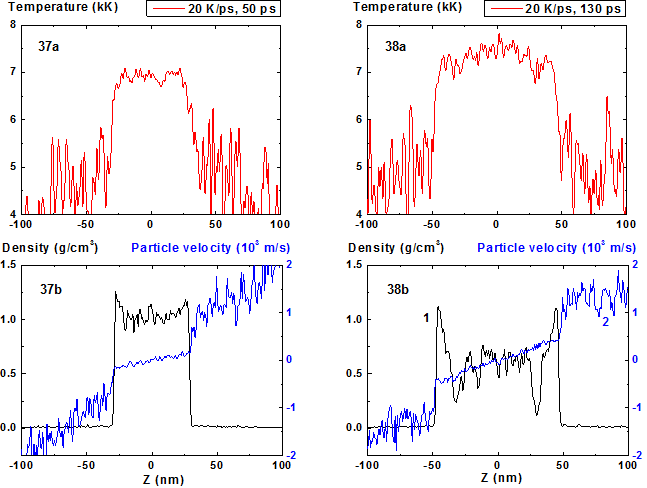
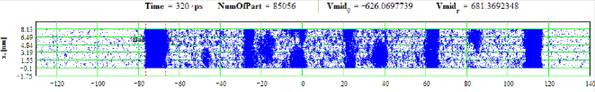
Fig.37-38: Spatial distributions of temperature (37a-38a), density (37b-38b, curve 1) and particle velocity (37b-38b, curve 2) through the film at moments 50, 130 ps during heating with 20 K/ps rate.
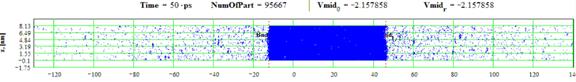
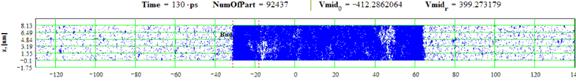
Figures 39-40: Spatial distributions of film particles at time moments 50, 130 ps during heating with 20 K/ps rate
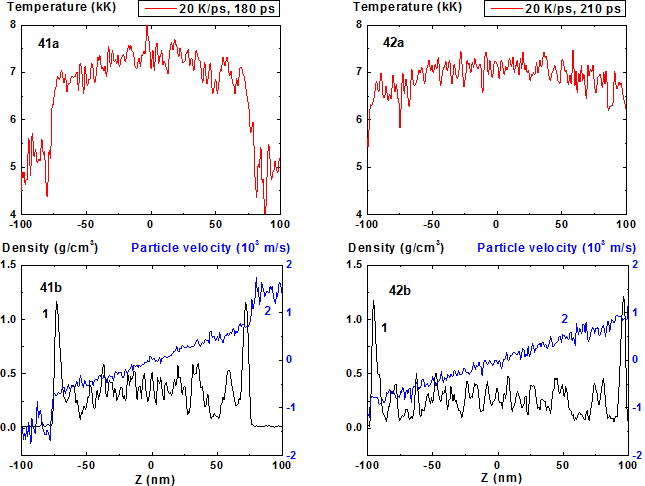
Figures 41-42: Spatial distributions of temperature
(41a-42a), density (41b-42b, curve 1) and particle velocity (41b-42b, curve 2)
through the film at moments 180, 210 ps during heating with 20 K/ps rate. 20 K/ps ![]()
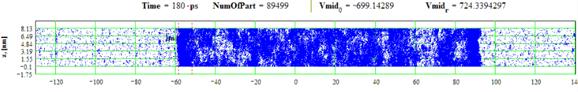
Figures 43-44: Spatial distributions of film particles at time moments 180, 210 ps during heating with 20 K/ps rate
It should be also noted that concave density distribution in the film becomes more wider during transition from 4 K/ps to 8 K/ps due to increase of large amplitude fluctuations number. As a result of such fluctuation widening the film decomposes onto six fragments (Fig. 21-28) instead of two (or three) at 4 K/ps.
Such film widening before its decomposition in fact means the decrease of its average density with temperature increase and this value of density as it was already mentioned before is lower than the equilibrium value due to metastable overheated state of the film. The decrease of density becomes more pronounced as it approaches the critical point. Such change of the film evolution parameters in this area is illustrated by data for the heating rate 10 K/ps presented at Fig. 29 - 36.
From the comparison of Fig. 25 and Fig. 33 that correspond to the same moment of time 180 ps from the start of the heating it is seen that the mean film thickness in the latter case is significantly larger than in the first one (over 30%) and is ~ 70 nm. In this case such evolution leads to film decomposition onto considerably more number of fragments than for heating rate 8 K/ps.
For 20 K/ps (Fig. 37-44) the density fluctuations amplitude becomes greater and instead of the collection of individual fragments of the condensed phase with steam interlayers (that can be seen at Fig. 34) one can observe vapor-drops mixture with diffuse inter-phase boundaries that is typical for the process of spinodal decomposition.
The evolution of film disintegration regimes at the stage of explosive boiling before spinodal decomposition is illustrated by 2D images presented at Fig. 39-40, 43-44. From this figures it is seen how the structure of the film fragments transforms when the heating rate changes from 4 to 20 K/ps. In this range the number of fragments grows and its vertical components cease to be explicitly evident, except two external fragments.
4.4 Rapid heating – regime of supercritical expansion
It is obvious that at further increase of the heating rate, beginning with some of the rate values, the density fluctuations amplitude in the process of film disintegration will decrease due to increase of the its number. Such regime in fact corresponds to expansion of dense non-ideal fluid because the stages described above (explosive boiling and spinodal decomposition) do not have time to develop in the process of rapid heating. Increasing of the internal pressure in the film, which does not have time to fully relax during heating also contributes to suppression of these stages.
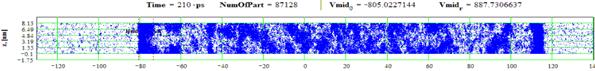
In Fig. 45-52 the process of film disintegration at heating rate 40 K/ps is shown. If in the case of 10 K/ps the expansion stage becomes pronounced at times greater than 130 ps, while in the case of 40 K/ps this stage i.e. the increase of the film thickness due to density decrease and deviation of particles velocity distribution inside it from horizontal form is clear pronounced even at t = 40 ps. In this case (t = 40 ps) the film thickness h = 63 nm is significantly greater than its initial value h = 48 nm.
Figures 45-46: Spatial distributions of temperature (45a-46a), density (45b-46b, curve 1) and particle velocity (45b-46b, curve 2) through the film at moments 40, 60 ps during heating with 40 K/ps rate.
Figures 47-48: Spatial distributions of film particles at time moments 40, 60 ps during heating with 40 K/ps rate
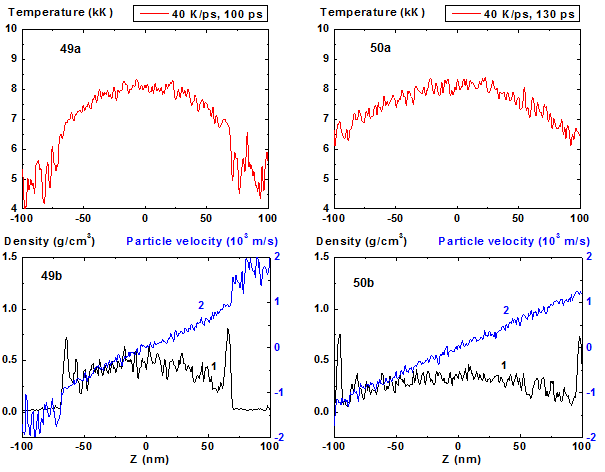
Figures 49-50: Spatial distributions of temperature
(49a-50a), density (49b-50b, curve 1) and particle velocity (49b-50b, curve 2)
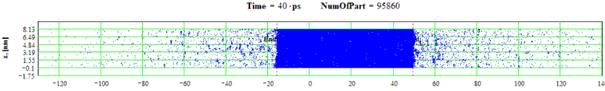
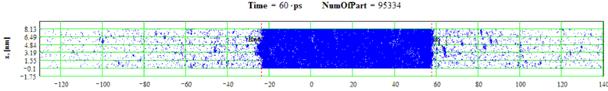
through the film at moments 100, 130 ps during heating with 40 K/ps rate. 40 K/ps ![]()
Figures 51-52: Spatial distributions of film particles at time moments 100, 130 ps during heating with 40 K/ps rate
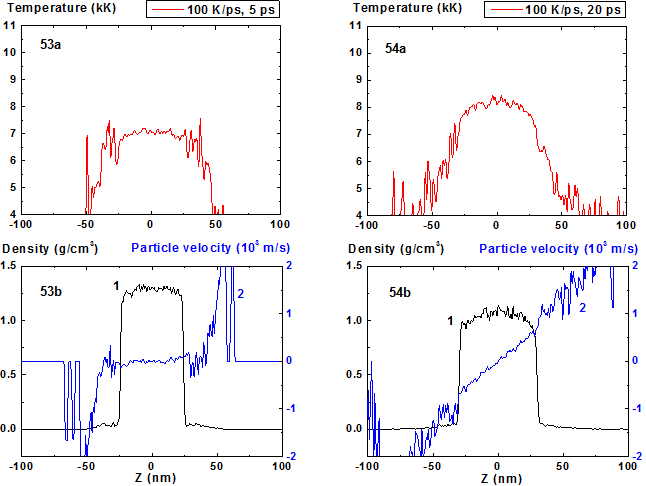
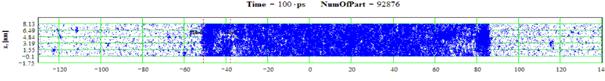
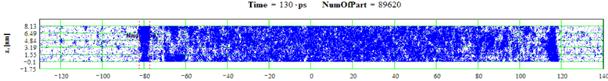
Figures 53-54: Spatial distributions of temperature (53a-54a), density (53b-54b, curve 1) and particle velocity (53b-54b, curve 2) through the film at moments 5, 20 ps during heating with 100 K/ps rate.

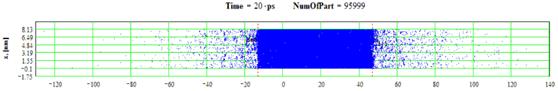
Figures 55-56: Spatial distributions of film particles at time moments 5, 20 ps during heating with 100 K/ps rate
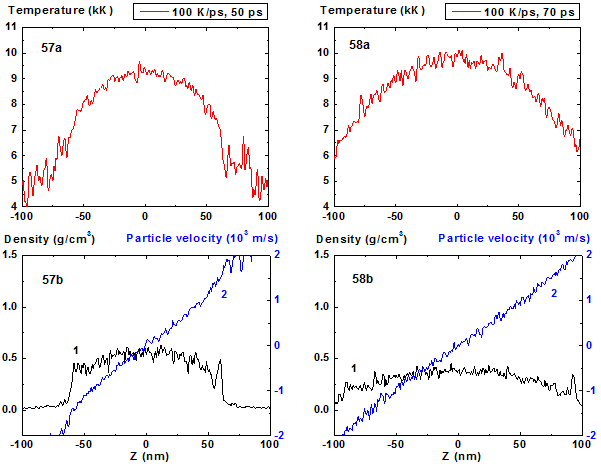
Figures 57-58: Spatial distributions of temperature
(57a-58a), density (57b-58b, curve 1) and particle velocity (57b-58b, curve 2)
through the film at moments 50, 70 ps during heating with 100 K/ps rate. 100 K/ps ![]()
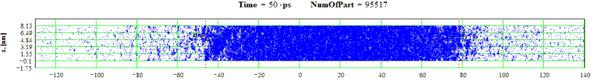
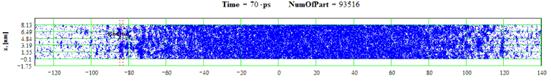
Figures 59-60: Spatial distributions of film particles at time moments 50, 70 ps during heating with 100 K/ps rate
In comparison with cases of 8, 10 and 20 K/ps heating rates the density fluctuations are relatively small for all of the process except the stage where the mean density is smaller than 0.5 g/cm3. At this final stage of expansion at the film borders the areas of high density are formed that are clear seen in Fig. 41 as a typical boundary peaks that is also observed in the range of smaller values of heating rate where the concave density profile inside the film is clearly pronounced [19,20]. For 100 K/ps this boundary peaks are absent i.e. the influence of surface evaporation on density distribution in this regime of heating practically disappears. Such density behavior is also demonstrated in 2D images of density distribution (Fig. 55-56, 59-60).
For heating rates 40 and 100 K/ps density profile is not concave through all stage of heating. From the initial flat profile it converts to convex form which corresponds to the non-horizontal particle velocity profile of the film that is typical for its expansion state with overcritical temperature. It should be noted that the film temperature at heating rate 100 K/ps exceeds the critical one even at t = 5 ps and the pressure value in the film center at this moment is also greater than the critical value.
5. Conclusions
The results of the present research allow making a conclusion about existence of four different regimes of the film behavior.
At relatively low heating rates of 2 K/ps, the evolution of the film is observed in the time range of 0.8 ns from the initial equilibrium state at the temperature of 6400 K to the regime of quasi-stationary surface evaporation, in which the losses via evaporation are compensated by the absorbed energy and the temperature maximum in the center of the film is stabilized around 6800 K.
When the heating rate is increased to 4 K/ps, at the time t ~ 280 ns after the start of heating, when the maximum temperature in the film reaches values of ~ 7000 K, the explosive boiling process starts, during which a vapor cavity with sharp edges is formed in the center of the film. Depending on the fluctuations, two adjacent cavities separated by a thin (18 nm) layer of a condensed phase may appear in the initial state of the film instead of a single cavity structure.
The next regime of phase transformation of the film is located approximately in the range from 8 to 20 K/ps. In this range, as the heating rate increases, there is an increase in the amplitude of density fluctuations before the splitting of the film into the growing number of domains of the vapor and condensed phase, the boundaries between which are becoming less sharp, which is typical for the regime of spinodal decomposition. On the upper end of this range, the number of large-scale fluctuations in the density decreases.
The range 40-100 K/ps corresponds to the transition to the supercritical regime of the expansion of the heated film, in which the density fluctuations that are typical of the two-phase region of states, in fact are no longer observed. While at 40 K/ps, the original surfaces of the film during its expansion still have local density maximums associated with the influence of surface evaporation, at 100 K/ps, this effect no longer has time to manifest itself.
A more detailed description of these regimes is possible when analyzing the behavior of the average values and the fluctuations in the characteristics of the film versus time, the heating rate and other conditions of realization of the process of nonequilibrium phase transformation.
The work was partially supported by RFBR grant №13-02-01129a, №13-07-00597, № 15-07-05025.
REFERENCES
- Fortov V E, Lomonosov I V “Ya.B. Zeldovich and equation of state problems for matter under extreme conditions” Phys. Usp., 2014, 57, pp. 219–233
- A.Anisimov. Kriticheskie yavleniia v zhidkostiah i zhidkih kristalah[Critical phenomena in liquids and liquid crystals]. Moskva, Nauka [Science], 1978, 271 p.
- Shang-Keng Ma. Modern Theory of Critical Phenomena. Benjamin, New York, 1976. Perseus, 2000, p. 561.
- H.E.Stanley. Introduction to Phase Transitions and Critical Phenomena Oxford University Press, Oxford and New York 1971.
- V.P.Skripov. Metastable liquids. Wiley, 1974
- L.V. Zhigilei, Z. Lin and D.S. Ivanov, “Atomistic modeling of short pulse laser ablation of metals: connections between melting, spallation, and phase explosion”, J. Phys. Chem. C, 2009, v.113, pp.11892-11906.
- C.Wu, L.V. Zhigilei. Microscopic mechanisms of laser spallation and ablation of metal targets from large-scale molecular dynamics simulations Appl. Phys. A, 2014, v. 114, pp.11-32.
- L. Zhang, X.Wang. Hybrid atomistic-macroscale modeling of long-time phase change in nanosecond laser–material interaction. Applied Surface Science, vol. 255, Issue 5, Part 2, pp.3097–3103.
- P.Lorazo, L.J.Lewis, M.Meunier, Thermodynamic pathways to melting, ablation, and solidification in absorbing solids under pulsed laser irradiation. Physical Review B, 2006, v.73, pp.134108.
- S.I. Anisimov, V.V. Zhakhovskii, N.A. Inogamov, K. Nishihara, A.M. Oparin and Yu.V. Petrov, “Destruction of a solid film under the action of ultrashort laser pulse”. 2003, JETP Lett., v.77, pp.606-610.
- G.E.Norman, S.V.Strarikov, V.V. Stegailov, Atomistic simulation of laser ablation of gold: effect of pressure relaxation. 2012, JETP, 114, pp.792-800.
- M.S. Daw amd M.I. Baskes, Embedded-atom method: Derivation and application to impurities and other defects in metals, Phys. Rev. B, 29, 6443-6453 (1984).
- S.M. Foiles, M.I. Baskes and M.S. Daw, Embedded-atom-method functions for the fcc metals Cu, Ag, Au, Ni, Pd, Pt, and their alloys. Phys. Rev. B, 33, 7983-7991, (1986).
- V.V. Zhakhovskii, N.A. Inogamov, Yu.V. Petrov, S.I. Ashitkov and K. Nishihara. Two-temperature relaxation and melting after absorption of femtosecond laser pulse. Appl. Surf. Sci., 2009, vol. 255, hh. 9592-9596.
- V.I.Mazhukin, A.V.Shapranov, V.E.Perezhigin. Matematicheskoe modelirovanie teplofizicheskih svoystv, processov nagreva i plavleniia metallov metodom molekuliarnoy dinamiki. Mathematica Montisnigri, 2012, vol. 24, pp. 47 – 66.
- L.Verlet. Computer “experiments on classical fluids. I. Thermodynamical properties of Lennard-Jones molecules, Phys. Rev., 1967, vol. 159, pp. 98-103.
- T.H. Yang and C. Pan. Molecular dynamics simulation of a thin water layer evaporation and evaporation coefficient. Int. Journ. of Heat and Mass Transfer, 2005, v. 48, pp. 3516-3526.
- V.I. Mazhukin, A.V. Shapranov, A.A. Samokhin, A.Yu. Ivochkin Mathematical modeling of non-equilibrium phase transition in rapidly heated thin liquid film. Mathematica Montesnigri, 2013, v. 27, pp. 65 - 90.
- V.I.Mazhukin, A.V.Shapranov, A.A.Samokhin, A.Yu.Ivochkin. Modelirovanie vzryvnogo vskipaniia tonkoy plenki pri odnorodnom subnanosekundnom nagpeve [MODELING OF THIN FILM EXPLOSIVE BOILING PROCESS DURING HOMOGENEOUS SUB-SECOND HEATING]. Matematicheskoe modelirovanie. 2014, vol. 26, №3, pp. 125-136.
- V.I.Mazhukin, A.V.Shapranov, A.A.Samokhin, A.Yu.Ivochkin. Modeling the Thin Film Explosive Boiling Process in a Homogeneous Sub-Nanosecond Heating. Mathematical Models and Computer Simulations, 2014, Vol. 6, No. 5, pp. 542–550.