Visual models’ system of project management
Kolychev V.D., Rumyantsev V.P.
VDKolychev@mephi.ru, VPRumyantsev@mephi.ru
National Research Nuclear University MEPhI (Moscow Engineering Physics Institute), Russia
Contents
2. The method of project management visual tasks solving
3. Structural models of project management and their visual representation
4. Graphical models of structural transformations of projects
5. Visual modeling of the numeric parameters of the project
6. Visualization of resource calendar planning of interruptible and uninterruptible operations
7. Operative planning and management of project work package using visual analysis
8. Investment-financial planning of project using visual models
9. Risk analysis using the methods of visual analytics
Abstract
This article describes the project management problems complex and according visual methods applied in order to solve them. A systematic approach to project management and complex objects visualization problem solving is proposed. The article considers the problem of business graphics as modern techniques of computational geometry and scientific visualization, that aims the formation of a geometric model of the project initial data. Methods of visual analytics became popular in recent years and are used as a basic approaches to solve problems in the project management area, to those practitioners pay a lot of attention. Application of visual and instrumental analysis, using original software developed by the authors is proposed. The technological sequence in order to obtain the project management problem visual solution for managers is given; moreover, recommendations for the use of visual analytics methods to determine the necessary intervention in the problem situation arising in the process of project management are given. Decision making software tools for the project management tasks based on graphical analysis of the problem situation and on formulating recommendations for the decision making person are presented in the paper. Visual models of structural and risk analysis, calendar, resources, investments and financial planning are presented.This work is the author's review of methods of visual analysis in the sphere of project management.
Keywords: Visual model of the project, Project management, Business graphics, Graphical representation, Geometrization of business data, Business intelligence, Visual analysis, Problem situation, Schedule, Project planning, Project schedule, Project Risk analysis
1. Introduction
The specifics of project management lies in the processing and analysis of large amounts tabular and numerical information directly relating to the time, cost and resource parameters projects.
Generally it is accepted that the visual approach to managerial tasks are most effective because they provide simultaneously qualitative and quantitative solution to the problem. Accuracy control problems obtained by the methods of visual analytics can vary substantially depending on the provision-represented input data and the chosen method solve the problem situation. The number of parameters, which is able to absorb the visual model, in some cases exceed the resolution of human perception of the bodies. At the same time the responsible for the decision person that is making a decision based on the graphic image of the spatial scene or a flat picture, is not always able to perform precise comparison of emerging geometric images. In this situation, there may be some errors in solving practical problems; however, in that case inaccuracies are inevitable in numerical methods of solving tasks.
As far as project management problems solving is concerned the use of business graphics is preferred, because for the manager it is more convenient to use graphically presented problem situation description and so analyze geometric model rather than to operate numeric objects. In most cases, numerical calculations are produced by specialized project management system, while the manager receives a finished graphical representation of geometric model obtained or visual model, on base of which the decision is made. Thus, methods of business graphics, based on the geometrical representation of spatial scenes or flat drawings in the field of project management are the main or base analogues, which often do not exist.
In this paper, the authors present a systematic review of existing methods for solving problems in the field of project management with the help of graphical user interfaces of developed software, realizing the functions of visual analysis and monitoring information arising at different stages of the project lifecycle.
2. The method of project management visual tasks solving
The approach to the visual solution of tasks from managerial sphere has the scope aiming on control implies the implementation of certain milestones interrelated with geometric modeling and visualization of the problem situation. Technological scheme of the visualization business data process [1], oriented on the decision of tasks in the field of project management, is presented in Fig. 1.
Visual business modeling in the field of project management is based on the systematic approach to the study of the project as the object of analysis. Therefore, it is necessary to itemize the complex of graphical models used for visual analysis of business data and problem situations in project management, which can be called visual system models. The business graphics means formation of a graphic representation of tabular, numeric, and symbolic-numeric business data aiming on their analysis. Business graphics is one of the modern applications of computer geometry and visualization.
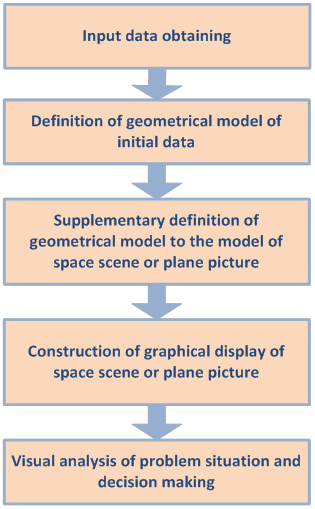
Fig. 1. The process of visual analysis of the problem situation.
According to the project management body of knowledge the entire complex of tasks for project management is presented as a set of problematic areas, which are being held by projects manager. Such domains or project management tasks concern with:
1. Project Integration Management;
2. Project Scope Management;
3. Project Time Management;
4. Project Cost Management;
5. Project Quality Management;
6. Project Human Resource Management;
7. Project Communications Management;
8. Project Risk Management;
9. Project Supply management.
The fig.2 shows a graphics flat drawings or spatial scenes (depending on the scope of the project and management task) used in the management of projects which have been applied in the visual analysis of the tasks of project management [11].
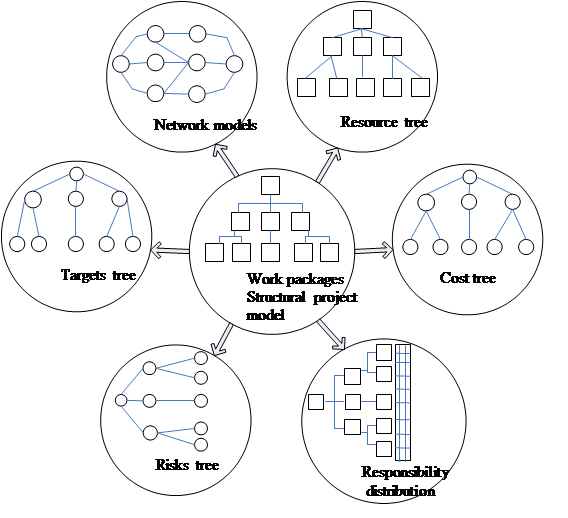
Fig. 2. Types of graphic business models in problems of project management.
As we can see from the fig. 2, in general model of graph theory is the typical geometric-graphical interpretation used in computer visualization of business data in the project management margins [12]. However, the specificity of business-graphics tasks related with project management, allows to use instrumental tools of visual control and analysis, intended for the visualization of multidimensional data, including those related to financial and economic indicators of the investment projects.
Each listed above task corresponds to certain initial data, obtained as a rule, on the basis of analysis of the project’s content, stages and integration management.
As it was noted earlier, the initial data in the sphere of project management has a tabular numeric or mostly symbolic-numeric representation.
Selection of the project initial data starts from the stage of pre-project analysis, which begins with a definition of the subject area of the project, as well as at the stage of preliminary planning, fig. 3.
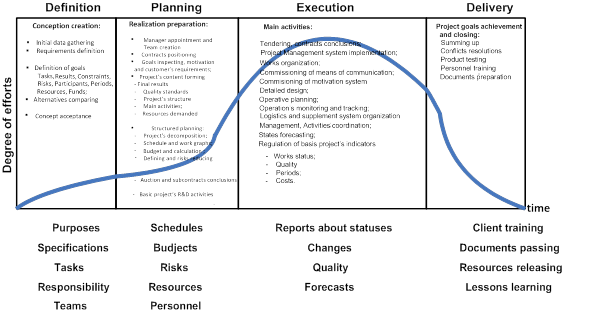
Fig.3. Graphical structure of the project’ life cycle with source data for visualization at each of the stages.
The Fig. 3 shows a graphics image of the project’s life cycle [11] as a flat picture. This illustration shows the typical stages of the life cycle [8,9] and the list of source data which generated on each of these steps. Besides that fig.3 represents the level of project executors effort (the curve of life cycle is marked by the blue), which leads to the successful finalization of the project in pre-given time frames and with appropriate quality of project’s activities. As we see, the number and variety of source data at all stages of the project is large enough.
The fig.3. shows the phases of the life cycle, marked with text comments for each phase (identification, planning, execution, delivery) are defined functions and tasks that are performed during its implementation (the fine print inside each phase). At the bottom of the fig. 3 under the corresponding phase the initial data for visualization generated at each stage of the life cycle are depicted. For example, for the planning phase there are the schedule, budgets, risks, resources and personnel.
The sophistication of the project management tasks solving with the help of visual analysis methods depends on the dimensions of the initial data. Fig.4. shows the levels of management and projects sizes combined with projects initial data that are available for analysis by specialists of the corresponding level. The size of the projects lead to an increase in the dimensions of the initial data to be analyzed by visualization means. Thus, the bigger project is, the larger becomes dimension of tabular-numeric and symbolic parameters taken into account by manager. The dimension of the source data is understood as the number of activities included in the project. Every activity has the time, cost and resource parameters which are also characterizing the project management tasks dimension.
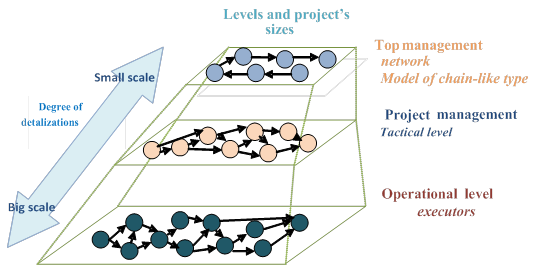
Fig. 4. Visualization of the management levels and the size of projects at each level.
In general project initial data can be obtained in the following ways [1]]:
1. By measurements (deadlines, work volumes, resource requirements, costs and etc. taking into consideration intervals of planning activities).
2. By statistical processing (the construction of statistical estimations and models of operations).
3. By mathematical modeling (by constructing of mathematical models of the project and activities).
4. By Involving experts to predict results or estimation of the time frames, costs amounts, sales, etc.
5. By using databases of best practices about successful projects already has been done in the company.
Essentially, the first two tasks of the project management helps collect and compile the input data used to solve next tasks. Generalized initial data include the following set of in-formation:
Ø general information about the project;
Ø project duration (implementation period, including directive)
Ø the participants (project team);
Ø the life cycle of the project and its structure (fig. 3);
Ø the project environment;
Ø contracts;
Ø implementation costs;
Ø financing;
Ø principles of control and management;
Ø specification of risks.
It also should be noted that visual analysis and comparison of objects play key role for solutions of the problems those solving is related to the geometrization of the source data.
Comparison of geometric objects is carried out by means of the concept of figures congruence. Similarly, we can introduce the concept of managerial situation congruence using a geometrical image (visual representation) of this situation.
We assume that each managerial situation Di, (1=1..n) is in coincidence with its visual representation (visual situation) - Bi, i.e. takes place mapping of type f:D→B. Each managerial situation can be coincide with one or more visual situations, depending on the way geometrization of the initial data of the managerial situation model. Thus defined surjective mapping D on B. Assume for certainty that takes place visual situation in a format of flat picture (enclosed area or a polyhedron) or spatial scene (multidimensional enclosed object). Such way of domains definition is typical to generate a set of alternatives in the function extremum searching in optimization problems, decision-making, and operations research.
It is necessary to impose the concept of a reference (or planned) management situation D0, with which the mapping is realizing (both graphical and content mapping). Graphic image (planar or spatial scene) of the reference situation lets denote by B0. Let’s proceed from the quantitative description of the business situation Di to its visual analysis Bi. In addition, every specific business situation that related to project management, can be accompanied by a visual indicator in the format, for example of Chernoff’s faces, reflecting the appropriateness of a decision or choice of alternative strategies for project manager. As known, there are about 12 factors reflecting the Chernoff’s faces that can display characteristics of managerial situation. From the project management point of view, combining the factors of project efficiency and presenting them into the form of a face is rather obvious pictorial geometric representation of project characteristics. Fig. 5,6,7,8 accompanied by a similar visual commentary for the Manager.
Let’s mark out the possible alternatives in management decisions in compliance with the introduced conceptual apparatus:
1. If Bi = B0, then it is not necessary to intervene in managerial situation, the situation is developing according to the planned scenario, fig. 5.
|
|
|
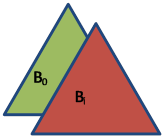

Fig. 5. The case of coincidence domain B0 and Bi.
2.
If Bi![]() B0 then the actual development of management situation
includes the planned results of activity and the intervention of the Manager is
also not required, however, the
difference between planned and actual situations is a factor that should be
taken into account in any case, fig. 6.
B0 then the actual development of management situation
includes the planned results of activity and the intervention of the Manager is
also not required, however, the
difference between planned and actual situations is a factor that should be
taken into account in any case, fig. 6.
|
|
|
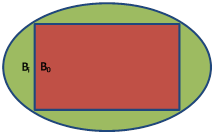

Fig. 6. B0 contains in Bi.
3.
If Bi![]() B0, then the actual
development of managerial situation may differ from the planned scenario of
behavior and requires the intervention of the Manager, fig. 7.
B0, then the actual
development of managerial situation may differ from the planned scenario of
behavior and requires the intervention of the Manager, fig. 7.
|
|
|
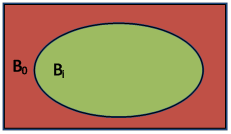

Fig. 7. Bi contains in B0.
4.
If Bi![]() B0 и B0∩Bi≠
B0 и B0∩Bi≠![]() , then the actual development of the
business situation differs from the planned and it is necessary to make an
operative intervention of decision making person, fig. 8.
, then the actual development of the
business situation differs from the planned and it is necessary to make an
operative intervention of decision making person, fig. 8.
|
|
|
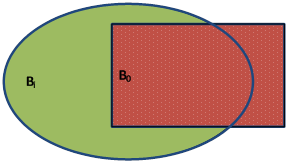
Fig. 8. The case of partial matches between Bi and B0.
Thus, it is possible to formulate by visual analysis of the problem situation: whether the interference in the course of its implementation or this is not necessary.
3. Structural models of project management and their visual representation
The initial task of geometrical representation of structure of project’s work package is to visualize the decomposition of the work breakdown structure (WBS). The source data for constructing the WBS is a list of the tasks (subtasks), divided on operations, and defined as a composition of works correlating with different levels of management. In addition, the initial data can be proposed as performers of operations, the amount of work and volumes of operations, resources and equipment. An example of WBS visualization is shown in Fig. 9.
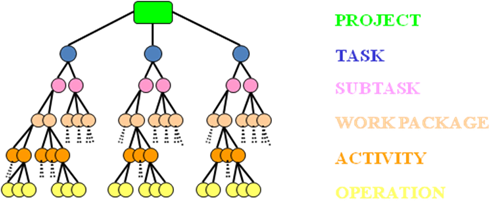
Fig. 9. Visualization of the model of project structure.
As can be seen from Fig. 3 and Fig. 9, a graphical representation of the initial project data allows making a reasonable approach to the tasks of synthesis of the structure of the project and defining later the sequence of operations by modeling the relationships between the works at appropriate levels. WBS is the basis for the tree visualization of:
Ø The structure,
Ø The costs,
Ø The distribution of responsibility,
Ø The purposes,
Ø The risks.
WBS cognitive visualization aims the project models construction with according levels of management adopted in the company. It is possible to check the saturation of management levels by the tasks, balance of tree by the levels, to make a conclusion about the size of the project, its visibility, manageability, the necessity of selection of the management team. WBS is used as the initial data for building the network model of a work package, linear models and their subsequent visualization.
Visualization of process of creation of the organizational structure of the project is presented in Fig. 10. Initial data for geometrization is the matrix of the distribution of responsibility in the organization.
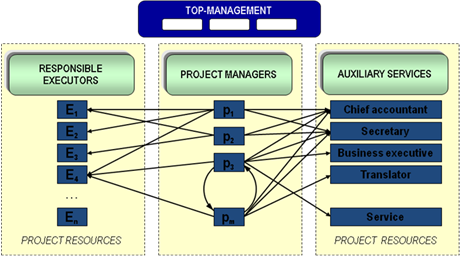
Fig. 10. The formation of the organizational structure of the project in company.
Cognitive function of the visual model defines the principles of the formation of organizational structure within the resources available, organizational staff units based on their interaction scheme.
Taking into account extending of the definition of geometric model of the formation of the organizational structure of the project to a flat picture model, it is possible to visualize the command structure of the project executors and thus solve the problem of its visual synthesis, Fig. 11.
Visualization of the organizational structure of the project in the format of the command structure, based on a geometrical model of graph theory, allows cognitive function and demonstrates the action of the law Brooks, who argues that attracting additional labor to delayed projects leads to their further delay. This effect is visualized with the complexity of the organizational structure of the project by introducing a further element (performers). This accordingly will increase the number of interactions in the team, creating, thus, a geometrical model of the complete graph, the number of relations in which the number of vertices depends on the number of nodes, and in general equals to n (n-1) / 2. Where n - is the number of vertices (nodes) of the graph.
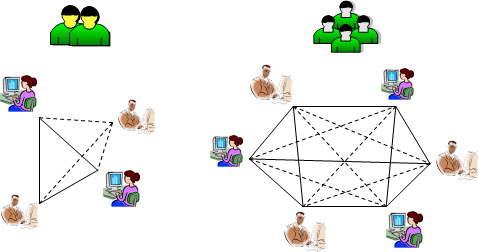
Fig. 11. The geometric model of the structure of the team (members) of the project.
As the initial data for visualization tasks of the project topological structure a model of graph theory is admitted. In other words a mathematical model of the project is its network model - a oriented graph G (X, U) without loops and cycles, where X is the set of vertices, and U is the set of arcs of a graph G, directed from left to right [4]. As a rule, the durations of operations are presented as weights of the arcs of an oriented graph.
The main form of representation of the oriented graph is incidence and adjacency matrix, which allow to determine its topology. Fig. 12 shows a graphic interpretation of initial data of the project, specified by tabular, and the visualization of the network model.
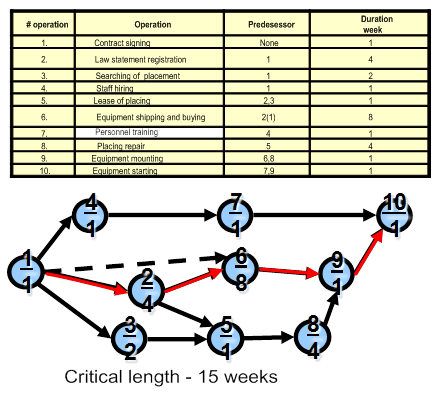
Fig. 12. The source data in tabular form and visualization in the form of a network model of a complex of project’s work (critical path marked in red).
Extending of the definition of the geometric model of the project to model a flat picture is combined with possibility of representation of the critical path as the path that does not have a time slack. Using of the concept of the critical path and time slacks of operations plays a crucial role in the process of managerial decisions making [3].
Visualization of the network model of project works package in the form of a flat picture is essentially has cognitive character, because it allows to represent precedence-succession relationships between the operations of the project in graphical form, and performing the synthesis of set of logically valid fronts work package of the project. The network model is a convenient form of visualization of geometric data, because it has the property of visibility and accessibility of structural changes implication. In addition, it is possible to visualize the solution of the task of finding topology and length of the critical path of the project Fig. 13 shows a linear model of the project - the Gantt Chart. Initial data for the visualization is the schedule of the project activities in tabular-symbolic form with the names of operations. Extending of the definition of the model to the flat picture allows to visually analyze time slacks of operations and duration of works. Color-highlighting of operations graphically displays their criticality, marked on the graph in red color. Fig. 13 shows network and linear graphs are combined, that illustrate alternative approaches to the visual analysis of business data for comparing two methods of visualization. As you can see, visually network and linear models can easily be transformed one into another. The highlighting of some works in red color on the graph allows to visually identify the critical path of the project and time parameters of non-critical operations.
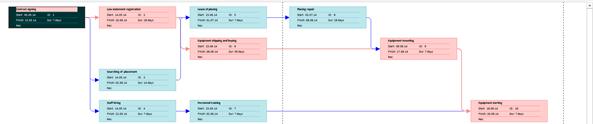
Fig. 13. A visual models of the project: linear and network.
It should be noted about the advantages and disadvantages of each method of visual analytics of business data in the formats of network model and Gantt chart:
Ø Historically linear model was proposed earlier than network method of visual analysis.
Ø Network and linear model visualizing the structure of the project both sufficiently reflecting the composition of a works package.
Ø The network model visually reflects interrelations between operations more clearly than a linear model from the topological point of view.
Ø The graphical cognitive advantage of the network model over the linear model is that it is more adapted to make changes, constantly encountered in implementation, planning and project management.
Ø With the help of the network model the technological sequence of operations that are in the critical path, and which determines the maximum execution periods of the project activities, can be visualized.
Ø At the same time, visually linear model of the project in the format of a flat picture allows to track the execution periods of operations and visually monitore the slacks of non-critical work.
With the help of a software tools developed by the authors [13] it is possible to perform the input data in tabular form, get the visualization of the network model of the project. The following functions are also available:
Ø scheduling function with the constraints on the number of available resources,
Ø Visualization of linear and resource charts for several kinds of resources.
4. Graphical models of structural transformations of projects
The structural transformation of the network model of work packages, as a form of geometrization of the project initial data, are executed mainly visually, as opposed, for example, to the procedures of the calculation of numerical characteristics of events and activities.
In the basis of structural geometric transformations are lying the procedures of combining (sequential and parallel), disaggregation and enlargement of network models [4,5].
Initial data for visualization of procedure of the conjunction are the network models of combined particular network fragments Gi(Xi,Ui),где i=1..n - the total number of submodels.
Visualization of procedures of sequential and parallel combining of network models is shown fig.14.
Visual model of the initial data in the form of graph theory model allows to solve the problem of obtaining a consolidated network fragment project, which is structurally more complex than network diagrams private combining.
Visual analysis of the consolidated network project model allows to estimate the scale of work package in the future to map the structure of the joint project with the complexity of management tasks.
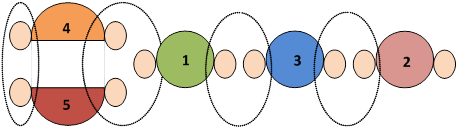
Fig. 14. Visualization of consolidated network graph as a result of procedures sequential and parallel conjunctions of private network models.
Fig. 14 shows a schematic representation of the network fragments No. 4 and 5, which are combined in parallel. Fragments 1, 3 and 2 are attached sequentially to the result of parallel linkage of fragments 4 and 5. Visual analysis and comparison of the result of associations enables topological mapping the source data model and results, taking into consideration the mutual geometric layout of the objects of analysis.
It should also be noted that the procedure of disaggregation (decomposition) of network model of a work package is mainly based on geometric representation of decomposing parts of the graph, which are providing initial data to build a visual model. Fig. 15 shows an example of a visual reduction of the network model to the form, which allows to process and analyze the project by parts, thus, ensuring, reducing the dimension of solving managerial problem. The extending of the definition of geometrical model to the model of a flat picture implies delimitation of subgraphs of smaller dimension compared to the original network model, by selecting the events of the same rank [4].
In this case visualization of solution is of a cognitive nature allows a reduction of network model by geometrization of the initial data, in the form of graph theory model.
Thus, visually solved the problem of obtaining several subgraphs of a smaller dimension and defined the order for further processing fragments 1-2-3 using visual or numerical analysis of network model.
Visualization of consolidation procedure of the network lifecycle model, allows to make a valid approach to the formulation and tasking the managerial problems for managers of different levels. Specialists are used enlarged or aggregated information on each level, the level of details that decreases as you move up the organizational structure of the management (fig.4)
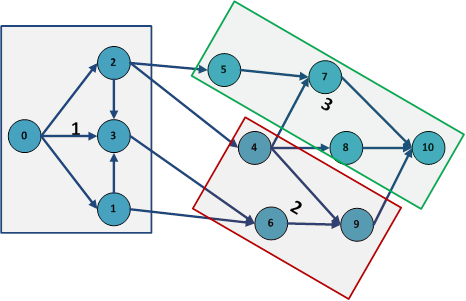
Fig. 15. Example of visualization of decomposition network model (Noted fragment 1, 2 and 3)
A visual project model is formed as a result of consolidation [18] procedure, reflecting simpler structure that contains less elements, and arcs than the original. As a source data in the visualization of consolidation procedure used a network model of the project, extending of the definition of the graphical model of the project to the flat picture means numerical aggregation too at that, i.e. showing cumulative information regarding time and cost parameters of the project.
There are known some cases of equivalent by the time and cost enlargement of work package [16, 18], which allows to use visual models of geometrized initial data in the form of model graph theory.
Let's review some particular cases of equivalent in time and cost enlargement, using chain-like type visual models of aggregated projects.
Figure 16 presents a visual model of enlargement, equivalent by the cost and time arising in the tasks of parallel conjunction of particular network fragments containing adjoint operations. Extending of the definition of the geometric model of enlargement to a model of a flat picture related with the denotations of the activities in the form of letters, and the boundary event of enlarging separated network subgraph (selected by the dotted line) is denoted by x1 and highlighted in maroon color.
As initial data for visualization are considered the numerical cost and time values of works and events of the project (Fig. 16), and also the information about the internal events (highlighted in blue) and boundary events (highlighted in pink) of enlarging subgraph of G network model. Chain-like network graph G0, presented in Fig. 17 is the initial data for visualization of the result of enlargement procedure. Extending of the definition to a model of a flat picture associated with the indications above the arches of time and cost parameters of the aggregated activities and color indication remained after enlargement of the events.
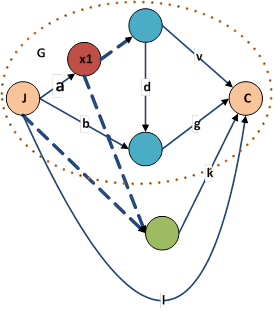
Fig. 16. Visualization of enlarging network graph G, which contains conjugate operation.
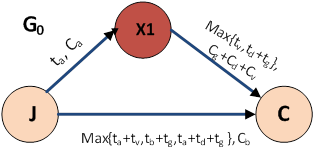
Fig. 17. Visualization of the enlargement result G0, which is equivalent to the original G by time and cost.
Cognitive visualization of the enlarged model allows to determine the geometrical image of object in a graph of special chain kind, which is typical for the life cycle model. Numerical value parameters of enlarged network graph can be obtained from the visual solution of the task of aggregation:
|
|
(1) |
|
|
(2) |
|
|
(3) |
Using visual analysis of the enlargement result which is equivalent by time and cost, value parameters of works in the enlarged graph G0 can be defined in general terms:
|
|
(4) |
|
|
(5) |
|
|
(6) |
Where ![]() ,
, ![]() ,
, ![]() - is the cost of work, respectively,
prior to, and following to, and the incomparable with the event x1.
- is the cost of work, respectively,
prior to, and following to, and the incomparable with the event x1.
Fig. 18 represents visualization of the structure of the product life cycle as form of a network model that can be obtained from the described above procedures of structural geometric transformation of project (Fig. 14, Fig. 17) Initial data for visualization is a sequence of steps, which is presented in Fig. 3. According to [8, 9] the life-cycle model in Fig. 18 has a visual interpretation in terms of the main and auxiliary processes, included in its composition. Arcs that connect nonadjacent vertices of oriented graph (0→2, 1→3, 2→4, 3→5) are interpreted as auxiliary and supporting life cycle processes, and connecting adjacent vertices of a graph (0→1→2→3→4→5) as the basic processes.
Cognitive geometrical model of the product life cycle, as seen from the figure, has a specific chain-like structure, which allows to identify a number of important and practically significant properties [2] on the basis of visual analysis [16].
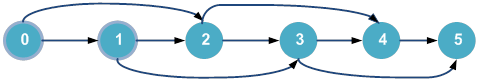
Fig. 18. Visualization of structure of the full life cycle of the product in the form of a network model of a complex of works.
The authors have developed a software system [20], that solves the problems of the visual analysis of the structure of the project in the form of a network model of a work package. Fig. 19 presents an example of visualization of the consolidated network model of work package for the project.
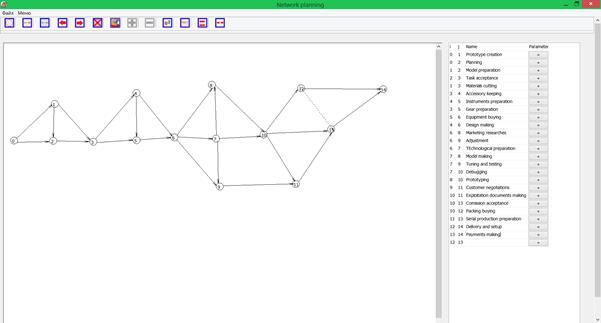
Fig. 19. Example of network model of a work package in the form of flat picture with a tabular representation of the source data [22].
Using the software tool, you can visualize a custom topology of the network model of a work package, including chained structure of the project life cycle, using the tools of cognitive visual analysis.
5. Visual modeling of the numeric parameters of the project
Solving project management tasks, it is necessary to receive the initial information, concerning numerical characteristics of operations, including duration and the cost of execution of separate operation. To construct the mathematical model of the operation it is necessary to use the probabilistic method of description, based on the visual representation of the distribution function of a random value.
For constructing of the numerical estimations of work parameters, let's make a geometrization of initial data in the form of probability β- distribution law[4]. The mathematical expectation M[t] of the duration of execution of work is calculated on the basis of three numeric ratings - tmin - an optimistic score of the duration of execution of work, tmax - a pessimistic score of the duration of operation and tm.p. - the most likely score of its duration.
Consider the visualization of the initial data with the help of Fig. 20, which shows the differential distribution function of probability density of beta-distribution.
Extending of the definition of geometrical model of the initial data to flat picture due to the imposing of coefficients α и γ - offset (the slope of the) curve towards pessimistic (in the case of the coefficient γ) and optimistic duration value (in the case of the coefficient α).
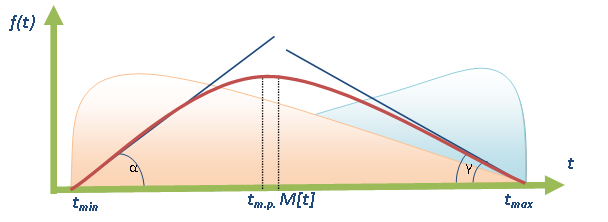
Fig. 20. Visual model of β- distribution of differential cumulative distribution function of probabilities of operation execution’s duration.
Visual analysis displays that the offset curve β- distribution to the left or the right allows to adjust the probabilistic assessment of cost or time of work performance in the direction of optimistic or pessimistic scenario. Cognitive visual analysis of fig. 20 allow to identify, that the value of the mode of distribution of duration performance does not match the expectation and clearly observable character of unimodal curve.
Moreover it is possible to visualize the distribution function of critical duration of the project, and the duration of the critical project time will be distributed according to the normal law due to the Central limit theorem.
The initial data for visualization of the density distribution function of probabilities of a critical path duration are the results of statistical tests that are usually specified in tabular format.
The fig. 21 represents a visualization differential distribution function of the length of the critical path.
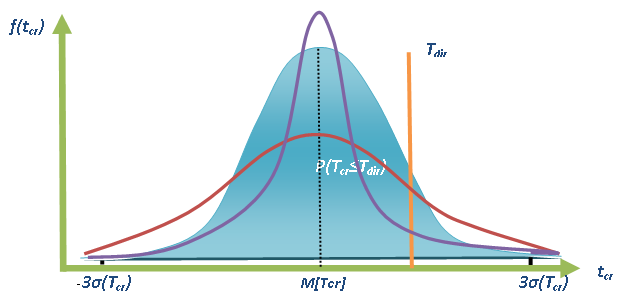
Fig.21. Visualization of differential distribution function of the probability of the duration of the critical path for the normal distribution law.
Visual analysis of fig. 21 allows to solve several managerial problems.
Ø As seen in the flat picture, the forms and colors of different curves of normal distribution are predetermined. Red curve corresponds to a high degree of uncertainty of distribution of the critical path duration, blue - moderate and purple - low. That is, by the shape of the curve can judge about the risk level immanent for each of the variants of the project implementation.
Ø It is possible to visually solve the problem of finding the probability of completing the project to the directive period indicated on the chart a vertical line (Tdir). Visually the probability of completion of the project for Tdir visually determined by using a area of the shape bounded by a function of the normal distribution (any color) and vertical line Tdir.
Ø Also, it is obviously possible to perform a visual analysis of the rule of three Sigma’s, known in management.
Let's consider the visualization of numerical data, which are used for project modeling using the PERT method of analysis [3, 4].
There are numeric estimations of duration and cost of operations used as initial data for visualization of model of project planning based on PERT-analysis. The result of project planning on the basis of PERT-analysis, usually presented in a tabular data, which are assumed as initial data to visualize linear Gantt diagram which reflects the structure of the calendar plan of work package. By the means of the visual analysis it is possible to correlate with each other spatial localization of operations on linear Gantt chart, presented (fig.22) in three-dimensional format.
Visualization of solutions of scheduling tasks using PERT - the method is performed with the help of software for project planning, which was developed by the authors [13]. Probability of completing of the project to the direct time is displayed with the help of linear diagram of the project and the parameters obtained at the planning schedule, the early and late start and finish times of operations, time slacks, standard deviations of works durations.
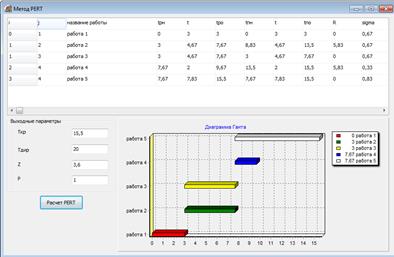
Fig. 22. Visualization of the result of solving the scheduling problem [13] using PERT-method
6. Visualization of resource calendar planning of interruptible and uninterruptible operations
Visual analytics methods are extensively used to build a resource profile of project works packages in the tasks of calendar resource planning of projects. Based on this profile manager makes a decision about the physical (resource) feasibility of the project.
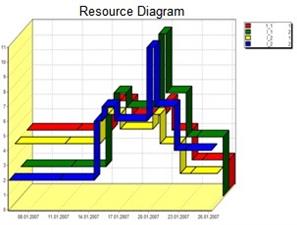
Fig. 23 shows the visualization of profile of resource requirements of the project without restrictions for the available resources. Resource numeric parameters of operations are used as initial data for visualization. Extending of the definition of the geometric model to a flat picture implies taking into account the existing resource constraints using visualization of a line (marked on the figure in red) to indicate a problem situation of deficit of limited resources.
![]()
![]()
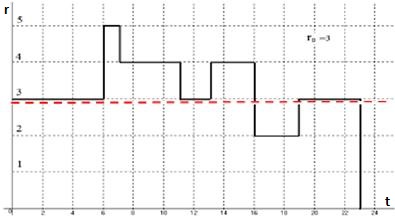
Fig. 23. Visualization of resource project diagram constraints on top of the amount of available resources r0=3.
Visual analysis of the problem situation, developing in relation with a deficit of available resources, is possible to perform using Fig. 24.
As can be seen from Fig. 24, the imposition of restrictions on top of the amount of resources leads to an increase in the length of the critical path to the duration of 28, which is an indicator of the problem situation, due to the shifts of the scheduled operations times.
In this case, there is a cognitive visual model of a problem situation, received from the source tabular data.
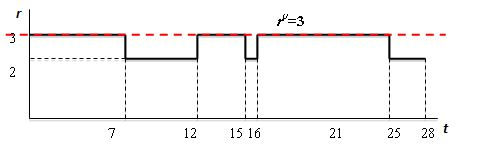
Fig. 24. Visualization of resource diagram as a result of solving the problem of resource planning with regard to restrictions on resources (r).
Constructing of resource - valid calendar plan of project’s works package is an important task, which is regularly solved by the Project Manager. There are a number of heuristic and exact methods that take into account the priorities assigned to the operations and used to solve scheduling problems with the restrictions on available resources. The authors have developed a Web-oriented software system for solving the problem of resource scheduling of project work package [19] using parallel and sequential methods [4,5]. Visualization of the structural scheme of the developed system is shown in Fig. 25
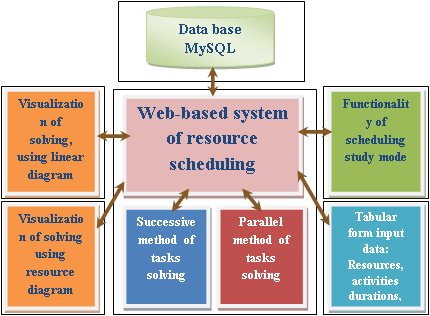
Fig. 25. The visual model of the process of project scheduling using the Web-oriented system.
As the input data used for the visualization of the model schedule are entering the tabular data concerning the duration of the operations, resources (consumption) and the presentence of interruptions in operations. It should be noted that the sequential method of resource scheduling ignores interruptions during the operation, while the parallel method of resource planning allows to take into account interruptions that occur during operations. Figure 26 presents the visualization of the network model of project’s works package for which resource-valid schedule is constructing.
Extending of the definition of the geometric model, in this case, consists in representation of time parameters of activities on the arcs of oriented graph. Thus, a model of a flat picture, having an illustrative character, is visualized.
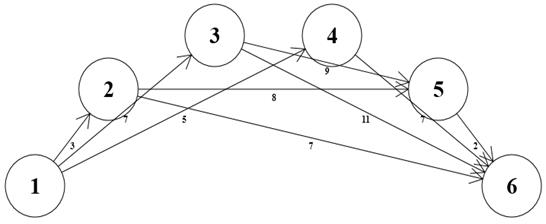
Fig. 26. Visualization of the network model using Web-oriented scheduling system [19].
In the Fig. 27 presented visualization of linear Gantt chart created using the developed software tool of visual solving of projects scheduling problem.
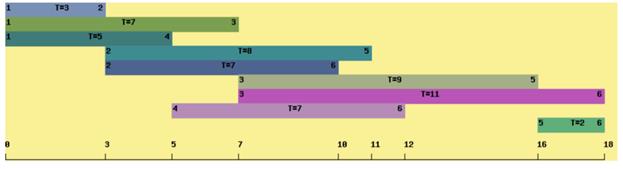
Fig. 27. Visualization of linear Gantt chart [19].
Visual model presented in Fig. 27, is predetermined by the model of a flat picture, with the duration and indexes of works, which are the source data for visualization.
It should be noted that process of calendar resource scheduling of a works package is done iteratively (i.e. in a "step-by-step" mode).
In the Fig. 28 shown the initial data about the project in the format of a schedule (table) to solve the problem of resource planning using sequential method and also the result of visualizing in the geometric format of the network model. Information about the resources consumed by operations is also included in the source data.
In this case, the visualization has an illustrative character, allowing to specify topological structure of a complex of operations.
It is necessary to mark that it is possible to make visualization of the solution of the task of resource scheduling for sequential and parallel methods on each iteration or an algorithm step. However, usually exploring only the final use of the visual model obtained in the last iteration step. Linear project and resource charts are used here as a visual models, usually in the format of flat picture that perform control visual analysis of the solution for compliance with resource constraints and the smoothness of profile of resource requirements. Smoothed resource profile has usually pyramidal or triangular profiles [5]
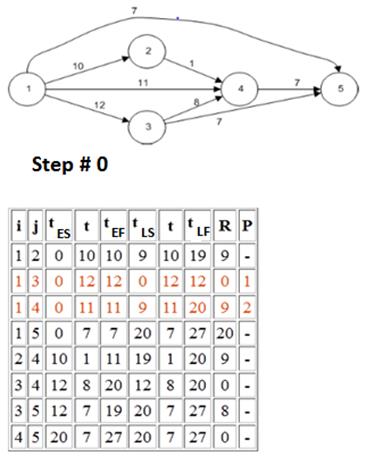
Fig. 28. Visual representation of input data for solving the problem of calendar resource planning using sequential method [19].
The result, obtained using a sequential method of planning, is shown in Fig. 29. Visual-ization of the obtained solution is made in the format of linear and resource charts. Numerical parameters of operations of the resource-acceptable schedule presented in tabular form in the last step of implementation of a sequential method are the initial data for visualization.
Visual analysis allows to determine the critical duration of the project in terms of restrictions for the available resources.
Imagine now the visualization of solution of the task of calendar resource planning using a parallel method that allow interruptions during operations. Fig. 30 shows the format of the input data for solving the problem in a tabular form. Time and resource operation parameters are used as input data for the visualization of the network model.
Fig. 31 shows the result of solving the problem of resource scheduling of the project us-ing a parallel method, taking into account the interruptions. As can be seen from Fig. 31, cognitive visualization of solutions allows to determine the parameters of the calendar plan of the project taking into account interruptions during execution and restrictions on available resources. The number of interruptions, which occurred during the project, can also be estimated using visual analytics.
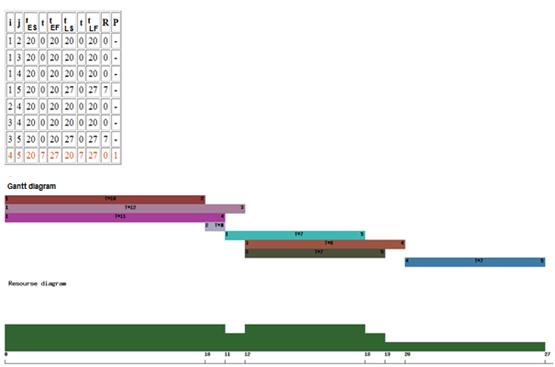
Fig. 29. Visualization of the linear and resource charts of the project schedule for a sequential method [19].
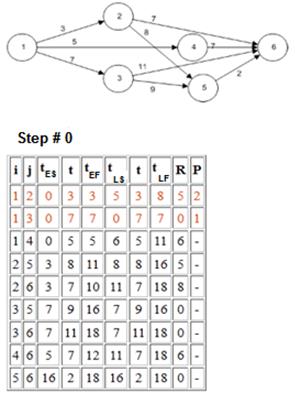
Fig. 30. Visualization of initial data of the project in the form of a network model for the solution of the scheduling task using a parallel method [19].
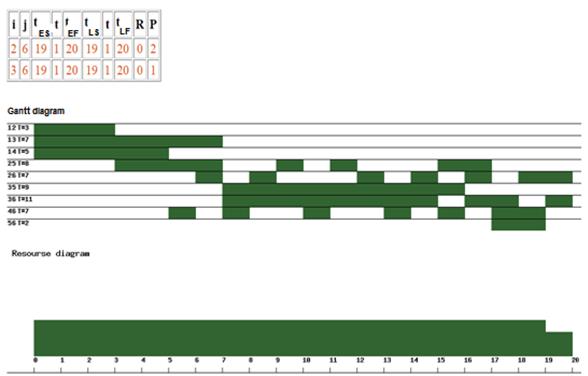
Fig. 31. Visualization of the solution of the task of scheduling using a parallel method in a format of the linear and resource charts
Visual learning of the basics of the calendar resource planning for projects is a teaching mode of the software simulator, developed by the authors [19]. It is possible to test the visual simulator by clicking on the link: Program planning. Software product implements the functions:
Ø tabular input of information about the project,
Ø the visualization of the network and linear models of the project,
Ø the solutions of the problem of resource scheduling using sequential and parallel methods
Ø Can be used as a software simulator.
There are also known precise methods [5] of the analytical solution of the task of distribution of limited resources between the operations included in a complex of operations of the network model of the project. In precise method of resource planning also it is accepted to use the methods of the business graphics and visualization of business initial data. Precise methods have some drawbacks, such as, for example, the dimension of the project initial data. However, despite the dimension, source data allow geometrization and subsequent visualization, which allows to apply visual analytics tools even for large scale problems.
Visualization of the original business data for solving the problem using precise method of scheduling is performed using linear Gantt chart, Fig. 32 and also by using visualization of a resource profile of requirements for project resources for several different types of resources (information on the consumption of which is the initial data for visualization).
|
|
|
|
Fig. 32. Visualization of the line chart of Gantt and the resource chart in a format of a 3D model [13].
|
|
The solution of the task of resource planning of project work package using precise method implies [5] the construction of a set of logically and resource-acceptable fronts of work package. It is possible to synthesize the set of fronts, using visual model in the format of a Gantt chart, getting the front of works using the straight line, perpendicular to the axis of time (abscissa).
Set of logically acceptable fronts has a graphical interpretation in format of incomparability relationship graph. In its turn the initial data for the visualization of incomparability relationship graph is incomparable set of operations defined in tabular-numeric or character formats. In the fig. 33 network model of the project visualized, for which using methods of visual analytics it was built incomparability graph of operations, Fig. 34. Models of flat pictures are the cognitive visual models, because they allow to solve the problem of synthesis of a set of fronts, based on geometrical properties of the object of analysis.
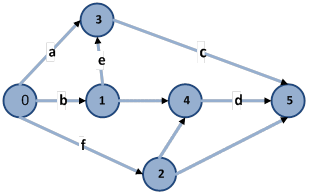
Fig. 33. Visualization of a network model of the project for the solution of the task of resource planning using an precise method.
In the case of the solution of the resource planning task using precise method applies also the graph of distances used for visual analysis of the possibility of a transition between the fronts of the work package with a minimum of interruptions between operations, that are included in the project structure, Fig. 35.
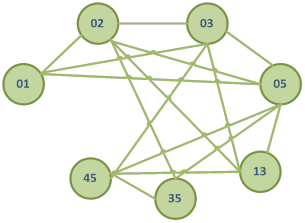
Fig. 34. Visualization of incomparability relationship graph obtained using the graphical analysis of the original network model of the project.
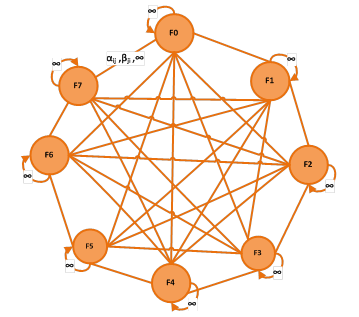
Fig. 35. Visualization of possibilities of transition from one front of operations Fα to another Fβ using geometric model of a flat picture.
Initial data for the construction of a visual model of the transition graph is a distance matrix containing the distance between the fronts of the work package. Extending of the definition of the geometric model of initial data to a flat (figure. 35) picture which is cognitive visual model combined with the determination of weights of arcs - transitions between the fronts, which are displayed as a weighted arcs of oriented distance graph. Fig. 35 shows the distances over the arcs between the fronts which are equal to the number of different operations that are included in both of fronts. Distance in the transition from the front Fi to Fj denoted using αij, the distance in the transition from Fj to Fi - denoted βji, symbol ∞ is used as a parameter to the transition over the arc of the graph when it is impossible transition between the fronts of the work package.
In addition, when we are solving scheduling projects tasks it is possible to visualize the process of cost changes Fig. 36 during the project execution using the software package, developed by the authors [13]. Initial data for the construction of the visual model is information about the costs of the of project’s works package, specified numerically.
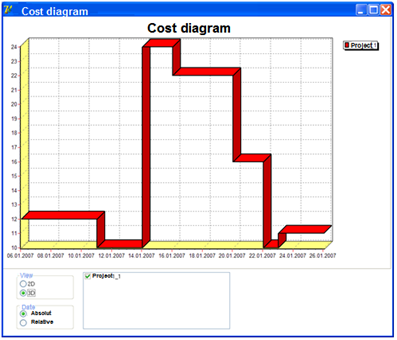
Fig. 36. Visualization of the cost chart of the project, 3D - representation [13].
The visual model, shown in Fig. 36, is a cognitive model of spatial visual scene, which can be used to solve problems of determining the needs for allocation of costs (investments) for the implementation of project’s work package, and also for visual assessment of the peaks of consumed resources in the certain moments of time.
To examine the interactive prototype of a software for solving the tasks of resource scheduling, you can click on the link below (link). Software product implements the functions of scheduling work package of the project based on an optimization model of redistribution of scarce resources taking into account cost parameters that affect the quality of the schedule. The software implements the functions of visualization of the source data (presented in tabular form), network and linear models of the optimal schedule of the project.
7. Operative planning and management of project work package using visual analysis
It is widely recognized that the Earned Value Technique [11, 24], which is implemented in a number of modern systems of project management, allows to solve effectively the tasks of operative planning and control of implementation of the project using a set of visual models.
The initial data for visual modelling of Earned Value Technique are planned, actual and earned costs, which represents numerical characteristics of the project. The fig.37 shows the visualization of Earned Value. Visual model extended to the model of flat picture by drawing on the curves of the graphs of the functions numeric and symbolic characteristics.
This visual model of a flat picture is cognitive visual model because allows to control a plan and actual dates of completion of operations of the project, tracing also deviations at the cost of operations or comparing plan and actual values of the earned expenses. In the Earned Value Technique the following indexes are used, they are graphically displayed in fig.37:
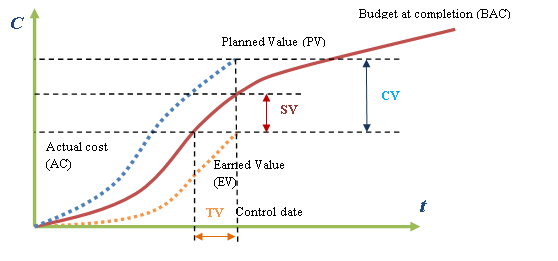
Fig.37.Visualization of indexes of the earned value.
| Deviation on value: | CV = EV-AC | (7) |
| Deviation on schedule: | SV=EV-PV | (8) |
Deviation on time TV, which can easily be calculated geometrically based on the visual model.
Measurement of efficiency of project implementation and prediction of future course of its execution is realized using the following numerical indicators that are initial data for creation of visual model of monitoring and operational management of the project at a stage of its implementation.
Indicators of efficiency of project implementation:
| CPI = EV/AC | (9) |
| - indicators of efficiency of expenses; | |
| SPI = EV/PV | (10) |
| - indicators of efficiency of the schedule; | |
| CR = CPI x SPI | (11) |
| - indicators of criticality of project implementation. | |
The visual model of decision-making, which is based on entered above indicators, implies cognitive visualization of the flat picture displaying progress in the project execution, fig.38.
Cognitive visualization allows to define trends in changes of efficiency of the project, using indicators of geometrical images of administrative situations, including also Chernoff's faces. Value of indicators between certain levels of indexes helps to identify effective actions for intervention in a problem situation of the project, especially if it is spoken about a red zone.
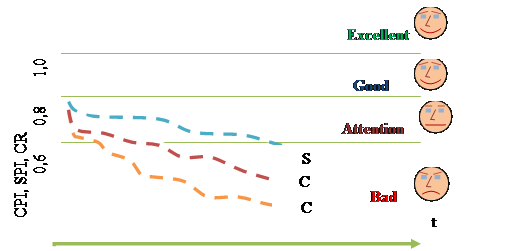
Fig. 38. Visualization of indicators of earned value technique that are used when making decisions by managers in the sphere of project management.
In order to predict the future progress of the project work is used index - an indicator of the cost at completion:
EAC = BAC/CPI (12)
Visualization of geometrical model of the initial data, extended to the model of a flat picture, is provided in a fig. 39.
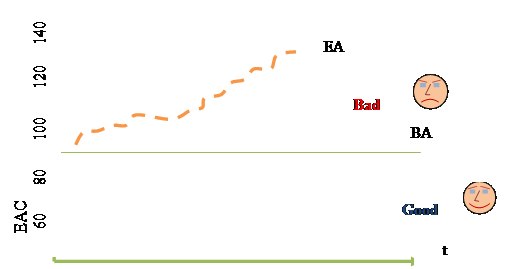
Fig. 39. Visualization of the forecast of the future progress of the project.
Prediction of future project costs is based on visual model, which was extended to the definition of a flat picture, by specifying of zones in which the cost indicator at completion is targeting. As it can be seen from the figure, In case of getting into red zone it is necessary to make changes in the trends of development of the project, interfering with a problem situation, making corrective actions that will be consist in compliance with the durations of operations because the lengthening of durations leads to increase of expenses for project implementation, which is reflected by the indicator EAC - Equivalent actual cost.
Thus, by means of cost and temporal parameters of the projects, which used as source data, it is possible to execute the visual analytical solution of the tasks based on means of a business graphics.
8. Investment-financial planning of project using visual models
Let's review the features of visual models in case of the solution of tasks of investment and financial planning of projects using the modern instrumental business analytical systems. The techniques of visual intelligence became widespread in the area of geometrization of the results of business projects. Fig.40 shows the visualization of project source data.
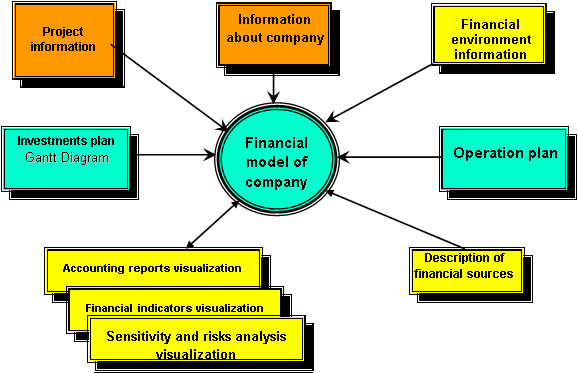
Fig.40. Initial data for constructing of visual model of financial information about a project.
Initial data for creating a visual models of financial and investment planning is quite diverse, although they are mainly have numerical character and are setting, as a rule, in the tabular view [17].
The important task of business analytics in financial and investment project planning is creation of visual models of integral financial criteria. The main criteria of an assessment of efficiency of financial results, according to the technology of UNIDO [10], are the following integral financial indicators: NPV, IRR, PI, DPB, and MIRR.
Visual models of integral financial performance of efficiency of project activities are the determined by the initial business data flat pictures or the spatial scenes applied for the investment and financial decision-making, concerning questions of pay backing of invested funds invested in the project execution.
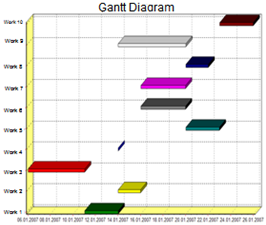
Fig. 41 shows a visual model of a flat picture in a format of a line Gantt’s chart that displays the planned schedule of execution of project works. Visualization is performed by means of the analytical Project Expert system applied to the solution of tasks of financial and investment planning.
By the visualization method the costs of stages execution of project operations and total duration of project implementation, a relative positioning of stages are analyzing.
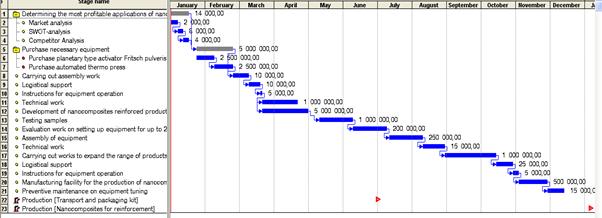
Fig.41. Gantt chart visualization by the means of instrumental Project Expert tool.
Fig. 42 shows a visualization of the process of payback in the form of model of spatial scenes. Initial data for construction of spatial scenes are the cash flows that represents accounting reports data in a temporal cross-section and in a tabular format. By the visualization method the process of payback of initial investments and the rate of income in the context of time is analyzed. Visual additional determination of geometrical model of the initial data may imply in settings of the threshold level of NPV acceptable to the investor, as well as the relevant decisions to invest in the project with a threshold level of income. In the Fig.42 the threshold level of integral income is visualized using a horizontal dotted line; ordinate axis represents time and abscissa axis represents integral effect of the project in rubles.
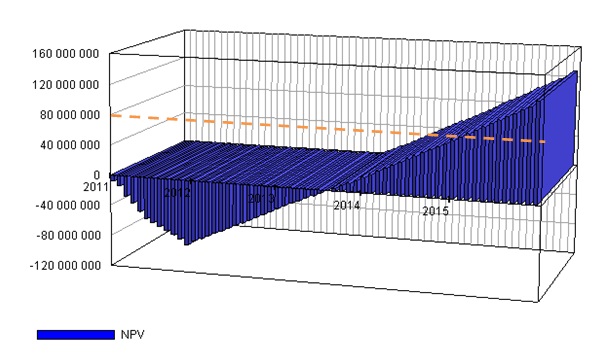
Fig. 42. Visualization of an index of NPV in the form of a spatial scene.
The visual model of sensitivity analysis of an integral index of efficiency of the project depending on indefinite factors, such as is provided: sales, sales price, the tax rate, the initial cost is shown in fig. 43. The initial data to build a visual model of the sensitivity analysis are business data reflecting: sales, sales prices, tax rates that have numeric format. The extending of the definition of geometrical model to the model of a flat picture is combined with the setting of ranges of deviations uncertain factors and creation of bar charts, which performs cognitive function of visualization of NPV deviation.
It should be noted that the dependencies of this type are used for quantitative and qualitative risk analysis of the project results related to deviations of random factors within the established ranges.
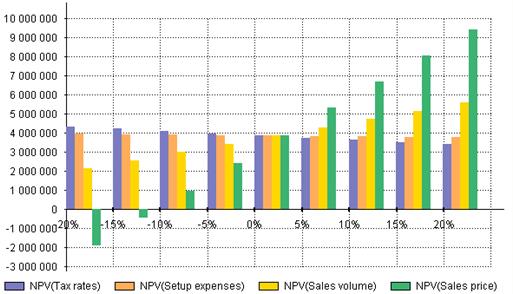
Fig. 43. Visual model of sensitivity analysis NPV as a flat picture.
Fig.44 shows a visual model of sensitivity analysis of the net present value which is presented in the form of spatial scene, allowing to make a quantitative analysis of the risks and possible prospects of the project in the case of alternative scenarios for its implementation.
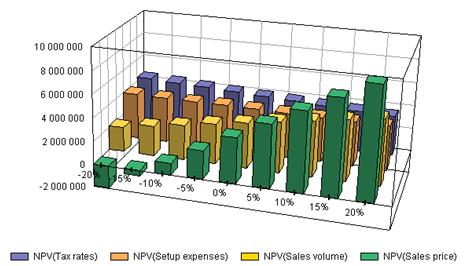
Fig. 44. Visual model of sensitivity analysis of NPV in a format of a spatial scene.
The method of visualization makes possible to analyze, for example, that 20 % increase in prices leads to an increase NPV with 0 to 10 000 000 rubles, or on the contrary, 20% reduction of prices leads to a negative effect from the project execution and the fall of NPV to an unacceptable level.
Fig. 45 shows a visual model sensitivity analysis of the discounted payback period based on changes of an indefinite data. The abscissa axes of the graphs which are presented in Fig. 44 and 45, are pending the ranges of variation of indefinite parameters, and the axis of ordinates a range of changes NPV in absolute units, for example, in rubles.
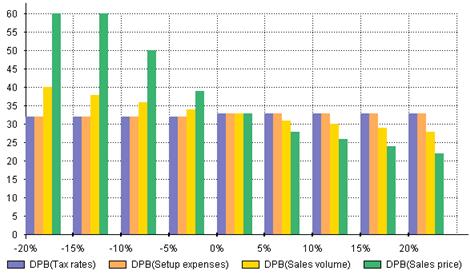
Fig.45. Visual model of sensitivity analysis of the discounted period of payback depending on the price and sales volume, rates of taxes and initial expenses.
Fig.46. shows the visualization of spatial scenes used as cognitive models of risk assessment of the project, which based on index of discounted payback period. The initial data for creation a visual model are the value of sales volumes, sales prices, and tax rates. Extending of the definition of the geometric model of source data to model of the spatial scenes, is regard with marking the changing ranges of the analyzed parameters on the axis.
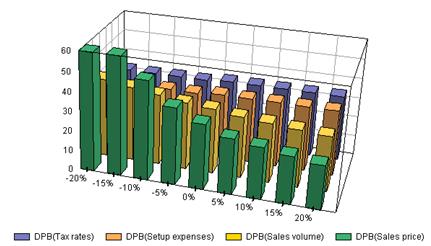
Fig. 46. Visualization of sensitivity analysis of DPB in a format of a spatial scene.
Let's review an example of visualization of spatial scenes of simulation results of project risks modeling using Monte-Carlo method. Initial data for visualization is a variation of uncertain factors, which are risk sources in case of project execution, such as the amount of investments, the cost of materials and components, the volume and cost of sales. Fig.47 shows a visual model of the Monte-Carlo method in the form of spatial scenes. The extending of the definition of geometrical model to model of a spatial scene combined with setting of left and right borders scatter of NPV (the abscissa axis fig. 47), and also the statistical frequencies of their receiving that are plotting on the axis of ordinates.
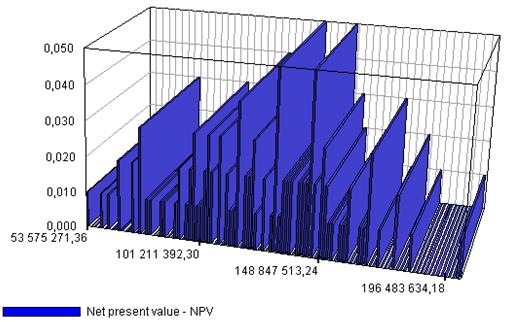
Fig. 47. Visualization of spatial scenes using the Monte-Carlo method.
Cognitive visualization of results of risks simulation using of a method of statistical tests allows to carry out the evident visual analysis of the business situation related with risks insofar as unimodality of a curve allows to judge about a low risk level.
The authors designed a prototype of system of an assessment and the business projects analysis[23], which is based of Web-oriented approach. It is possible to see the interactive version of automated Web-centric system of an assessment of business projects, having clicked on the link. The program system executes functions input of information about business projects in inquirer-format or questionnaire of the applicant, functions of execution of expert project evaluation are also implemented, leaning on decision-making models, including, and based on methods of the visual analysis of efficiency indexes of project activities.
9. Risk analysis using the methods of visual analytics
Methods of visual business analytics are intensively used also for analysis and projects risk assessment. As a rule the projects of R & D sphere have a high risk and an indeterminate results of activities and project structure. In some cases, operations may not be performed any times and the result will be obtained, and some of the work can be realized more than once (many times due to alterations, corrections, etc.). Thus, in a visual model of graphical project structure it is necessary to evolve changes, expanding its operational ability to incorporate risks and uncertainties. There are network model of the project, called models GERT (Graphical Evaluation and Review Technique) [3, 7], which allows consideration of the uncertainty in the parameters and events, and in the structure of the complex operations [6].
Stochastic network - network model, which can be execute only in the implementation of some subset of arcs [3, 7]. Network nodes can be interpreted as the system state, the arcs - as transitions from one state to another [4, 6]. Each internal node of stochastic network performs two logical functions. One of which implements a logic input function to the node, and the other - logic output function
Input function - defines the condition under which a node can be made.
Output function – defines set of the conditions combined with the result of the execution of a node. I.e. output function determines: whether to perform all operations or only one of them, for which this node is predecessor [6,7] .
Types of input functions:
· «AND». Node is executed if all arcs entering in it are executed.
· «OR». The node is executed if any arc entering in it is executed.
· «XOR» (Exclusive or). The node is executed if exactly one of arcs entering in it is executed.
Types of output functions:
· « AND ». All of the arcs coming out of the event, are executed. It is the determined output.
· « OR ». At least one of the arcs emanating from the node, is executed.
· « XOR » (Exclusive or). If the node is executed, exactly one proceeding arc will be executed.
Fig. 48 represents a visual model of GERT-network, whose nodes are events with input function is "XOR" - the denotation is "|<", and output function is "OR" - the denotation is ">". This is a wide class of network models applied in the analysis of risks and uncertainties.
Types of nodes of the network model, defined in symbolic-numeric format are the source data for constructing. Extending of the definition of geometrical model to the model of a flat picture is combined with the assignment of probabilities of operations execution or consummation of the event of network model.
Visual analysis of the project presented by the network model type GERT, can be performed using a special decision tree allowing to highlight successful and unsuccessful outcomes, due to the successful geometrization of the initial data.
Fig. 49 presents a visual model of the project with undetermined structure. Extending of the definition of the project geometric model to a flat picture model, is combined with the settings of probabilities of activities execution, i.e. there are weights upon the arcs as probabilities (for example, P01 - the conditional probability of execution of 01-operation, under the condition of successful completion of the previous events).
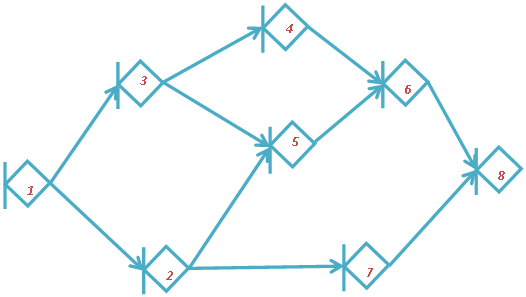
Fig. 48. Visualization of the project with uncertain structure (flat picture).
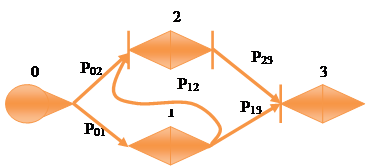
Fig. 49. Visualization of project model in the form of a flat picture.
The number of possible combinations of the project is estimated as 25=32; however, not all of them are logically possible. The decision tree presented in Fig. 50, is cognitive visual model, which displays a variety of successful and unsuccessful outcomes of the project, using model in Fig. 49 as source data for visualization. Cognitive visual model of the project in the form of a decision tree can significantly decrease the iterations number and to solve the problem of visual risks identifying.
Fig. 50 shows geometric model of the source data extended to a flat picture, displaying at the nodes of the tree the operations: if successful accomplishment without underlining, otherwise underlined. The nodes of the tree are labeled with N - in the case of a negative variant, S - in case of a positive outcome. It is possible to construct a function of a probability distribution of outcomes of the project and to calculate the expectation of the duration of the critical path and the critical value, using in the method of decision tree visualization.
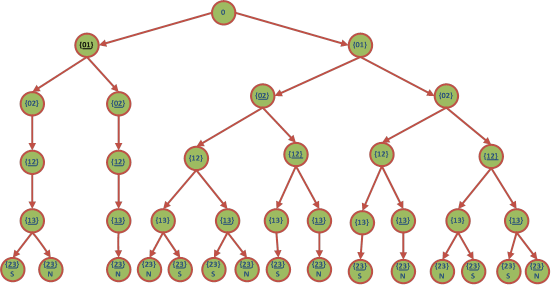
Fig. 50. Visual model of a flat picture in a decision tree of the project variants.
Let's consider the visual models in the format of the form of GERT network model Fig. 51 which may be constructed with the help of instrumental analysis tool for the projects with uncertain structure. Visual model extended in the form of flat pictures in the format of the network GERT models indicating probabilistic numerical parameters of the operations, parameters of the mathematical expectation of duration and dispersion of work duration [14, 21].
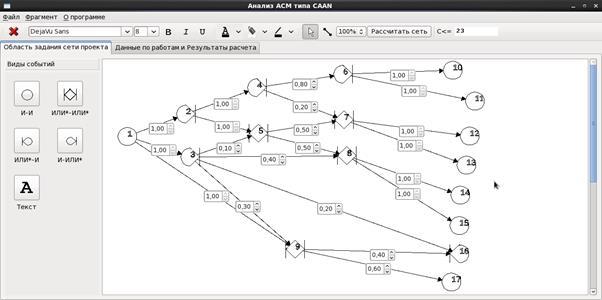
Fig. 51. Software interface [14] to create a visual model of a flat picture in the form of a network model with indefinite structure.
Using project visual analysis in the format of plane image it is possible to select the most probable partial implementation variants [7] (marked in Fig. 52 blue) due to the geometrization of initial data[6].
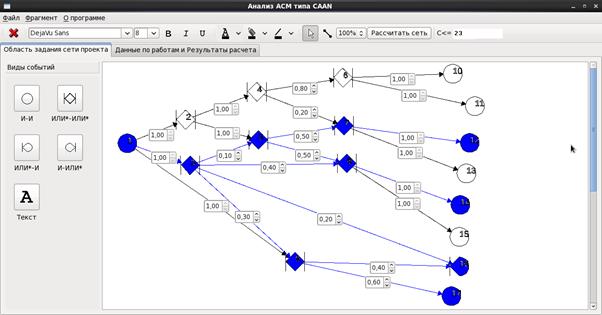
Fig. 52. Visual network model [14], extended to the flat picture.
It is possible to examine an instrumental software for creation visual projects models with uncertain type structure GERT, follow the link.
Software product performs the functions of the visual graphical analysis of GERT-type network model based on the numeric data source and allows to get possible variants of the project implementation, taking into account the most probable outcomes.
Authors developed software packages [14, 21] implements the graphical analysis of variants, taking into account the probabilistic parameters of work packages, cost and resource characteristics of operations. It should be noted that software tools aimed at visual solution of problems of this level allow to evaluate the risks of projects, which is especially important for high-tech research and development projects (R & D - projects) with nondeterministic variants of outcomes.
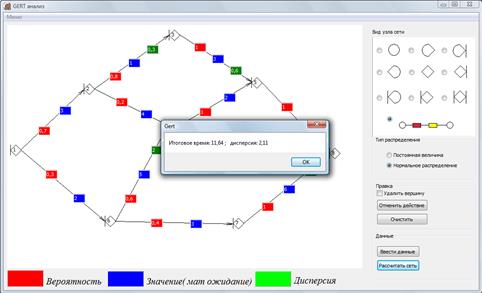
Fig. 53. Visual model, created using the applied programs package [21] for GERT-analysis.
It is possible to examine an interactive prototype of a software having proceeded on the following link. The software product provides the functionality of input and visualization of the network model of work package for both deterministic and stochastic variants, proceeding the estimation of the project duration, using the PERT or GERT method.
10. Conclusion
In this paper were considered questions of application of visual models of project management for the solution of decision-making tasks using a set of the instrumental software [13, 14, 19, 20, 21, 22, 23] which were developed by authors.
It is difficult to give uniform determination of graphic model of the project because of variety of the graphic methods used for visualization of project information [15]. However, authors aimed to describe a possible set of visual models that are used to solve managerial problems of project management sphere.
This paper presents the tasks of project management, recognized as the international standard; visual models of project structures, namely network and linear models are considered. Approach is given to the solution of tasks of project management by means of methods of visualization and geometrization of initial data.
Visual models of such structural conversions of a complex of operations of the project, as combining, consolidation, disaggregation, enlargement based on of graph theory methods are considered.
Methods for the visual analytics were used in graphical modeling of numerical parameters of the operations and of the whole complex of works in General, particularly in the case of visualization of distribution functions of random variables.
Business graphics features were used for visualization tasks, calendar and resource planning, with the use of graphical methods of accounting of resource constraints. As visual models were used linear and resource diagram of work package.
Visualization of business data and methods of visual analytics were used for solving the operative planning and management of project work package using Earned Value Technique.
It was possible to use cognitive graphic models of decision-making based on visual models of indicators of expenses and runtime of operations.
It was also noted powerful possibilities of scientific geometrical visualization of initial data for solving problems of investment and financial project planning. Complex of graphical methods involves the use of visual models in the format of spatial scenes, especially in risk modelling and statistical analysis of projects.
Methods of visual analytics and business graphics were used in the case of the task’s solution of project risk analysis, using network models of complex of operations of the special structure, added by uncertainty and probabilistic parameters of operations.
Along with existing analytical and geometrical models and methods, usage of tools and models of visualization of the business data based on development of authors is offered.
The authors suggest further intensive development of business visualization at the decision of problems of business and industry in the corporate scale, relying on powerful computer graphics processors and noting the high potential of business graphics tools usage in project managemen. This task becomes very actual in connection with the growing size of projects and the dimension of source data for construction of visual models of problem situations.
At the same time, the existing project management systems is not fully solve the problems of project information visualization. Especially, it concerns structural models of projects and operations, visual models of tasks of resource planning of projects, network models with uncertain structure and probabilistic parameters.
References
1. Pilyugin V.V. 2005. Computer geometry and visualization. Moscow, MEPhI, pp.120
2. Kolychev, V.D., Rumyantsev, V.P., 2012. About peculiarities of mathematical models of complete life cycle of innovation products. Integral, 1, pp: 50-51.
3. Barkalov, S.A., Voropajev, V.I. , Sekletova, G.I., 2005. Mathematical bases of project management. Study book. High school, Moscow. ISBN: 5060041336, pp: 356.
4. Rumyantsev, V.P., Nizametdinov, Sh.U., 1987. Net-work models design for planning and management. MEPHI, Moscow, pp: 152.
5. Rumyantsev, V.P., Nizametdinov, Sh.U., 1989. Automation of calendar scheduling of work packages. MEPHI, Moscow, pp: 137.
6. Phillips D.T., Garsia-Diaz A. Fundamentals of network analysis. 1981. Prentice-Hall, Inc. Englewood Cliffs. New Jersy, pp:456.
7. Kolychev, V.D., 2012. Planning and innovation pro-jects analysis using networks with alternative structure. Journal of natural and technical sciences, 1, pp: 278-284.
8. 12207-2008 - ISO/IEC/IEEE Standard for Systems and Software Engineering - Software Life Cycle Processes. Date views 02.04.2014 //ieeexplore.ieee.org/servlet/opac?punumber=4475822.
9. 15288-2008 - Systems and software engineering System life cycle processes. Date views 02.04.2014 //ieeexplore.ieee.org/servlet/opac?punumber=6093921.
10. Behrens W., Hawranek P.M.1991. Manual for the preparation of industrial feasibility studies. Newly revised and expanded edition. United Nations Industrial Development organization. Vienna. 1991. pp: 386.
11. A Guide to the Project Management Body of Knowledge (PMBOK Guide) — Fourth Edition USA, Project Management Institute, 2008.
12. V. Kasyanov, E. Kasyanova Information Visualization on the Base of Graph Models. Scientific visualization. Electronic journal. 2014. Volume 6. Edition. 1. pp. 21-40
13. Kolychev V.D. 2011. "Package analysis and optimization projects on time, cost and resource parameters (Project Optimization Software Tool)". The certificate on the state registration of the computer program. Federal institute of industrial property. # 2011613606, 10.05.2011.
14. Kolychev V.D. 2014. " Software system analysis and planning projects with an alternative structure". The certificate on the state registration of the computer program. Federal institute of industrial property. # 2012613420, 11.04.2012.
15. Kolychev V.D. 2014. Program realization of project management visual models. Journal of modern issues of science and education. # 3. Date views 14.06.2014. http: //www.science-education.ru/117-13219.
16. Kolychev V.D., Rumyantsev V.P. 2014. "The task of enlargement of the network model of the project life cycle". Collection of scientific articles on the results of international correspondence scientific-practical conference "Innovative transformation, priorities and development trends in the economy, project management". NOU DPO Saint Petersburg Institute of project management" SPB. 29-30 April 2014., pp. 80-81.
17. Project Expert User Guide. Pro Invest Consulting. 2008, Moscow, pp:456.
18. Kolychev V.D., Rumyantsev V.P. Procedure of equivalent enlargement and aggregation of product's life-cycle network model. Research Journal of Applied Sciences. in 2014(10) issue, October, 2014.
19. Kolychev V.D. 2014. "Program system for innovation projects time-resource scheduling (TSR Planner)". The certificate on the state registration of the computer program. Federal institute of industrial property. Moscow. # 2014611524, 19.05.2014.
20. Kolychev V.D. 2014. "Program system for life-cycle innovation product analysis". The certificate on the state registration of the computer program. Federal institute of industrial property. Moscow. # 2014613572, 28.03.2014.
21. Kolychev V.D. 2011. "Program system for innovation project risks analysis «ProRisk Analysis». The certificate on the state registration of the computer program. Federal institute of industrial property. Moscow. # 2011615795, 25.07.2011.
22. Kolychev V.D. 2011. «The software system to solving problems network optimization (NetOptim)». The certificate on the state registration of the computer program. Federal institute of industrial property. Moscow. # 2011613776, 16.05.2011.
23. Kolychev V.D. 2011. «Web-oriented system of innovative project exper-tise (ASOE Project)». The certificate on the state registration of the com-puter program. Federal institute of industrial property. Moscow. # 2011613607, 10.05.2011.
24. Frank T. Anbari. The earned value analysis method: extensions and simplifications. 17-th global congress on project management. Moscow. 4-6 June 2003.
25. Kolychev V.D., Prokhorov I.V. Application of road mapping for hi-tech projects commercialization in corporate innovative entrepreneurship. Ecology, Environment and Conservation. in 2014(4) issue, December, 2014.