EXPLORATION OF MULTIDIMENSIONAL
SPACE OF CREDIT ORGANIZATIONS
V. Shibin1,2, E. Pisarchik1, K. Gobrusenko1,2, Ju. Beketnova1,2, D. Chukova1
1 National Research Nuclear University "MEPhI", Moscow, Russian Federation
2 Federal Financial Monitoring Service, Moscow, Russian Federation
episarchik@yahoo.com
Content
Method principal component analysis
Abstract
The technique of the visualization of multidimensional data was developed on the basis of mathematical handling of multidimensional data using principal component analysis [2] (PCA) and visualization methods. They are used to extract informative attributes of objects for further classification. The resulting space of principal components was visualized through the low dimensional projections. Documented court decisions to close the fraudulent banks were used as a key for interpretation. Identified geometrical patterns can be used to detect money laundering and terrorist financing threats looming in a credit institution.
Key words: laundering of the income, terrorist financing, credit organization, threat, attribute, techniques, principal component analysis (PCA), visual analysis
Our recognition skills could run into giant problems in world of big numbers. The informational streams contain unbelievable amounts of information that need to be sorted and analyzed. We need to have tools and methods to squeeze the water from these rocks. Banks and other credit organizations have a sophisticated system of financial reports that could tell us about their financial condition as well as predict and analyze their behavior. Why then all bad banks are still on the go? The problem is the complexity of multidimensional and multi original nature of these factors. There are many typologies using banks. Each bank can have different combinations of attributes which indicate their illegal behavior. It is the situation of overwhelming avalanche of information that makes analysis very complex.
We need to understand the nature of the data and prove the hypothesis that the model exists. The visualization was used to make this with most efficient way. It is the tool to take a first glance at the field of future explorations. The visualization of the multidimensional set became a real problem that was solved by application of the PCA analysis in combination with the method of exploration of multidimensional space through subspaces with low dimensions.
Another problem was the function of objects comparison. We still know only the properties of banks but not the interpretation of this coordinates in principal components. We used a method of visual manual search of similar banks in every subspace formed by the principal components.
There are not many applied formalized methods of probability evaluation of the fact that the credit organization is involved in money laundering and terrorist financing activity.
The key problems that need to be solved before some of well known methods could be applied are defining the sources of information and attributes in particularly that will lead us to a conclusion whether organization is good or not. So the sources and the indicators must be scored and analyzed. Moreover we need to determine the connection between the abstract financial numbers and money laundering and terrorist financing activity.
This article gives description of the process and the results of approach developed at our labs. It was formed to solve particular problem but none of the steps involved specific credit organization constraints which gives opportunity to apply it to wide variety of problems.
The basis of the methodology is PCA [2] (Principal component analysis) to decrease the quantity of data dimensions and visualization to travel through subspaces formed.
The main goals specified and achieved were in extracting preview of the whole structure of data available for the research. Additional step was in declaration of first hypothesis that will lead us in forward analysis and basic understanding of cluster decomposition represented in data and their similarities with bad ones.
The sequences of actions that lead to these results are shown below:
- assembling a model of the object in multidimensional space based on information collected from experts;
- search for sources and ETL(Extraction, transformation, loading) of information from them to fill the model shaped database;
- search and preparation of the training set;
- dimension reducing techniques (PCA) to determine the most informative factors;
- separation of teaching factors that consist of information completely available for teaching set and main set and additional factors that depend on not complete set of information
- searching for samples in main set that are very close to the teaching set by the number of subspaces were each one is obviously near the bad one;
- application of RNavGraph pack of R to surf through the subspaces of data organized by principle components and getting information about forms of clusters that were formed by all objects on scatter plots
- classification of objects by their number of “close to bad” projections
- edition to the set found during the analysis were used to test the results whether we can predict the probability that shows whether this credit organization is bad or not.
This work is based on three works. First article [1] describes the attributes that the analysts think might be important while searching for red flags showing the signs of money laundering or terrorist financing activities. This work was done by experts having hands-on overwhelming experience in the field of suspicious activity detection.
The PCA analysis proved its efficiency and has shown visible results in different fields of science. It is referred to in a number of scientific papers[3][5]. The authors applied the method to their specific field of interest and outlined the results they had achieved. Though, the method has its pros and cons versus other techniques. A very detailed work was done and is described in the work of Martinez, A.M., Kak, A.C. [4].The gist of this method was formulated by Spearmen in his works [2]. These works dwell on the idea of finding the linear forms that aggregate the multidimensional spaces.
Another scientific research made the visual analysis possible. It is the work of the authors that have written RNavGraph package for R Project language. They have described the idea of multidimensional space exploration through low dimensional subspaces.[6] At makes visual analysis available and convenient to use. It could be applied for visual clustering and classification.
The model of organization is described in experts’ research work [2]. Part of the searching work was the most exhausting one. But it hardly has scientific meaning. As a results of straying for pieces of information two sets of data were created. The first one is main set that consists of banks that were at business in 2010 and still working. Next one called training set is a group of banks that have been closed for money laundering or terrorist financing(ML/TF) since 2005. We must state three main features in that data:
- The sets were created from aggregated financial reports;
- Some of the banks have not all attributes filled especially in training set;
- Time lap between training set and the general one.
These points made us make additional steps and transformations for making analysis more reliable. For reducing time lap the economical theory was used. Methods application was separated into two stages because there were lacks in data.
Method principal component analysis
And now when all preparations were done we want to attract some attention to some key problems and ways of their solving.
Let’s start with the first PCA method [2]. As it was said it was used in order to decrease the number of dimensions and extract some integral formal scores for the credit organizations. It was formed as a function from the original attributes of bank and became a new basis that has lesser dimensions than the original one and could give interesting analytical results.
k=Fk(1,2,...,m), k = 1…m’ , m’ < m.
Function Fk defines the mapping of the space Rm to Rm'.
This transformation is defined in such a way that the first principal component has the largest possible variance and each succeeding component in turn has the highest variance possible under the constraint that it is orthogonal to (i.e., uncorrelated with) the preceding components. Principal components are guaranteed to be independent if the data set is jointly normally distributed.
The solution of the problem of finding first principal component is the problem of searching for minimum
 ,
,
where - is Euclidian distance from the
point to linear diversity. Every linear k-dimensional diversity in ![]() can
be defined as multiplicity of linear combinations
can
be defined as multiplicity of linear combinations![]() ,
where group of
,
where group of ![]() run
through the , and
run
through the , and ![]() and
and
![]() is
orthogonal set of vectors.
is
orthogonal set of vectors.
From the nature of principal component method we can extract some important facts:
- resulting vectors are orthogonal
- objects got coordinates with maximal dispersion dragged from each other on maximum distance in k-dimensional space.
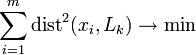
At the beginning PCA were used for the number of original parameters that are complete in both of sets. There were only 7 of them. Three main components were created during the PCA. These components described the banks actives on the first factor, activity on the second and something still not interpreted on the third. On the scatter plot below we can see projection of two factors (Fig. 1). Red dots show the dead banks.
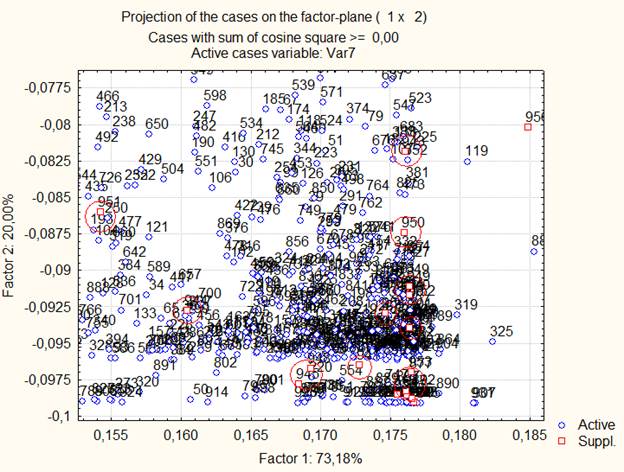
Fig. 1. first and second factor scatter plot.
After this picture was done the ambit of this dots were researched for banks that was identical by the coordinates. These banks were marked as new shadows of bad ones but with one main advantage they have much more detailed information than the original training ones.
After the first stage all 30 factors were researched through PCA. The final 8 components were visualized through the RNAVGRAPH package [3]. It gave the ability to analyze the 28 projections of 8-dimentional space.
After getting the pictures of all projections we need to scale the banks. The basis of this process is distance between good ones and bad.
First trouble that we run into was the problem of projections interpreting and defining whether they are adequate for detecting money laundering and terrorist financing or not.
Next problem we encountered when we
tried to measure Euclidean distance between banks. As the principal components
scales are very different. For example first component was measured in
thousands and third in tens. If we try to find distance in their projection
we got ![]() and it would be simple if not the fact
and it would be simple if not the fact![]() .
.
That problem needs to be examined thoroughly but in our research we used a judgmental based method. We didn’t measure the distance but we counted the projections.
When we analyzed a new projection we assigned scores for all the banks caught in close vicinity of the bad ones. At the end we got the score table of the banks which can be used for measuring the probability that bank is bad based in the majority of projections.
Some of the projections are shown on the pictures below.
а) 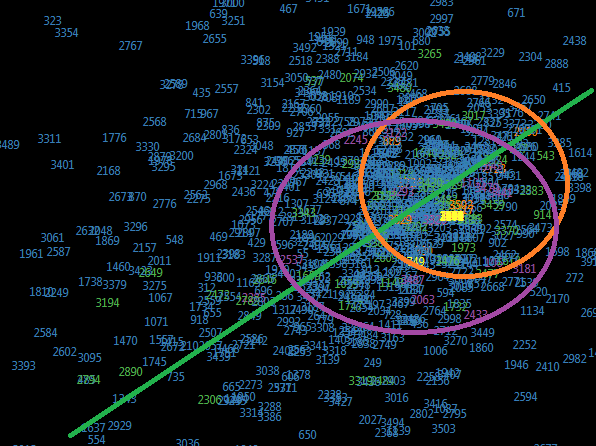
b) 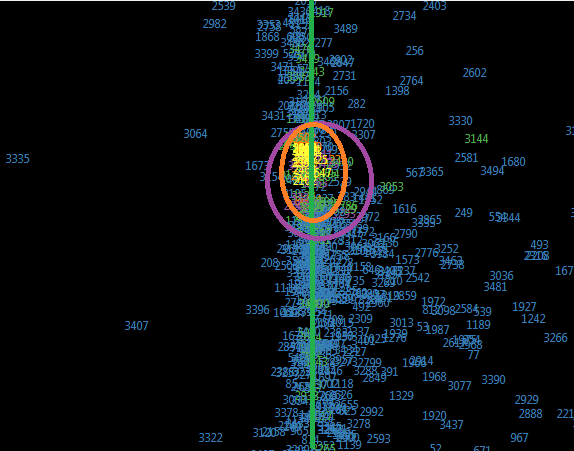
Fig.2.
Projection a) main components sixth and seventh,
b) first and fourth with suspicious zones.
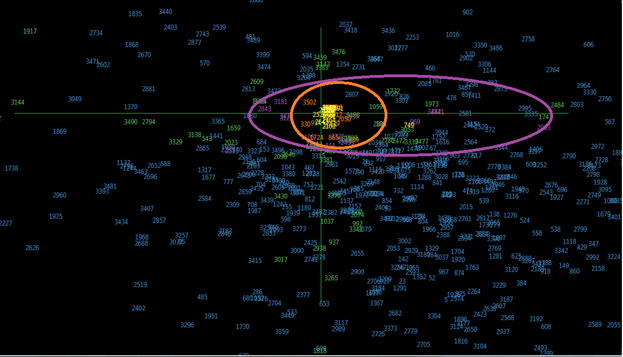
Fig. 3. Projection main components second and fourth with suspicious zones.
The complex analysis of forms and distributions in factors could be seen at table 1. All of these projections must be examined but first images show some very interesting dependencies.
After receiving these forms we tried to find if it works on the bank that had been closed recently and the result was pretty good. Half of the projections caught the banks in orange area of high probability half of them in medium probability purple area.
Table 1. Characteristics of groups in projections.
|
Projection |
Green (10% of projection) |
Purple(20% of projections) |
Orange (30% of projections) |
Experiment |
|
1:2 |
ellipse |
ellipse |
Ellipse |
side Purple |
|
1:4 |
linear |
ellipse |
Ellipse |
Orange |
|
2:4 |
double lines |
ellipse |
Circle |
Purple |
|
3:5 |
ellipse |
ellipse |
Circle |
Purple |
|
6:7 |
linear |
ellipse |
Circle |
Orange |
|
4:8 |
ellipse |
segment |
segment |
Orange |
Next steps in developing of this investigation is defining a function to measure distance in situation of different components scales while taking into consideration the importance of each component in detecting money laundering or terrorist financing.
The methodology is applicable in other spheres that use pattern recognition theory classification and clustering and still need to identify the properties of classes and objects. The conditions of this methodology are stated below:
- main dataset
- training set
- quantity in range of 1000
The proposed method allows expanding the training set when the one does not have the necessary capacity. The technique is resistant to the incompleteness of the data and makes it possible to estimate the space from different perspectives.
At this time, not all alternative situations that can occur during implementation of the method have been described. It is planned to continue testing of method for a wider range of objects to define its classification effectiveness, but the results that have been already reached in research on suspicious credit organizations show the practical usefulness of this work.
Results of the research are snapshots of banks principal components subspaces. The main outcome is actually an applied method of pattern recognition using PCA and visualization that could be use for measuring probability in the risk oriented approach. In addition visualization methods have given us source for making prediction hypothesis on data structure and dependencies.
[1] Evstifeeva N.A. Krylov, G. O., Ryabkov V. E. (2012) Indicators space for analysis of reputational risks of credit institutions, as subjects of financial and information security. Magazine of Legal Informatics, № 203, pp. 17-18.
[2] Pearson K. On Lines and Planes of Closest Fit to Systems of Points in Space. Philosophical Magazine, vol. 2, № 11, pp. 559–572, 1901.
[3] Yang, J., Zhang, D., Frangi, A.F., Yang, J.-Y. ,Two-Dimensional PCA: A New Approach to Appearance-Based Face Representation and Recognition. IEEE Transactions on Pattern Analysis and Machine Intelligence, vol. 26, № 1, pp. 131-137, 2004.
[4] PCA versus LDA//Martinez, A.M., Kak, A.C. IEEE Transactions on Pattern Analysis and Machine Intelligence, vol. 23, № 2, pp. 228-233, 2001.
[5] Preisendorfer R. W. Principal component analysis in meteorology and oceanography. Elsevier, Amsterdam, p. 436, 1988.
[6] Waddell A., Oldford R., Wayne. RnavGraph, Interactive visual clustering. SSC 2011 in Wolfville, Canada, 2011.