Scientific
Data Analysis by the Method of Extended Visualization
1 National Research Nuclear University "MEPhI", Moscow, Russian Federation
2 National Centre for Computer Animation, Bournemouth University, Bournemouth, United Kingdom
3 Uformia AS, Furuflaten, Norway
malikova@sv-journal.com, pilyugin@sv-journal.com, vadzhiev@bournemouth.ac.uk, gip@pasko.org, apasko@bournemouth.ac.uk
Content
3. Extended scientific visualization
5. Extended scalar field visualization case study
Abstract
A general definition of visualization is a mapping of data to a representation that can be perceived. Types of this representation can be not only visual, but auditory, tactile, and others directly related to human senses or combinations of them. A formal framework for mapping data to various sensory stimuli is an open research issue. In this paper, we discuss extended scientific visualization as a method of data analysis. A formalization of establishing correspondences between the initial data and multiple human perception inputs is proposed. We introduce an approach to mapping data through multidimensional geometric models onto multimedia objects based on multimedia coordinates, and illustrate this approach with a case study of scalar fields analysis involving both visual and auditory representations.
Keywords: data analysis, scientific visualization, scalar field, multimedia coordinates, sound.
Computer visualization of scientific data known as scientific visualization is considered a modern efficient method of data analysis. This method is widely used in different areas of theoretical and experimental research. Its main idea is to set up a correspondence between the given data being analyzed and its static or dynamic graphical interpretation, that is analyzed visually, and results of such analysis are interpreted in respect to the given data. Data analyzed using scientific visualization can be of different nature, and the aims of analysis can be different as well. Accordingly, the corresponding graphical interpretations can have different forms.
With such an interpretation of scientific visualization, both the stage of the visualization of initial data and the visual analysis of the obtained graphical interpretations are considered as a single integrated process. This entire process gives an opportunity to utilise enormous potential abilities of the spatial thinking of the researcher in data analysis. Further stimulation of spatial thinking can be achieved via involving other human senses besides vision, namely hearing, sense of touch and others, within such a process of extended visualization. The formalization of establishing correspondences between the initial data and multiple sensory stimuli, constituting multimedia objects, is an open research question. In this paper, we discuss the extended scientific visualization as a method of data analysis, introduce an approach to mapping data onto multimedia objects based on multimedia coordinates, and illustrate this approach with a case study of scalar fields analysis.
Visualization informally can be understood as making invisible visible, but more formally it can be defined as the process of transforming data into a visual form enabling viewers to observe and analyze the data [MCC87, GER94]. Visual analytics as a method of data analysis is based on the methods of information visualization and scientific visualization with a focus on analytical reasoning enabled by interactive visual interfaces [WT04]. A more general definition of visualization is "a binding (or mapping) of data to a representation that can be perceived" [FOL94]. However, types of this representation can be not only visual, but auditory, tactile, and others directly related to human senses or combinations of them.
Among the sensory stimuli other than visual, the usage of sound has been widely investigated since early 80-s [Y80, B82]. The human auditory perception is considered most quantitative because of its sensitivity to subtle changes in the sound characteristics. The technique of data representation using variable sound characteristics such as pitch, volume, note duration and others is called data sonification [KW99].
An extension of visualization through creating additional perceptual human inputs or more general a combination of several sensory stimuli for data representation is called data perceptualization [GS90, E04] (or data sensualization [OH96]). The typical combinations are between visual and auditory stimuli [GS90, SRSS99], visual and haptic stimuli [MCET05], or three of these stimuli applied together [OH96]. Generalizing the above definition of visualization, we can say that the purpose of perceptualization is making abstraction perceivable.
Although some efforts have been made on the development of data perceptualization, a formal framework for establishing correspondences between data and multiple sensory stimuli has not been yet proposed. The concept of multimedia coordinates was introduced and applied in multidimensional shape modeling [AOP99] and computer animation [FPA00]. This concept provides a formalization of mapping from a multidimensional geometric model to a multimedia object. We will employ multimedia coordinates here to deal with multi-sensory extensions of visualization.
3. Extended scientific visualization
The process of data analysis using scientific visualization consists of consequently solving the two following problems [PMAP13]:
1) The problem of obtaining graphical images of the data being analysed (problem of initial data visualization). To obtain such an image, an imaginary spatial scene (an assembly of spatial objects), or more precisely, its geometric and optical descriptions (models), has to be put into correspondence with initial data. Then, a graphical image can be generated using some rendering procedure for further visual analysis.
2) The problem of visual analysis of the graphical images of data being analysed. This problem is solved by the user of the visualization system. Observing the obtained graphical image, the researcher can make conclusions regarding the spatial scene, spatial objects within it, their spatial relations, shapes and textures. Then, these conclusions are interpreted in the terms of the application area where the initial data originated from. The process of the spatial scene analysis cannot be completely formalized. The efficiency of visual analysis is determined by the experience of the researcher and by their abilities in visual and spatial thinking. If the researcher is not satisfied by the results of visual analysis, they can repeat several steps of the visualization pipeline by tuning its parameters and in particular parameters of the spatial scene. As the result, the process of solving the data analysis problem becomes iterative and interactive.
As it was mentioned above, the method of scientific visualization includes spatial modeling of initial data. The introduced spatial scene is analyzed visually, i.e., sensory analysis of the spatial scene is performed using a specific human organ of senses, namely human eyes. However, in the combination with human vision, other human senses such as hearing can be used. For example, when analyzing a given scalar field, a spatial scene can be put into correspondence with it, which includes a traditional isosurface (or several of them) as well as an imaginary abstract point sound source with the amplitude proportional to the scalar field value at the given point. As a result, an additional possibility of listening to the spatial scene using sound rendering appears, and thus extended scientific visualization takes place in this case. It is worth to note that combining graphical images with sound corresponding to the initial data can make the analysis process more efficient.
In more detail, to perform data analysis involving both human vision and hearing, we need to do the following:
1) To obtain a mapping of the given data onto its representation in the form of sound. To obtain a necessary model of a spatial scene, its geometric and optical models need to be extended by a sound model. Such a sound spatial scene needs to be put in correspondence with the given data and then sound rendering can be applied with output to speakers or some other sound output device for further analysis.
2) To analyze the rendered sound and to interpret the results of this analysis in terms of the initial data.
Figure 1: Structural diagram of the algorithm of extended scientific visualization.
Fig. 1 shows a structural diagram of the algorithm of extended scientific visualization involving joint images and sound rendering corresponding to the initial data. The question of formalization of the mapping of the initial data to images, sound and other sensory stimuli remains open and it is addressed in the following section.
Multimedia applications combine hypertext, images, sound, video, animation, 2D/3D geometric models. In this sense, a multimedia object can be treated as a multidimensional object with Cartesian, visual, audio, haptic and other types of multimedia coordinates. The essence of the approach proposed in [AOP99] is introducing a space mapping between geometric coordinates and multimedia coordinates. Such mapping establishes correspondence between the multidimensional shape and the multimedia object. In this way, a correspondence can be also established between the given scientific data and a multimedia object, because introducing a multidimensional geometric model is one of the steps in the visualization pipeline as discussed in [PMAP13]. On the other hand we can envisage a direct mapping between the data and multimedia objects in some simple cases, where explicit introduction of multidimensional geometric models is not necessary or a geometric interpretation is obvious.
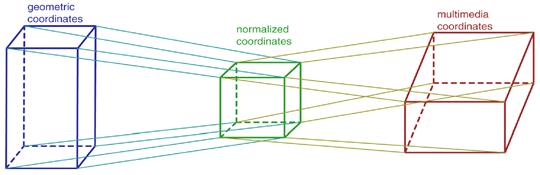
Figure 2: Mapping from geometric to multimedia coordinates using normalized coordinates.
A multimedia object can be considered a subset of the multimedia space, which is characterized by multimedia coordinates. In general, multimedia coordinate variables are heterogeneous non-elementary structures. They include 2D/3D world coordinates, dynamic, photometric, spreadsheet, audio and other types of coordinates [AOP99].
To operate with multimedia coordinates, one can introduce a system of normalized numerical coordinates (a unit cube) and its one-to-one correspondence to the multimedia space. By selecting a real normalized value, one can use the corresponding value of the multimedia coordinate. The steps in this mapping process are shown in Fig. 2. Each geometric coordinate variable takes values within a given interval. On the other hand, multimedia coordinates also have their own variation intervals. For example, a time interval means life time of the multimedia object, color varies inside the color space (RGB cube). To define the mapping, one has to establish correspondence between these intervals through the normalized numerical coordinates.
There are some special ways of dealing with the above mappings. By assigning a finite set of constant values for some geometric coordinate, one can first reduce the dimensionality of the introduced geometric model before establishing some mapping to multimedia coordinates. Generally, more than one multimedia coordinate can correspond to one geometric coordinate. Formally it means that several mappings take place. For instance, one can map a geometric coordinate simultaneously onto a color coordinate and a sound amplitude coordinate. Note that the structure of the spatial scene and the specific types of its rendering are determined by the selected mappings.
5. Extended scalar field visualization case study
Let us consider characteristics of the method of extended scientific visualization in application to a certain class of data analysis problems, where given data represent various scalar fields.
Given data
The given data represent some scalar field in a rectangular domain of three-dimensional physical space. The mathematical model consists of the values of some scalar function of three variables f = f(x1, x2, x3), where x1, x2, x3 are coordinates of points in some space, given in the tabular form at the nodes of a rectangular regular grid in the function's domain.
Filtered data
An interpolation of the scalar values at the nodes of the grid is used as filtered data. To obtain a continuous function f(x1, x2, x3) defined on the given domain, we use the trilinear interpolation.
Geometric model and mappings to multimedia coordinates
The geometric interpretation of the function f(x1, x2, x3) is a hypersurface in the 4D Euclidean space with coordinates (x1, x2, x3, f). As soon as this geometric model is introduced, we can apply mappings to multimedia coordinates. We can first assign a group of constant values ci to the function and map coordinates (x1, x2, x3) to the 3D world coordinates (x, y, z) with appropriate normalization and scaling of the domain as shown in Fig. 2. In this way, we reduce the dimensionality of the geometric model, because the initial hypersurface (and thus the initial function) is put into correspondence with a collection of isosurfaces in the spatial scene with 3D world coordinates. This mapping can be interpreted as a geometric operation of intersection of the hypersurface with hyperplanes f = ci followed by projecting of the results onto the 3D space.
In
addition, we map the coordinate f
to the sound frequency to involve both user's vision and hearing into the data analysis
as mentioned earlier. The sound frequency is defined as
w = kžf(x1, x2, x3), where k is a scalar coefficient and the
coordinates (x1, x2, x3) can be obtained by the inverse mapping
from the world coordinates (x, y, z).
The introduced mappings specify the main components of the spatial scene in the
3D world coordinates.
Spatial scene
The description of the spatial scene has three components as shown in Fig. 1:
1) The geometric model includes several isosurfaces described in the form f(x, y, z) = ci, and each isosurface is a point set
within the domain, where the function takes the value ci.
2) The optical model includes the description of the user-defined color,
texture and transparency for each isosurface to be used in rendering graphical
images.
3) The sound model includes an introduced point sound source to be used in
sound rendering. The location of the sound source (xs, ys,
zs) within the spatial scene is
interactively specified by the user and the frequency w of the generated sound is defined by the
above mapping.
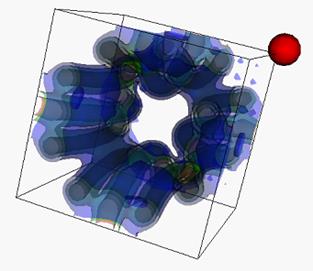
Click here to watch video of graphical and sound rendering of this spatial scene
Figure 3: Illustration of the spatial scene: the
collection of semi-transparent isosurfaces and the point sound source
(represented by the red sphere with the source located in its center).
Graphical and sound rendering of the spatial scene
The results of the graphical and sound rendering of the spatial scene are the following (illustrated by Fig. 3):
- a graphical image of projections of semi-transparent isosurfaces on a graphical terminal;
- sound wave generated by a sound terminal with the frequency corresponding to the location of the point sound source.
It is worth to note that the frequency of the sound wave is perceived by the user as the sound tone.
According to the presented concepts and the structure diagram in Fig. 1, we have developed an algorithm of extended visualization of scalar field. This algorithm has been implemented as an application visualization program in C++ using VTK [vtk] and OpenAL [AL] as instrumental tools.
We proposed to use mulitmedia coordinates to formalize the stage of mapping from initial data through multidimensional geometric models to spatial scene. In the case of extended visualization with additional human perceptual stimuli such as sounds, a multimedia object is created as a result of such a mapping. The implemented interactive software for extended visualization of scalar fields with sound rendering has been tested in the analysis of several scalar fields. The obtained practical results showed that augmenting the visual analysis with the ability to hear corresponding sounds in general allows for the more efficient analysis process.
[VTK] Visualization ToolKit. Available at: http://vtk.org/
[AL] OpenAL Programmers Guide. Available at: http://connect.creativelabs.com/openal/Documentation/OpenAL_Programmers_Guide.pdf
[AAWB10] Ahmad A., Adie S., Wang M., Boppart S., Sonification of optical coherence tomography data and images, Optics Express, vol. 18, No. 10, 2010, pp. 9934–9944.
[AOP99] Adzhiev V., Ossipov A., Pasko A., Multidimensional shape modeling in multimedia applications, in MultiMedia Modeling: Modeling Multimedia Information and Systems, ed. A.Karmouch, World Scientific, 1999, pp. 39-60.
[B82] Bly S., Presenting information in sound, Proceedings of the CHI '82 Conference on Human Factors in Computer Systems, ACM, 1982, pp. 371-375.
[E04] Ebert D., Extending visualization to perceptualization: the importance of perception in effective communication of information, in The Visualization Handbook, C. Hansen and C. Johnson (Eds.), Academic Press, 2004, pp. 771-780.
[FPA00] Fausett E., Pasko A., Adzhiev V., Space-time and higher dimensional modeling for animation, in Proceedings of Computer Animation 2000, IEEE Computer Society, 2000, pp.140-145.
[FOL94] Foley J., Ribarsky B., Next-generation data visualization tools, in Scientific Visualization, Advances and Challenges, L. Rosenblum et al. (Eds.), Academic Press, 1994.
[GS90] , Proc. SPIE 1259, Extracting Meaning from Complex Data: Processing, Display, Interaction, 1990, pp. 190-199.
[JSRSS99] Jovanov E., Starcevic D., Radivojevic V., Samardzic A., Simeunovic V.,
Perceptualization of biomedical data. An experimental environment for visualization and sonification of brain electrical activity, IEEE Engineering in Medicine and Biology Magazine, vol. 18, No. 1, 1999, pp. 50–55.
[KW99] Kaper H., Wiebel E., Tipei S., Data sonification and sound visualization, Computing in Science and Engineering, vol.1, No.4, 1999, pp.48-58.
[MCC87] McCormick B., DeFanti T., Brown M. (Eds.), Visualization in Scientific Computing, Computer Graphics, vol. 21, No. 6, 1987.
[MCET05] Maciejewski R., S. Choi, D. Ebert, H. Tan, Multi-modal perceptualization of volumetric data and its application to molecular docking, WHC '05 Proceedings of the First Joint Eurohaptics Conference and Symposium on Haptic Interfaces for Virtual Environment and Teleoperator Systems, 2005, pp. 511-514.
[OH96] Ogi T., Hirose M., Multisensory Data Sensualization based on Human Perception, VRAIS '96 Proceedings of the 1996 Virtual Reality Annual International Symposium, 1996, p.66-71.
[PMAP13] Pilyugin V., Malikova E., Adzhiev V., Pasko A., Some theoretical issues of scientific visualization as a method of data analysis, Transactions on Computational Science XIX, Lecture Notes in Computer Science, Vol. 7870, Springer-Verlag, 2013, pp. 131–142.
[WT4] Wong P. C., Thomas J., Visual analytics, IEEE Computer Graphics and Applications, vol. 24, No. 5, 2004, pp. 20–21.
[Y80] Yeung E., Pattern recognition by audio representation of multivariate analytical data, Analytical Chemistry, vol. 52, No.7, 1980, pp. 1120–1123.