Abstract
This work is devoted to developing tools for the visual analysis of tropical cyclones based on satellite data. The implemented system has an extensible set of algorithms for the loading, processing and visualization of data, mainly the spatial scalar fields. The well-known algorithms and author’s developments using CUDA technology, and shaders were used in creation of visualization system.
Keywords: visual analysis tool, animation, volume visualization, scalar field, synoptic objects, tropical cyclone, shaders, CUDA.
1. Introduction
This report concerns the problem of visualization of synoptic objects. This problem is important today because the tools for visual analysis are required for research, modeling and forecasting of flows, cyclones and other synoptic objects in atmosphere and ocean. The developments of such tools were started for a long time ago in the world. For the first time there were a software with a mostly 2D visualization. For example, the system of special effects visualization for television needs, the system WeatherEye from European center of research and weather forecasts METOFFICE or Terra3D [8]. The limitation of this system is the total absence of interactivities. The interactive 2D visualization of satellite and aero photos weather maps was implemented in other software products such as Cat5Data, F5Data, TornadoTarget. There are also the systems of data number notation and data visualization on the graphics: Lightning/2000 , LNM View [9], Weather Display [10]. These products are intended for weather forecasts interpretation and representation of current detectors registration. It required more advanced and perfect 3D visualization methods for tasks of modeling and forecasting of difficult weather situations such as tropical cyclones (TC), storms. In some systems for these purposes the universal 3D visualization packs as VolPack [11] are used. The limitation of similar approach is the absence of the special tools for preprocessing and analyzing of visualized data, and the usage of standard data formats that in turn demands additional efforts for converting of initial data and calculating results into standard data formats. Therefore the creation of special systems for synoptic 3D data visualization is still relevant today. Among innumerable real systems of such rank it should be chosen the system CAMVis from NASA [1][5] and «System of storm visualization in 3D environment» with the usage of stereovision system VERTEX with the support of NOAA project [6]. These systems differ with high self-descriptiveness and quality of visualization using the power of supercomputers. However, they are unique and not replicable. They are characterized by sufficiently complex software architecture and require specialized computer equipment. They are developed taking into account the needs dictated by the specific data formats and tasks in a specific monitoring center. The expensive super computers and computer clusters are used.
As we can see the similar systems have narrow directivity and are created for monitoring centers needs.
This report represents the visualization system of synoptic objects that is development of work described in [3]. The system is focused first of all on visual analysis of TCs and is operated on general computer engineering. The needs of satellite monitoring center in IACP FEB RAS caused necessity of system creation and demands to it. The main difficulties and demands to this system are:
- high quality rendering for the visual analysis of TCs dynamics;
- huge amounts of data;
- real-time calculations of addition parameters and real-time animation;
- necessity of combining data from different satellites;
- noise pollution and unspecified format of input data.
Our contribution:
- development of methods and algorithms of animated TCs visualization through calculating of physical field anomalies;
- usage of shaders and CUDA technology for animation mode support and acceleration of application-specific calculations;
- the implementation of a working version of the system for synoptic objects visualization, that is oriented on visual analysis of TCs according to the requirements of professionals from IACP FEB RAS satellite center.
2. Cyclone animation
2.1 Input data, recovering
The data of satellite observations of spatial physical fields in atmosphere (temperature, pressure, humidity) in TC regions are used for TC visualization. To track the dynamic of the TC it is necessary that the TC was in satellites’ zone of visibility from its initial stage to dissipation taking into account the fact that the TC is moving.
After the preprocessing the satellite data are presented as profiles (regular grid) according to the levels of height above grade. There are two difficulties in data operations. The first one is traditional difficulty – absence of meaning data in some points and presence of errors in measurements. The cause of the second difficulty is that in-orbit satellites are not able to provide required steady «visibility» of TC, so as the satellites fly along fixed orbits, and the TC path of motion is unpredictable. Therefore it is necessary to use integral measurements of two or more satellites, for example such satellites as NOAA 15, 16, 18, 19. Though two adjacent satellite measurements, as a rule, are splitted by time and refer to different regions. The time intervals between measurements can differ from 30 minutes to 12 hours. If let us assume that TC has slight changes in these time intervals, so it’s possible to use the methods of space-temporal data recovering. The different methods of data extrapolation and interpolation were considered. According to experiments the using of simple methods of recovering through neighbor and linear interpolation is enough in this case. Two methods of data joint using are applied in this case: a) integration of measurements and b) crossing of measurements. They both have apparent disadvantages and advantages.
2.2 Calculation of anomalies
If it is known that profiles in the region
have a TC and the location of its center is also evident, so it is possible to
build a profile mean value on each level of height (normal condition). The
meanings from TC outside are used for calculating of mean value, as it is known
that the condition of characteristics on the TC outside is close to regular
condition. Officially on each level of height the data inside ring with an
inner radius of
2.3 Visualization of tropical cyclone core according to anomaly map
During anomaly visualization the area - a core of the TC can be clearly extracted. There are maximal anomalies in the TC core. The 3D regular grid with the center in the center of TC is used for the TC core visualization. Each grid cell depending on the distance from the TC center is filled with the value from anomalies map. The grid dimension depends on compromise between the quality of visualization and calculations work content. In example below the optimal choice was a grid 64х64х64.
2.4 Visualization algorithms
The following algorithms of animated scalar field visualization are used in this system version:
1) algorithm of volumetric textured visualization;
2) algorithm of volumetric many-particle visualization ;
3) algorithm of isosurface visualization;
4) algorithm of tracing on shaders.
The first three of algorithms listed above were developed by authors in previous system version. There is a short characteristic below, and more detailed description can be found in [4].
Algorithm of volumetric textured visualization is based on using the OpenGL and 3D textures supported by hardware. The field of scalar data is interpreted as 3D-textere according to special scheme, and the graphics accelerator takes the further data interpolation between the grid cells.
The idea of algorithm of volumetric many-particle visualization is based on particles displaying in compliance with the meaning of scalar in considering points of volume. The scalar field images have the following characteristics for visualization: color of particles, illumination, occurrence probability. Animation is the result of permanent change of particles positions (flickering). Thus the user can conclude about scalar field structure by the character of particles distribution on frames chain.
The method of “marching cubes” is used for conversion of voxel isosurface configuration into polygonal configuration [2]. This method provided hardware support of scalar fields isosurface visualization.
3D textures, CLUT textures and shaders-technologies were used for algorithm of rays tracing on shaders realization. The first step is data upload in video buffer. The data are reduced to a format of textures with account of accelerator demands. Now these data can be downloaded in four-component 3D texture, where the first three components contain the special prepared normal in a point, and the forth one contains a restricted meaning of a scalar field.
The texture with ColourLookUpTable (CLUT) (Figure 1) is downloaded into GPU buffer on the second step. The CLUT can be created by CLUT-editor.
![]()
Figure 1: Example of CLUT texture. The color feature is taken from texture upper line, and the feature of clarity is taken from the lower one.
Further the vertex and pixel shaders are downloaded into accelerator. As the physical dimensions of scalar field are known, there is a binding to the projection of Mercator coordinate system. The cube with side equal to 1 (one) is added through process of scaling and flushing into the frame buffer, in this case the track OpenGL for cube color uses shaders downloaded before.
OpenGL provides the visibility only of those cube surfaces that are located closer to the view point. As a result shader program gets the point of entry modified into the texture coordinate system. Now it should be calculated the “look” vector in the vertex shader, that spread from the view point to the point of entry.
The light source takes place in the view point position, where the “look” vector and light vector overlap that reduces time for calculations. There is a color accumulation in the fragment shader on the principle of “from close to distant” until the ray crosses the cube bounds or the accumulated clarity reaches the meaning of “unclear pixel”. Then the further color accumulation has no meaning. On each step of color meaning accumulation the meaning of modified gradient and scalar in the point is read out from data texture that is transferred into color through CLUT.
The visualization characteristics during animation (calculation of textures, gradients, minmax scalar fields meanings and polygonal models constructing) are calculated in real time. The effective traditional algorithms are used for animation in the space.
It should be noted that module system structure lets easily to expand the base of visualization algorithms.
3. Multiprocessing
One of the requirements to a system was a possibility of its operation on personal PC with stuff hardware and on the multi processing computer system. That’s why during the system development the following direction of calculations acceleration and real-time mode support are taken into consideration: using of multi-core CPU, using of accelerators with shader- and CUDA technologies.
As the physical fields are given in the regular 3D grid points, the operations above them have a grid character. According to analysis the steps of synoptic data processing depending on its computational cost and opportunity to paralleling can be divided between the center processor (CPU) and accelerator (GPU) in the following way (Figure 2). The step of downloading, data compensation and anomaly calculation is realized on CPU in multithreading. Interpolation and characteristics transformation are executed on CUDA-core GPU. Data preparation to visualization is executed on CPU and GPU. The visualization is performed by traditional OpenGL and shader-technology.
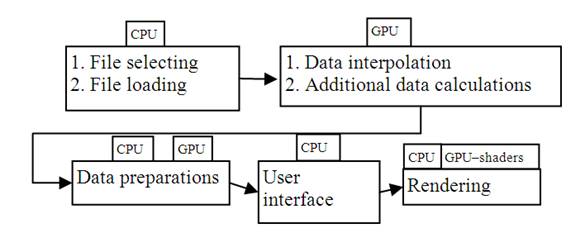
Figure 2: Steps of data processing
As all applicable calculations putting into GPU, have a grid character, all of them are well paralleled and bring approximately the same contribution in general data processing acceleration.
4. System structure
The system provides users with an interface of data control and selection; tools for their filtration and transformation; management of the renders options and camera angle (Figure 3).
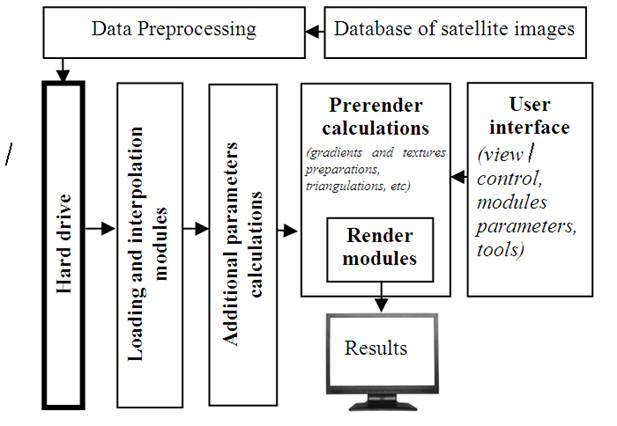
Figure 3: The users interface of the system for a data control and visualization.
5. Experiment
The system work is illustrated on the base of TC Melor real data with its time of life from 29.09.2009 till 10.10.2009.
CLUT (Figure 4) was used for visualization of the temperature anomalies in the TC core.
![]()
Figure 4: Color distribution in relation with the temperature of anomalies (0К in the middle – transparent)
The yellow color shows the anomalies with a temperature higher than 4.5K, the red color – anomalies from 1K to 4.5K (degree Kelvin), the blue color - anomalies from -4.5 K to -1K, the green color - anomalies below -4.5. The scale of grey color defines transparency.
The track of TC Melor is shown on the Figure 5 [7]. Figure 6 - Figure 8 presents the result of system work: TC Melor visualization and its expended fragments that have a special meaning for the picture interpretation.
The TC dynamic reflects the TC Melor beginning and development till its break-down. The
daily TC “breath” is well seen during the animated visualization of TC dynamic.
The TC eye (calm zone) forming is clearly seen during its crossing over
Japanese island. The clear-cut warmth of a core (of red color) is on the 20
level that is equal to
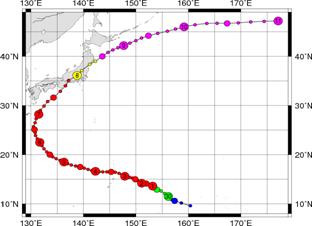
Figure 5: TC Melor path.
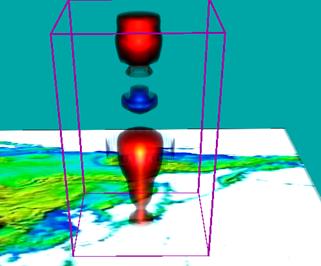
Figure 6: TC Melor crossing over Japanese islands.
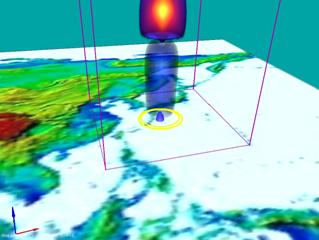
Figure 7: «TC’s eye».
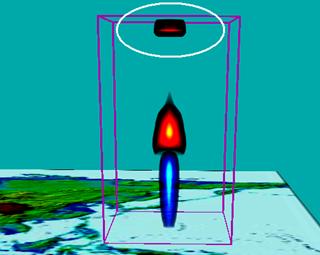
Figure 8: Excitation in troposphere.
6. Conclusion
The paper presents the current version of the system for visualization of physical fields of synoptic objects, focused on visual analysis of TCs. Experiments showed the effectiveness of the chosen method of displaying the dynamics of TCs with the help of visualization of temperature anomalies. The realized possibilities of multicore processing of the applied data using CUDA technology and rendering using shaders have provided acceptable speed of processing of huge amounts of the satellite data and a real-time animation mode of visualization. The system is currently used in the satellite monitoring center in the IACP FEB RAS. It used in the mode of trial operation for visual inspection of the primary processing of operational satellite measurements. Also it used to study TCs in the retrospective data. Further development of the system is planned in several directions: enhancing of visualization algorithms; implementation of the system on a hybrid multiprocessor architecture using multiple graphics cards; system adaptation to the demands of professionals of Roshydromet.
This work was supported by grant of FEB RAS.
7. References
[1] Green, B., C. Henze, B.-W. Shen: “Development of a scalable
concurrent visualization approach for high temporal- and spatial-resolution
models”. Eos Trans. AGU, 91(26), West.
[2] Lorensen W.E., H.E. Cline: “Marching Cubes: a high resolution 3D surface reconstruction algorithm”, "SIGGRAPH 87", 1987, pp.163-169.
[3] Melman S. Bobkov V.: “Visualization of synoptic objects”, 17-th International Conference on Computer Graphics and Vision, GraphiCon 2007. Conference Proceedings. Pp 264-268.
[4] Melman S. “Volume rendering in analysis of physical fields of synoptic objects”, Information technology №1, pp 62-66
[5] Shen, B.-W., G. Bryan, W.-K. Tao, C. Henze, S. Cheung, J.-L. F. Li, and P. Mehrotra: “Coupling NASA Advanced Multi-Scale Modeling and Concurrent Visualization Systems for Improving Predictions of Tropical High-Impact Weather (CAMVis)”. Earth Science Technology Forum (ESTF) 2010.
Arlington, Virginia, June 22-24, 2010
[6] Wang Shao Rong, Rui You, Sheng Li, Yi Song Chen, Guo Ping Wang: “Realtime Visualization of Hurricane in Distributed Environment”, Applied Mechanics and Materials (Volumes 40 - 41), Volume: Advances in Science and Engineering, pp.: 948-954, 2010
[7] Website of Digital Typhoon: Typhoon 200918 (MELOR). Available at: http://agora.ex.nii.ac.jp/digital-TC/news/2009/TC0918/index.html.en
[8] Website of terra3D- system for the scientific and media related visualization of earth and weather. Available at: http://www.met.fu-berlin.de/terra3d/en/index.htm
[9]Catalog of software for meteorologist. Available at: http://www.thiesclima.com/soft_e.htm
[10] Website of Weather Display- software for meteorologists. Available at: http://www.weather-display.com/index.php
[11] Website of The VolPack Volume Rendering Library. Available at: http://graphics.stanford.edu/software/volpack
About the authors
Melman Sergey Vladimirovich is a senior software engineer of Computer Graphics Laboratory, IACP FEB RAS, Vladivostok, Russia. His contact email is gruzd@iacp.dvo.ru
Bobkov Valery Alexandrovich, Computer Graphics
Laboratory Chief, IACP FEB RAS,
May Vladimir Pavlovich is a senior scientist of Computer Graphics Laboratory, IACP FEB RAS, Vladivostok, Russia. His contact email is may@iacp.dvo.ru